Ian Woodward's Investing Blog

Archive for March, 2008

No Blogs for the Next Week

Wednesday, March 26th, 2008

snakes

To all our faithful supporters, I am busy tied up with Ron preparing for the seminar this coming weekend.  While I am away, please be careful not to play Snakes and Ladders with your money.  We have lots of Winky-Winkies for you this coming weekend, and we look forward to seeing you in sunny Palos Verdes on Saturday. Best Regards, Ron and Ian.

Happy Easter Wishes

Sunday, March 23rd, 2008

easter

After a phenomenal week of back and forth last week where we went to and fro 300 to 400 points every day, with all sorts of intervention to try and prop this Market up, let’s hope the Easter Bunny brings us some gifts this week to stabilize the situation.  What can one say when the Market goes down when it should go up and vice-versa…it’s called an unplayable lie while I watch golf on a lazy Sunday afternoon and nothing is falling for Tiger.  It looks like Ogilvy is back after his U.S. Open win.  Well enough of golf, let’s get back to the Mark Pharr Chart, my buddy that I will be seeing this next weekend.

mark 
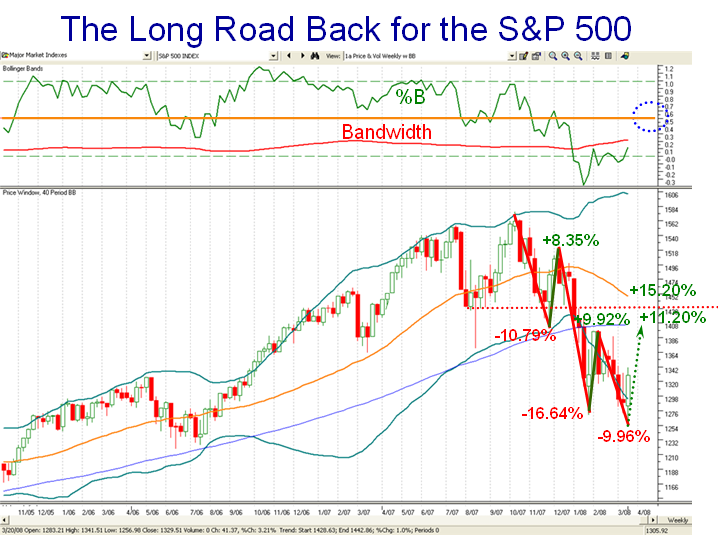
Last week I showed you the predicament we had in the Long Road Back for the S&P 500, and here it is in terms of the first and most important hurdle for the Index to get back to some semblance of strength.  As we can see from the percentages down and up from the top, we have not managed to get double digit figures for the Bounce Plays so far.  The first hurdle is to get back up above the 100 Week Average…the blue line, which implies an 11.2% retracement.  The more important hurdle is to get this beast back to the middle Bollinger Band shown with a Blue dotted oval, and that target implies a 15.2% move.  History suggests that is a rare occurrence especially when we are in a bear market which as I showed before resembles what we saw back in the 2000 to 2003 timeframe.   

At any rate, we should learn a lot about the psychology of the Market this coming week.  We should learn whether the medicine the Fed and the Administration doled out last week has turned the corner for the Stock Market or as before we get a small reaction only to fall back into the doldrums.  Please understand that the line in the sand is the Orange Line – the Middle Bollinger Band, i.e., %B at 0.5.  Incidentally, those who are watching Daily and Weekly Bongo should find that most if not all Market Indexes will show “Green” if that happens!  Here are the steps to watch in the coming weeks if we are to see some sort of recovery:

  1. The %B (green line in the Upper Window) must first get above the Bandwidth (red line)
  2. We badly need a Big Kahuna right now, a 0.4% one day change in %B indicating a strong follow through.  At least it should be a Little Kahuna of 0.24.  Don’t tell me you have forgotten all that good stuff I taught you back in 2005.  Better yet, you know that two Kahunas in a row is the ticket for a strong move up.
  3. A minimum of 13% up to get us to the natural resistance of the chart pattern as shown by the dotted red line. 
  4. Anything less than that will suggest to me that the psychology of the Market has not changed and that this is a natural bounce play which then suggests another fall back.
  5. Please understand that Fundamental and Technical Analysts alike have now homed in on two levels to the downside, and I will prove this to you at the seminar.  They are 1260 and 1150 on the downside.  If the Fed has Technical Analysts sharpening their pencils, you can rest assured they told Helicopter Ben to act early last week if they were to salvage this market and stop the bleeding at 1260, period.

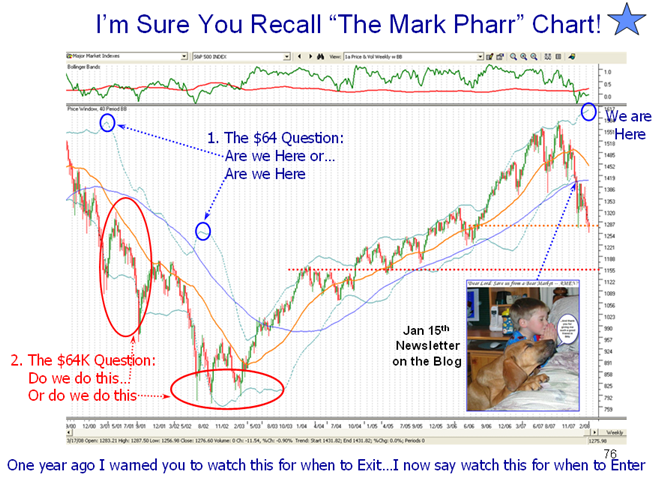
I come back to the two important questions I posed in the last blog: 

  1. Are we just starting our way down the long, long road to a severe drop of 30% (Say), or
  2. Are we already finding a bottom as we did back in 2002, and will trundle back and forth for several months before the dust clears and we head back up around the next seminar in October?! 

I gave you five points to look for on the way down on the Mark Pharr chart and now I give you five points to watch on the way back up.  If we break 1257 on the downside all bets are off and we revisit the situation at a lower level.  Don’t forget along the way, you want to see 150 New Highs before you have any assurance that this is not a flash in the pan bounce play. Those of you who understand my process should by now see that Benchmarking using Stakes in the Ground and Measuring Rods provide meaningful targets both for the upside and downside targets and PREVENT you from falling in love with any one scenario by letting the market tell you where it is headed.  By doing it that way with tests-of-reasonableness along the way, you eliminate the inner bias of wishing a scenario rather than letting the Market tell you where it is headed.  Unfortunately, all of us just shake our heads at the experience of last week so it goes without saying “This market is not for the faint of heart”. Best Regards, Ian.


Where Are We? What Do We Do?

Tuesday, March 18th, 2008

where

  1. Those of you who attended the HGS Investor Seminar a year ago will recall the Mark Pharr Chart.  Why did I label it that?  He is a loyal supporter and is a long term buy-and-hold type of the Type 4 variety.  His point to me was “Ian, tell me when to buy and when to sell…I am not a jack in the box type.”  I gave him five steps to watch from the Top of the Bollinger Band and told him that when the S&P 500 Index hit the lower band and %B had gone down through the Bandwidth (in the top window with the green line coming down through the red line), it was TOO LATE. 
  2. Fast forward nine months and in my January 15th newsletter on this blog, the one with the picture shown where the little boy and the dog are praying there won’t be a Bear Market, I mentioned the Mark Pharr Chart as my winky-winky that you all should be doing the same. 
  3. After today’s Fed action and the reaction by the Market to produce 4% up days on the Nasdaq and the S&P 500 and 3.5% on the DOW with a gain of 420 points, obviously the Bears had to scurry to cover their short positions one more time, and wondering what do they have to do to get more than their pound of flesh from the Bulls?  Let’s answer the two questions I posed in the heading of this note:  
  4. Where Are We Now? – This Mark Pharr Chart which is of the S&P 500 with 40 week Bollinger Bands clearly shows that we are at the identical spot (between friends) of where the Upper Bollinger Band is now compared to where it was seven years ago when the Bubble had already burst and the Index was headed down  (shown by the two blue rings at the top of the chart). 
  5. The $64 question is from a bottoming standpoint are we really at the top or half way down the ladder as shown by the blue ring half way down the chart as shown.
  6. The $64,000 Question is do we have one or more legs to go down or are we finding a bottom and will oscillate back and forth going sideways as we did in late 2002 and early 2003, before the start of the long bull rally from 2003 to 2007? (Shown by the two red ellipses)
  7. Only time will tell, but as you see by the Orange and Red dotted lines they correspond to the 1270 mark or the 1150 mark, respectively. 
  8. Where Do We Go From Here? – The answer is easy…You know the routine:  
  9.  Types 1&2 day and moment traders, enjoy the rally as usual but be quick to play the nimble card when the rally peters out.  Since VISA is the biggest IPO we have had in a long while if not ever, and it comes out tomorrow, I should expect the rally to continue at least into Friday when the usual profit taking should set in. (Editor’s Note! Friday is a holiday!  I’m sorry about that, so we have tomorrow to enjoy and watch your step on Thursday.)  Tonight should be yet another humongous Eureka Day, and we have come to understand that these are being manufactured by the irrational exuberance due to the Fed’s actions, whenever they inject some money into the system…the Helicopter Ben syndrome.   
  10.  My good friend Maynard Burstein says the “Wolf Packs are in the following ETF’s: XBD, XLF, IYG, IYF’ XHB, and KBE; all the financials, Brokers, Fin Services, Banks, and even the Home Builders…for a day or two!”  Likewise all the stale and tired 10142007 RonIandex had every stock of 20 up for a gain of 5.1%.  The early bird catches the worm, but watch out for the hawk above. 
  11. Types 3 and 4 sit on your hands and wait for a follow through day and hopefully some signs of the New Highs vs New Lows coming out of the doldrums and driving to at least 70 higher between the two and hopefully 150 New Highs with New Lows less than 50 soon thereafter.   
  12. The longer term depends on what happens to this picture as I also showed in the one I put up the other day on the High Jump picture comparison. 

Best Regards, Ian.

It’s a Crisis of Confidence

Monday, March 17th, 2008

day

The heading says it all, tomorrow will be decisive as to whether this Market will repair or sink lower this week.  I’m celebrating my Wife’s birthday.

Best Regards, Ian.

The HGS Investor March Newsletter Overview

Sunday, March 16th, 2008

ides

  • If I was Shakespeare writing a newsletter on the Stock Market I would start with “Beware the Ides of March”.  I am sure you all recall the famous scene in Julius Caesar where he was killed by his fellow senators on March 15, and said those famous lines of “Et tu Brute`”…You too, Brutus.  Fortunately there is no Brutus in this current predicament that we are experiencing in the market, but it is uncanny how very often at this time of the year, my starting paragraph has recalled that we are again at the Ides of March.   
  • As you are all aware by now, the exciting news is that the HGSI team has yet again turned up trumps with a new upgrade in the software, thanks to a team of our customers who developed the concept of Bongo for better defining potential entry and exit points to help in the decision process.   Many thanks to George and Matt for incorporating the requirements into the software in record time.  As I will cover in this newsletter, this new function dovetails well with the other proprietary Indicators which are all familiar to you, i.e., Hindenburg Omen, Bingo, Eureka and the High Jump.  As I explain in the text, the sequence of the linkages of the various Indicators is very important.  I also cover a recap of the Eureka Indicator when it signals a potential market rally, and I have solved the mystery that confounded us back in June and July of 2006 of seeing several Eureka signals within a span of two months which struck us as highly unusual at that time. In a sentence, New Highs on the NYSE must be greater than New Lows when the Eureka gives its signals!  Ron and I will show you why at the seminar.    
  • Ron’s movie and focus this month is on showing you his approach to use the Bongo Daily and Bongo Weekly indicators.  He explains in the text and the movie how he has adapted the indicators to be applied in the top down investing process.  Not only do they work well for market timing, they are an excellent tool to quickly isolate securities having various Bongo signals. 
  • The next Seminar will be from March 29 to 31, 2008, and it is time to get cracking and sign up.  We already have 50 paid, so if you intend on coming hurry as we have fewer than 5 seats remaining.  Sign up on the website.  It’s First-come-first-served. 
  • Additional Short Commentary:  The market is very jittery and sensitive to a lot of government intervention.  The constant barrage of news is making any normal Technical Analysis assessment essentially worthless.  Virtually all of the 416 point gain on the DOW was wiped out this week.  Next week is critical, but I have said that for a few weeks now!  Tuesday we have the FOMC, it is a short week with a Holiday on Good Friday and Visa is a behemoth New IPO to come on Thursday.  Hold on to your hats and your wallet as well.  Best Regards, Ian.

Copyright © 2007-2010 Ian Woodward
Disclaimer: Commentaries on this Blog are not to be construed as recommendations to buy or sell the market and/or specific securites. The consumer of the information is responsible for their own investment decisions.