Ian Woodward's Investing Blog

Archive for June, 2008

Bottom Fishing using the Limbo Bar

Friday, June 13th, 2008

fishing

  • Question in the E-mail bag: TKC was a momentum stock just 6 months ago that has broken down. Probably on the HGSI lists then.  I am interested in this one for I like to buy growth stocks whose growth story is still intact yet off 30-40% from the high.  Has anyone looked at this one technically to see if it is triggering a bottom here?  Any info appreciated.  SKI

  • Response: SKI:  You certainly know how to pick a broken down bottom fish “personified”!Your question was whether this stock had found the bottom, and it certainly has signaled “a” bottom:

  1. Two Bingo signals within three days, including yesterday

  2. All X Factor Bongos Daily, Weekly and whatever else showing red

  3. %A/D (Acc/Dist) at -16.3%, which is a C-, close to a D.

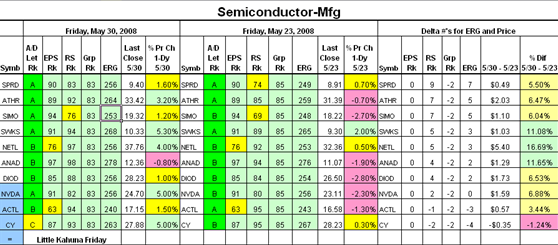
  4. Two negative Little Kahunas, two days in a row a week ago

  5. The 200-dma High Jump at -24.26% is lower than it was on 7/17/2006, when it was at -23.86 @ $9.72

  6. A Gap down this week, which says it could go lower, but today has perked up from bottom fishers

  7. However, it is giving up the 50c from the bottom today, so maybe it will disappoint even them

  8. All of that should be enough to stiffen your backbone that this may be just the type of stock to gamble on

Note I said “a bottom” and not “the bottom”, but you are a master at that, which is not our cup of tea.  However, that little example shows you that you can use HGSI for whatever style you want to use and just look for all the negative signals to look for candidates.  Good hunting, Ian. 

  • Follow-Up reply: As you correctly note this is A Bottom and maybe not THE Bottom. The whole group is looking bad here. However currently at these prices it is getting interesting.  And I think reading between your lines below it could very easily go lower here and looks it is going to the 15 support line which is a very near possibility.  I am waiting here for a better risk return at 15.  And yes the HGSI can help me here better with these beaten down stocks I like to buy. I guess a 180 degree reverse HGSI approach but none the less HGSI can also spot the downtrodden ones and I think the group is bottoming and time to get together my buy list on good divy ones like DT, NZT, FTE, PHI………Thanks for the great reply, Ian
  • Response: Ah SKI:  Your beady eyes spied my winky-winky that there may be more to go to the downside.  So let me show you how your suggestion that it could go down to $15 is in the ballpark by doing a test of reasonableness using the same tool…using the High Jump.  However, in this case we call it the Limbo Bar, since we are dealing with negative numbers below the 200-dma, the 50-dma or the 17-dma. 
  • If you have Ron’s standard files, go to your charting module and bring up the 7a High Jump Individual Lines into the View.  Now trot back to 5/22/06 and put your cursor on that date and open the Data Window.  It should show that the High Jump for the 50-dma for TKC was -24.9994 to be exact on that date…which means that it was -25% below the 50-dma for its lowest reading.  Now come back to yesterday’s date and you will see that the 50-dma is at 19.6476.  So 25% down from that gives us $14.74…a good test of reasonableness for the lowest bottom fish one can hope for if history repeats itself. 
  • So for all you bottom fishers, here’s a handy-dandy tool in the HGSI Software to confirm your T/A on where there is natural support at the low comparable to your 8/16/07 Base Low.  Now if you are really good at this, you might try the 17-dma, but be crafty enough to find three readings around the previous lowest level for it which occurred around 5/22/2006.  
  • Date           17-dma   Cur. 17-dma  Low Target
  • 5/19/2006   -16.4472     18.7288       $15.65
  • 5/22/2006   -22.3603     18.7288       $14.54
  • 5/23/2006   -12.5978     18.7288       $16.37

 Now you have it all…anywhere between $14.50 to $16.50 will be close enough for gov’t work.  Since it hit $16.87 two days ago for a low, the bottom fishers felt it was time to nibble.  If the market turns up and the gap today holds, they may be right.   Of course, most of us are lazy and just eyeball the previous low and make the call.  You are right to use the Wolf Pack concept so that you can see when they are coming out from the cold.  Ron will have an excellent Movie for the Newsletter on this subject of strong and weak Wolf Packs which will be out this weekend, so enjoy.   

Best regards, Ian.

P.S. I realize that for those who are not HGSI Software users some of the acronyms and “sayings” are not familiar to you, but I hope you get enough of a feel for the overall intent and value of notes like this that are specifically aimed at answering user questions.  If you like what you see why not try a free 60-day trial.  Just click on the link below and we will take care of the rest.  Ian.

HGS Logo
Try a 60-day free trial subscription – no credit card required for sign-up.

The Phantom Hindenburg Omen!

Saturday, June 7th, 2008

A heads-up from the e-mail bag!  OK now I am confused.  I just updated my HGSI data base this morning and there is no Hindenburg.  Then I took my notebook that was only updated thru last night and yes, there was a Hindenburg. So….. what is the market implications of a fleeting Hindenburg signal?   Hmmmm, maybe just a short downturn? I could only hope.  At least one Hindenburg does not mean a definitive downturn, but it should tighten up our stomach as it serves notice that not all is well in market land.

                    phantom

Hi Jeffrey:  False Alarm! I’m glad to see you are on your toes, but don’t be confused…so always do an update the next morning is the lesson learned here, especially on an extremely volatile day.  The data feed from Reuters will invariably get updated the next morning.

  1. As Paul mentioned last evening the New Highs were 132 and the New Lows were over 80 from my memory.  This morning’s download took the numbers down to 81 to 67, respectively, so no Hindenburg Omen…but close enough to suggest a very unstable market as we well know.  For those who are students at this game, all you need to remember is that both must be above 79, as two of the several items to trigger.  The crafty architects of the Hindenburg Omen had no flies on them (only blue bottles) as they also required the 50-ema to be rising from the previous day while the Mc Osc has a knee jerk down with a negative reading.  All clever stuff, but cannot account for the spurious signals when the NYSE Index rises nearly 200 points one day and then goes down over 250 points the next day. 

  2. For those who prefer to be in their foxholes as Type 4 long term buy and hold, the only thing to watch is the New Highs on a daily basis.  I am a broken record on this point, but I keep emphasizing it until it will finally register.  We need New Highs on the NYSE to exceed 150 for at least a first push, and then for several days consistently stay above 100 and New Lows below 50 say before any market rally can turn into a full fledged Bull Market.  As we would expect, the New Lows have behaved themselves since St Paddy’s Day, but all boats have not risen enough to repair the damage done from November to March to give adequate New Highs. 

  3. There will be Lone Ranger Hindenburg Omen signals during a long Bull Market Rally, but remember that a single signal is discounted as there must be at least one confirming signal to follow.  The fact that both the New Highs and New Lows have to be above the famous 79 (obviously manufactured to deliver as few back tested situations as possible) is that while there is excessive exuberance by the herd, the professionals are selling…hence both New Highs and New Lows are up.

  4. Now we can expect the market to trundle on down and close a few gaps while the Oil speculators play shenanigans again, all of which is getting a trifle tiresome.  If this keeps on it will eventually blow up in our faces with the proverbial hitting the fan as the saying goes, and only then will something be done to get things straightened out.  It is a sad state of affairs but that’s “When Bubbles Collide” as John Mauldin reminds us in his billadoo of today.  By then it will be too late!

Keep your powder dry and may all your trades be winners is the wish of your friend, Ian. Late Breaking News!  I have had two feedbacks in the Comments Section of this note and I thank both readers for indicating that according to the Wall Street Journal Database their records show that the numbers are 95 and 89 for New Highs and New Lows, and that would trigger an Hindenburg Omen on Friday.  As I say in my response: I will refer the differences to our data source and see if we can get any feedback, but I would tend to accept the Wall Street Journal info for now.

The more important point is that we have a very jittery market, and it is certainly time to take cover. At any rate, we are alerted and will keep an eye out for any follow through signals.  Best regards and thanks again, Ian.

Technology is on the Move Again

Sunday, June 1st, 2008

With Oil sputtering and hot Wolf Packs tiring, Technology Stocks have begun to awaken for a potential move up after losing 25% since November of 2007.

tech 

  • As my good friend and partner, Ron Brown, explained in his movie this weekend the Technology Sector was hot last week and the Nasdaq 100 along with the Nasdaq were strong.  In retrospect both Google and Apple reported revenues of 42% and 43%, respectively, higher than a year ago.  Mergers and Acquisitions are also picking up in the Technology Sector.  Also, the Russell 2000 which has been generally weak has come on these past few weeks.   
  • Last week I gave you an early indication with a long discussion of the Semiconductors (SOX) Index, showing that it was gearing up for a move that occurred on Friday…granted that it was a tepid breakout above 409.  That is all the more reason to sit up and take note of where the opportunities lie.  In the following charts I show you the change in the Market Indexes from the horrendous week we had over a week ago and the recovery this past week. I show the major change in some of the key Technology Groups that have moved this past week and then an updated view of the Semiconductor Mfg Group based on last week’s performance. 
  • You will recall in the last two blogs that I had been bemoaning that we were so close but yet so far for all Market Indexes from clearing the key short-term hurdle of the 200-dma, but I am happy to show you that things have improved substantially this past week.  Note that Bongo Weekly signals have remained strong, but there is a marked improvement in the Bongo Daily which has jumped up to ten from two the previous week.  Also the Acc/Dist picture has improved as shown in the diagram below:

 markets

Many moons ago, I coined the terms Delta ERG and Group Speed and the chart below shows exactly what I mean.  Note how the Computer – Enterprise group jumped 24 points from a low Group Rank of 35 to 59 in a week, while Delta ERG shows the total improvement.  The left side of the chart shows this Friday’s data, and the right hand side shows the INFORMATION to help you see the changes from the past week:

groups

This next chart updates the information of the previous week on the Semiconductor – Mfg stocks to watch.  Note I show that three stocks had Kahunas last Friday, implying they had strong momentum and should be watched this coming week, despite their negative changes in ERG.

s2Best regards, Ian

Copyright © 2007-2010 Ian Woodward
Disclaimer: Commentaries on this Blog are not to be construed as recommendations to buy or sell the market and/or specific securites. The consumer of the information is responsible for their own investment decisions.