Ian Woodward's Investing Blog

Archive for January, 2009

After a Historic Inauguration, Whither Goes the Market?

Wednesday, January 21st, 2009

After an historic Inauguration which had “Hope” and “Openness” as the main themes going forward, the country shared a time of unity as we watched the pomp and circumstance of the traditional ceremony which we have come to expect and enjoy.

                  penguin

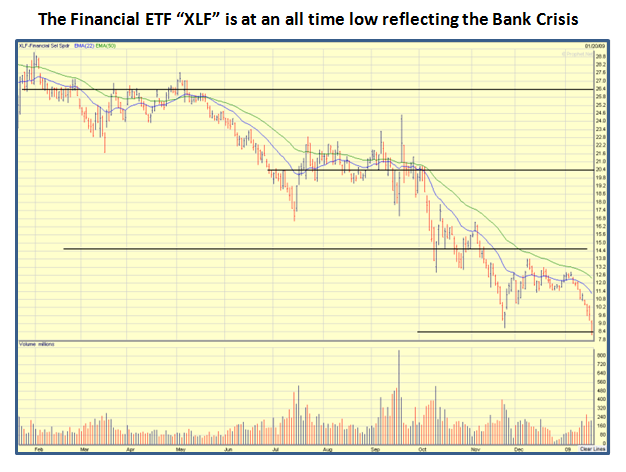
Today we come back down to earth as we listen to Tim Geithner testifying at Congress, and we realize the enormity of the task ahead when he said “When Trust and Confidence is lost, it is difficult to get it back”.  Dead Banks walking is another catchy phrase in vogue at this time and yesterday’s 300+ drop on the Dow and over 5% drops in most of the Indexes show the major concerns in the Stock Market, exemplified by the XLF falling to its lowest level at around $8.10.

xlf

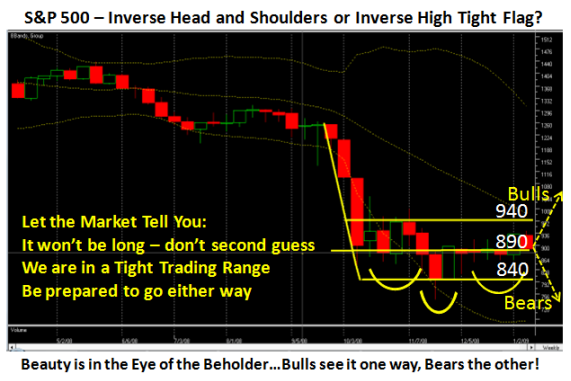
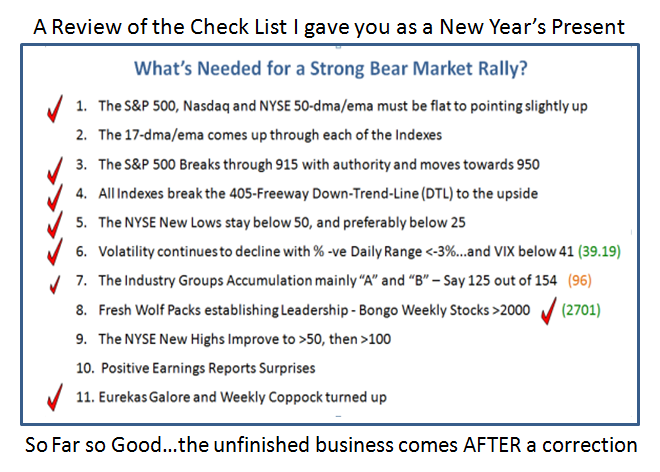
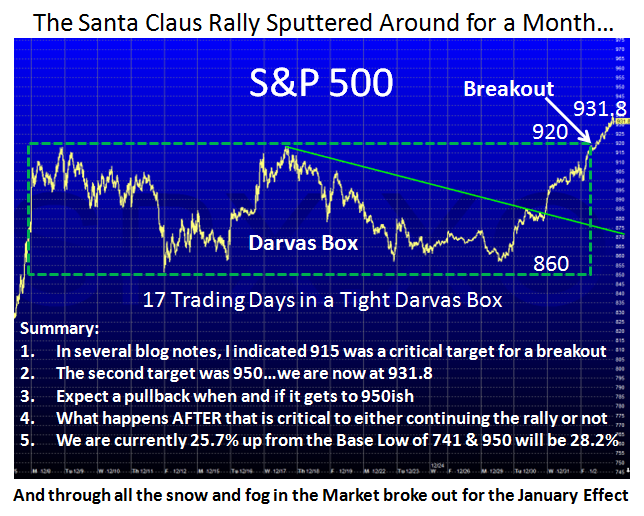
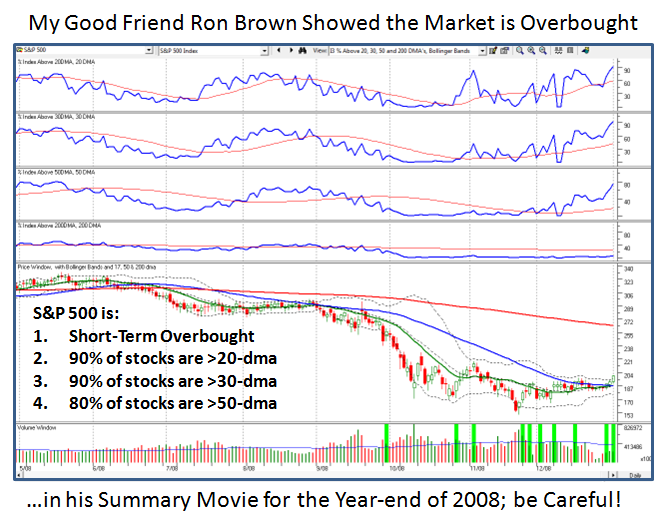
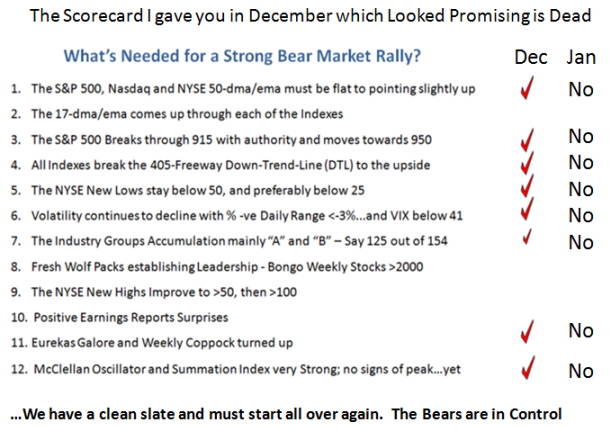
But that is all water over the dam and we can only Hope the new Government will find efficient ways to get out of this Financial Crisis, to renew the nation’s trust and confidence, and eliminate the Fear and Greed.  To come down to our level, the Hope of a decent Bear Market Rally is over and now we are back down to the Fear of testing and then undercutting the recent Low of 741 on the S&P 500.  Heaven help us if we do!  As you can see from the Chart below all the criteria that looked promising have now been destroyed and we must pick ourselves up, dust ourselves off and start all over again:

targets

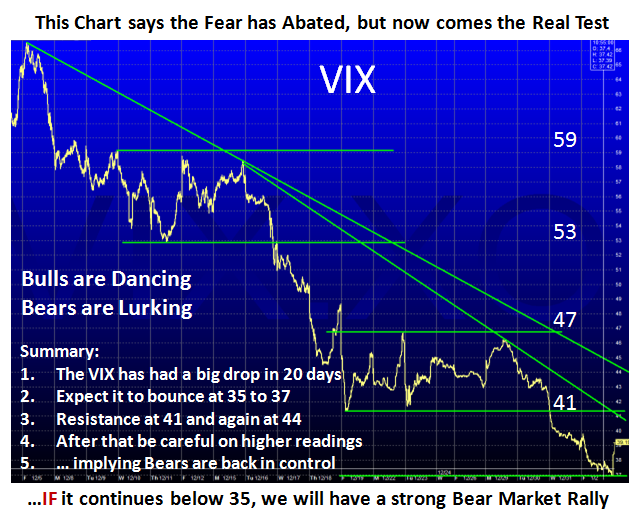
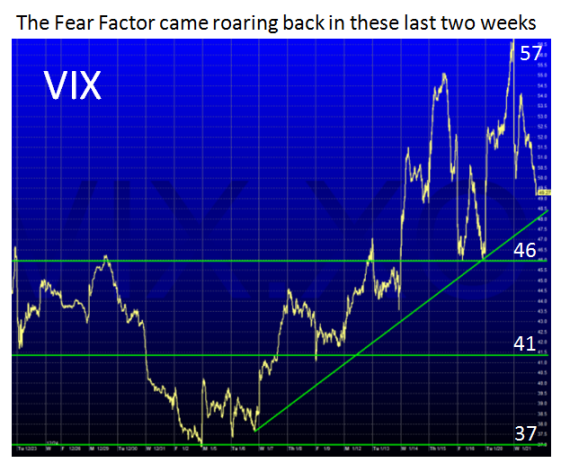
Those of you who follow Ron’s and my work closely have seen the Research I have done to introduce us to a new Indicator called “Phoenix”, which in conjunction with Eureka will hopefully show when we transition from coming out of the ashes to a new beginning.  We began to see that promise as we dropped to a New Base Low of 741 on the S&P 500 and the meager Bear Market Rally we eked out into the first week of January.  Sad to say that we have witnessed two Phoenix signals on the 14th January and again yesterday, the 20th of Jan…indicating that the Fear is back and the least line of resistance is down.  The VIX hit a peak of 57 yesterday so we have a long ways to go to see it drop below 40 which is where it was at just two weeks ago.  So the Bears are in control once again, and until the VIX drops below 40 there is little hope of a new full blown Bear Market Rally.  It was good to see it close weak at 46.42 to give some signs that the Fear was abating, and that the shorts were presumably covering their positions.  The chart below was recorded an hour earlier, so there was a dramatic drop since then when it was at 49+.

vix

At least the market is up strong today but I don’t have to tell you that it will take more than 280 points up on the Dow to get us out of the hole we are in from this past two weeks.  Still, beggars can’t be choosers, and it is a good start.  Tomorrow, the S&P 500 will need to break 840 to the upside with authority and follow through quickly above 870 before there will be any new signs of HOPE for a Fresh Start!  That would set the “Re-test” Low so far at 805, which is much healthier than trotting all the way back to 741.
Best Regards, Ian.

Bear Market Rally – It’s a Toss Up!

Sunday, January 11th, 2009

It has taken three months of trading in essentially a tight trading range to finally
produce a classic conundrum for the Bulls and Bears.  We have now reached the
point where it becomes a toss of the coin as to which way the Market goes.

Coin Toss

As I often say, “Beauty is in the eyes of the beholder”.  If you are a Bull, the T/A types
will favor an Inverse Head and Shoulders; if you are a Bear it’s an Inverse High
Tight Flag.  Since we are in a Bear Market Rally the long term trend is still down:

chart

When the direction is not that obvious, don’t second guess the trend…let the
Market tell you which way it is headed.  Be prepared to go either way for the
Type 1 and 2 Traders who are nimble.  For Type 3 sit and wait is the best call at
this stage if you have not participated in the tepid Bear Market Rally so far,
despite the fact that we are up over 20% from the Base Low.

If you are in the Market, then the Lines in the Sand at 840 and 940 tell you what
to do either to the down side or for the next leg up out of this mess.

In the short term, what are the two big factors for the week?  My guess is:

1.  The Bulls feel there is euphoria in the cards with the coming Inaugaration

2.  The Bears point to the expected poor Earnings Reports to come

Take your pick.  Best regards, Ian.

Santa’s Late Delivery…The January Effect!

Saturday, January 3rd, 2009

I had virtually written off the Santa Claus Rally when it sputtered for three weeks before the Holiday, but it came to life with a Late Delivery going into the New Year with the so-called January Effect.

                              santa

In my last blog of 2008 I showed a Check List of a sequence of events that I felt had to occur for us to see any form of a decent Bear Market Rally going into the New Year.  As you will see from the list below many of these items have occurred in the last week or so, and those that have not are either knocking on the door or were included to expect a confirmation that the Rally was indeed on:

check list

To our surprise we found that things began to stir the day after Christmas and finished this past week very strong with a decent move of around 3% on the Major Market Indexes.  Above all, we finally broke through the target of 915 and are half-way to the next target of 950:

S&P

We can see from the summary notes on the chart we are now over 25% up from the Base Low and this is where we normally expect some form of correction sooner than later.  Since we have two weeks to go to the first big blush of Earnings Reports which then peak by the first week in February, we might be able to eke out a move to 950 or so before we see a pull back.  It is what transpires after the current rally peaks as to whether we continue with the Bear Market Rally or once again fall back into the doldrums to retest previous lows at 915 and 860 where we should see support.  Anything below that and I am afraid it was all for naught, and only short term players would have benefitted by being nimble both on the way up and down. 

It has been a while since I gave a full review of the VIX “My Way”, so here are four charts that lay out chapter and verse of what has transpired with the so-called Fear Factor which has abated considerably, but as we shall see we are now nearing the point where the Bears are lurking and ready to pounce while the Bulls have been dancing:

decline

This next chart shows how low the VIX has retraced on the Fibonacci scale as it has retreated
almost 75% from its high, is close to it’s lower Bollinger Band, and is at the Connor’s >5% rule
below its 10-dma where the “VIX Bears” watch for any signs of a recovery to pounce in on the
short side of the market.

blach chart

However, there still seems to be some room for the Bulls to dance  as we look at the longer term picture using both an 89 and 40 period Weekly Chart of the Bollinger Bands.  If we are to look at this with rosey tinted glasses, there is still room for the VIX to descend to get down to at least 35 or even as  low as 27 before we see a jolt back by the Bears.

89 and 40

As my Christmas present to you, I showed you how I used the High Jump with the Moving Average crossovers to pinpoint that the momentum of the market was in driving for a Lower VIX with the 17-dma crossing down through the 50-dma, and I am glad I called that right.  Since all short-term Moving Averages are still pointing down it suggests we still have some time for this market to continue its rally…maybe for a couple of weeks more with luck, before we see a pull-back.

high

Last but not least, to bring us back to our senses so that we don’t get too carried away with euphoria I show you a chart which my good friend and partner, Ron Brown, showed in his Weekend Summary Movie where he reminded us that the Market in general is short-term overbought.  Note how the readings of the stocks above their various moving averages are all at the upper end of the spectrum where one should at least be alerted to a pull-back.

overbought

I wish you a Very Happy New Year and may all your stocks be winners!

Best Regards, Ian.

Copyright © 2007-2010 Ian Woodward
Disclaimer: Commentaries on this Blog are not to be construed as recommendations to buy or sell the market and/or specific securites. The consumer of the information is responsible for their own investment decisions.