Ian Woodward's Investing Blog

Archive for January, 2010

Bounce Play or Plunge into the Abyss?

Sunday, January 31st, 2010

As my good friend Mike Scott said to me;  “Let you know in a couple of days or a few weeks”.  The supposed bounce this past week never materialized, despite the good news of a 5% growth in GDP, and the relatively good Earnings Reports including the Tech Stocks which took a beating.

fool

The Sandstorm blew last week in favor of the Bears and the tepid bounce was hardly even a Dead Cat Bounce.  So you will notice that I have lowered the target for a deadcat bounce to 1100.  Note that drops of 15 points per day on the S&P 500 have taken us down to 1074 and we are but another 16 points away from the Big Line in the Sand of 8% down, i.e., 1058.  So we could see that this coming week.

sandbox

More importantly the mood is now somber all around.  I’m not telling you anything you don’t know already, but it will take a major turnaround of events to instill some life back into this rally.  We have only to look at the key internals we watch to see that a lot of damage has been done since the S&P 500 reached its peak of 1150 just 9 trading days ago.  The next four slides are well known to you so here they are in quick succession:

mc

200

a

e

Now I come to a new beast, which my good friend Bill Roberts and I are working on.  The challenge was to see if we could give insight into how red was red and how green was green on Bongo Daily and Bongo Weekly.  This is work in progress but it might open your eyes that we are onto something. 

I will show you a snapshot of Bongo Daily to whet your appetite.  As you well know we use RSI 8, 14 and 19 ema as the basic crossovers to establish a trigger of Bongo Up or Down, and we struck on the idea of looking at the actual components of 8 up or down through the 14, and 14 up or down through the 19.  These are depicted by red and green, respectively in the chart below.  The demarcation line is “1.00” as shown by the dotted horizontal red line.  The higher the two lines are up from the dotted line at 1.00, the stronger is Bongo Daily and vice versa.  So we are in the dumpster at the moment!

bongo

So I summarize again by saying there are two scenarios:  A Double Dip before a strong bounce outlined in Blue or a single dip and a quick return to recovery.  I sense the former is more likely!  I don’t think I am mistaken that there is a change in psychology that has taken place these last couple of weeks as good news is being ignored and negative news carries more weight.

Best Regards, Ian.

The New Buzz Word – Populist

Sunday, January 24th, 2010

Last week was a bad week for the Stock Market – it has the Heebie-Jeebies, i.e, the Jitters are very apparent and of 2008 proportions with a 500 point drop in the DOW.   This week can add fuel to the demise of the 10 month rally we have enjoyed since March 2009 or give us a renewed boost to the rally.  It stands to reason that Politics more so than Earnings will be front and center as we look forward to the vote on the Fed Chairman, Ben Bernanke, and the State of the Union Address by President Obama on Wednesday.  The REACTION by Wall Street to both may seal the fate of the rally and bring about the Intermediate Correction that so many have touted for so long, or find a fresh move to the upside to continue the rally and keep the Golden Cross alive.

pic

The Internet seemed to enjoy the Custer’s Last Stand blog note last week as I laid out the simple process steps that would cause Long Term Buy and Hold Investors pause for concern.  Sad to say the resulting action happened inside three days flat with successive %B 1-Day Down Kahunas driving it down through the Bandwidth to finish with a negative reading of – 0.27, a number not seen since the Gloom and Doom days of 2008 and early 2009.  Here is the updated chart:

nyse

As a result, the Playing Field for the Ball Game next week has shifted heavily in the Bear’s favor.  The chart below shows the various Lines in the Sand for either a reasonable Bounce Play back above Custer’s Last Stand and beyond, a Dead Cat Bounce to the obvious resistance at 1115; this would then lead to a Bear Feast of a Minor Correction of -8%, or something deeper that would end in an Intermediate Correction of -10% or worse.

field

It hardly seems that six months have gone by since I first discussed the Golden Cross in the July 19th 2009 Blog Note, but I felt it worth showing you the progress that the Stock Market Rally has made since then to cheer you up!  You will note that the results have been every bit to the High Side relative to past history, and projecting its progress for the next six months to mid-2010 would put the S&P 500 at around 1250.  The alternative is a downside swing which could lead to a Black Cross where the 50-dma crosses down once again through the 200-dma at an estimate of about 1025. Here are the results:

            ss

cross

Next week should be an interesting week one way or another.

Best Regards, Ian.

Stock Market – Custer’s Last Stand

Thursday, January 21st, 2010

I gave you a Game Plan for Type 3 Swing Traders in my last blog, and that seems to have shown you the correct Playing Field as we ying-yanged back and forth between the upper boundaries I showed.

roadmap

Sad to say that as I write this we are now down to Custer’s last Stand, so the Swing Traders know exactly what to do.

last 

The Optimistic View:  Now we come to the Type 4 Buy and Hold Types who want to stay a while longer if only this market doesn’t run out of steam.  Having reached 1150ish on the S&P 500 and 2326 for the Nasdaq, the upper boundary next targets are 1200 and 2400, respectively:

opto

We come now to the present and here is the Chart that alll Type 4’s are following:

buy

Since the 2009 rally has had an uncanny similarity to that of 2003, we can emulate a possible correction where I have “stuck” the next six months on the Right Hand Side to emulate 2004 in 2010 as one possible scenario:

2010

Now we come to the Game Plan for all who value what they have in their 401-K:

steps

…And here is the current status, with three legs done and two to go.

nyse

I’ll give you one last winky-winky…If %B comes down to -0.20 or greater, run for the hills!

Best Regards, Ian.

Stock Market – Short-Term Game Plan

Tuesday, January 12th, 2010

I am in the middle of feverishly writing the Newsletter due at the end of the week, but felt I could give you a Heads-Up to summarize the Stock Market Short-term Game Plan:

       pic

My good friend Chris Wilson is a Guru at Point and Figure Charting, so I think he will get a kick out of this simple chart which I hope says it all for a Short Term Game Plan:

   chart

Best Regards, Ian.

The Stock Market Tsunami Warning Signs

Saturday, January 2nd, 2010

In my e-mail bag, I had a good friend Bill Jagoe who attends our seminars, ask a series of questions regarding exit and entry for Type 4 Buy and Hold Investors, so here is my detailed response to him:

picture

In the weeks and months to come, I hope this blog note will serve all Type 4 Buy and Hold Investors by helping them stay on the right side of the Market, just as earlier blog notes did when it was time to exit back in 2007 and 2008, and then come back in 2009.

Question:  Could someone tell me how Type 4 investors should use Ian’s Mark Pharr Chart view?

Ah Bill…I sense the Type 4 Buy and Hold Investors are getting a trifle fidgety and want to have their ducks lined up for a proper exit!  You are in luck, as not only will I cover the Mark Pharr Chart but also the Bill Jagoe Chart as I will elevate you to the peerage in the History of Using Bollinger Bands (BB’s) for Type 4’s.  Here is a full explanation as promised in my bb note to you.

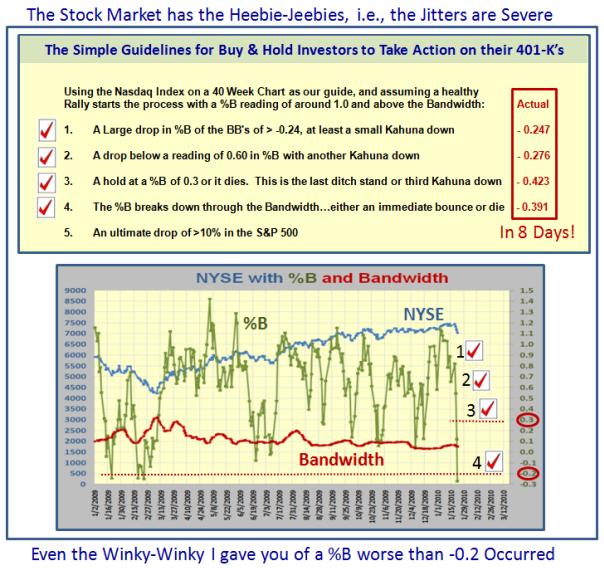
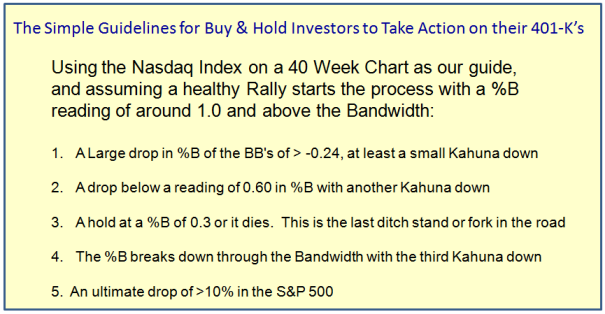
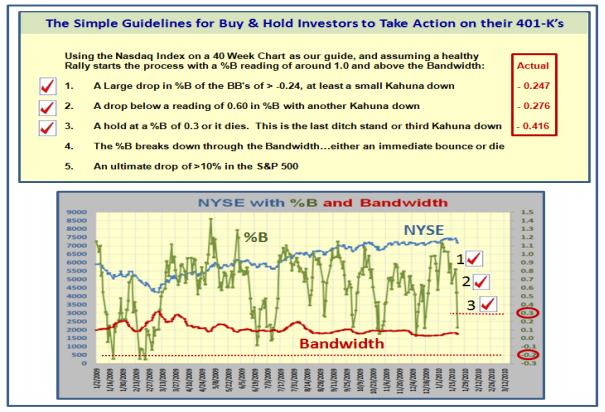
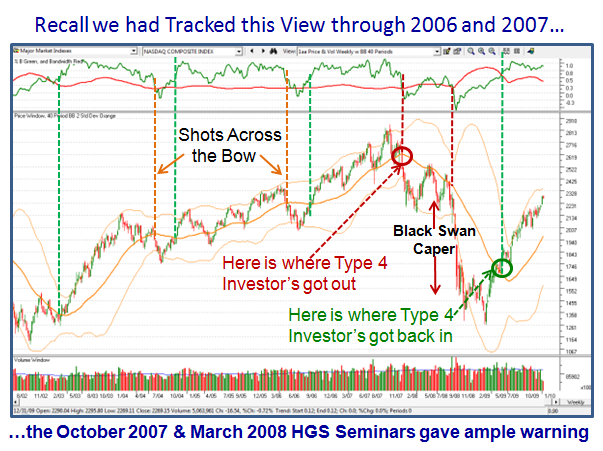
Let’s first put the Mark Pharr chart in context…in a similar vein to when Mark asked back in 2007 for a simple game plan to help him get out of the market at the right time.  I gave him five simple steps of expectations:

1.  A Large drop in %B of the BB’s of > -0.24, at least a small Kahuna down.  It happened.
2.  A drop below a reading of 0.60 in %B…it happened.
3.  A hold at a %B of 0.3 or it dies.  It died.
4.  The %B breaks down through the Bandwidth.  It did.
5.  An ultimate drop of >10%.  We wish it was only 10%, but that was the first drop back in 2007-08.

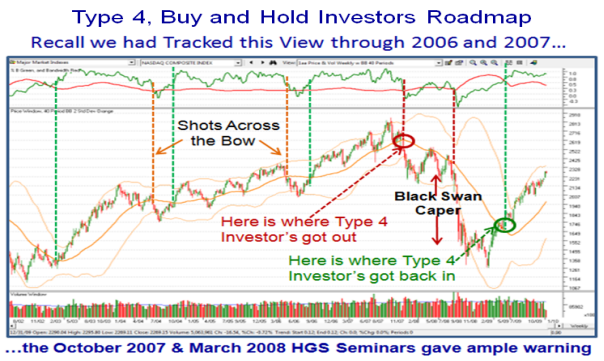
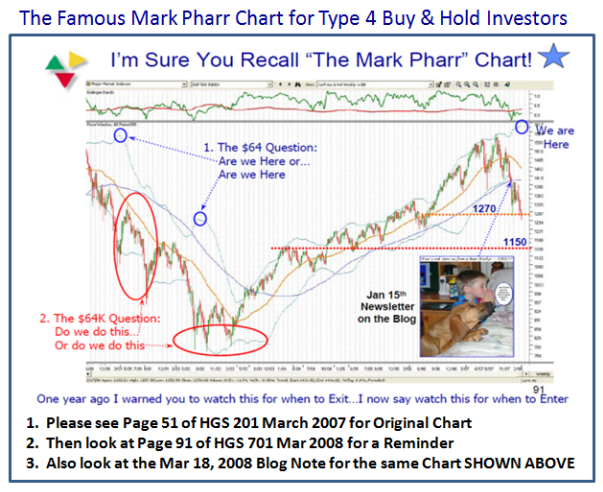
I am pleased to say that he took my suggestions and got out long before there was major damage.  Below I show one of the charts I used together with other references, which those of you who attended any seminars since March of 2007 can find on your Seminar CD, or on the March 18, 2008 Blog Note:

mark

As a summary of how Type 4 Investors have stayed on the right side of the market since then, here is what transpired after the Black Swan Caper, a disaster we would not wish to live through again:

swan

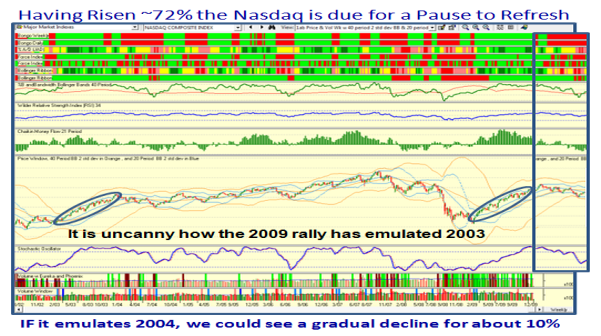
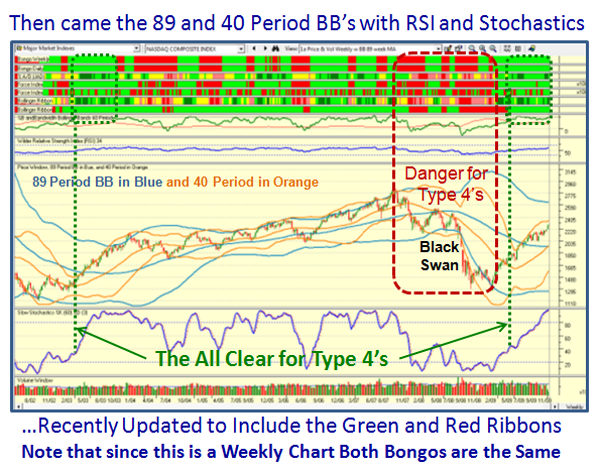
The HGSI Software has given us substantially more visibility since then and here is an updated view of a chart that used both a very long term 89 Periods along with the 40 Period as shown below.  Note I have added the famous Ribbons of Green and Red, which you will be able to use with fast response once the next release is out…which will be very soon.  For now, it doesn’t take a minute to visually see the “Days of Wine and Roses” in 2003 to early 2004 which is highlighted in the green dotted frame, just as we have right now, with the points of entry back then and more recently in July of 2009.

89

1.  ALWAYS, I repeat ALWAYS, trust %B going up or coming down through the Bandwidth as your PRIME Target for when to enter or exit.  Note that on a 40 Period Weekly chart the %B is currently at 0.8937 and the Bandwidth is at 0.3923, so at this time you have plenty of cushion before the %B comes down through the Bandwidth.

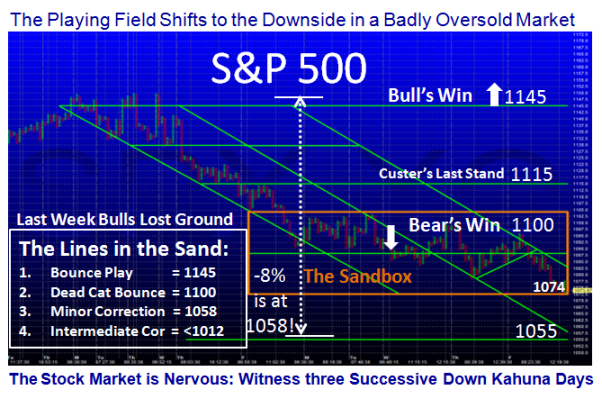
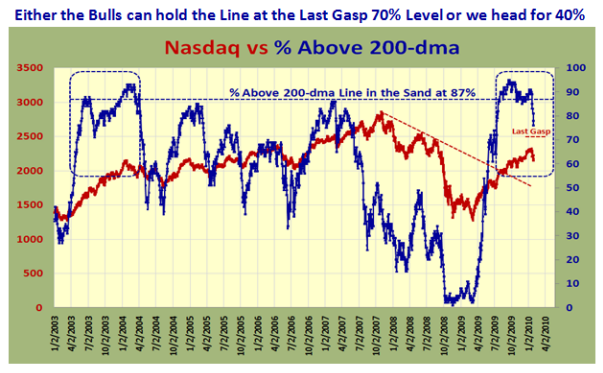
2. The second Golden Rule is that 77% of the time over 50 Years, the S&P 500 has corrected <8%; it is 70% for the Nasdaq.  So as a Type 4 Investor if you are prepared to take a chance that you have roughly 3 chances out of 4 that you will not lose more than 8%, then that is the second trigger.  More than that and you kiss it goodbye.  Otherwise you know the rest of the sad story having been through 2000-03 and 2007-2009, along with the rest of us.  It hurts when you lose an Intermediate Correction of 12% to 16%, and worse yet, a Bear Market Correction of >20%.  Your own Portfolio will be substantially worse than these numbers!

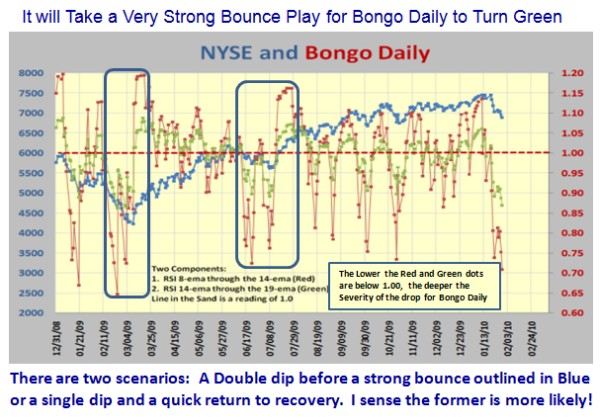
3. The advance warning for both of the above to occur is that BONGO WEEKLY will turn Red…thanks to the team of five HGSI Users who did stalwart work on the Bongo Indicators.  Bongo Weekly is slow to turn, so remember it is a godsend for Type 4 Investors, who are reluctant to be jack-in-the-box Investors and are prepared to give up some of their Profits until their stomachs can’t stand it any more!  However, given that the two patterns are similar at this stage of events, it would pay for Type 1, 2 and 3’s to also watch for a heads up on the Weekly Bongo turning Red, as that is a significant event that should not be taken lightly.

4.  By then, all the Ribbons on the “wc chart” will be blood red, and you will be sporting a score of -5 or worse, especially if we have a sharp jolt with a Phoenix and Red Kahuna down (> -0.40).

5.  The Slow Stochastics shown on that View will break 80 and then 60 in a hurry. It is currently at 99.55…highest yet in six years.  However, note how it stays up for very long periods and it takes a lot of deterioration on all the other items before it snaps.

6.  Wilder RSI will break 50 to the downside. It is currently at 58.32 with the Nasdaq Weekly view.

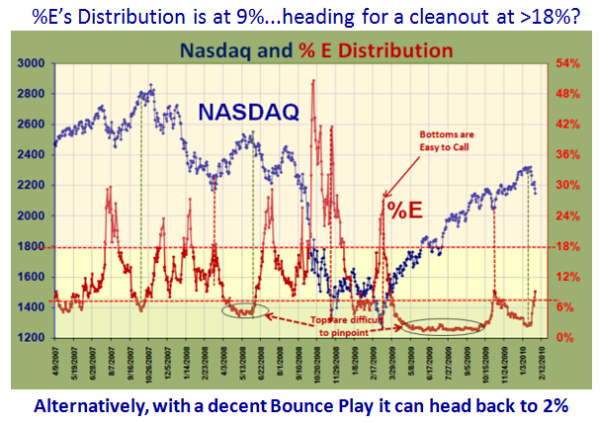
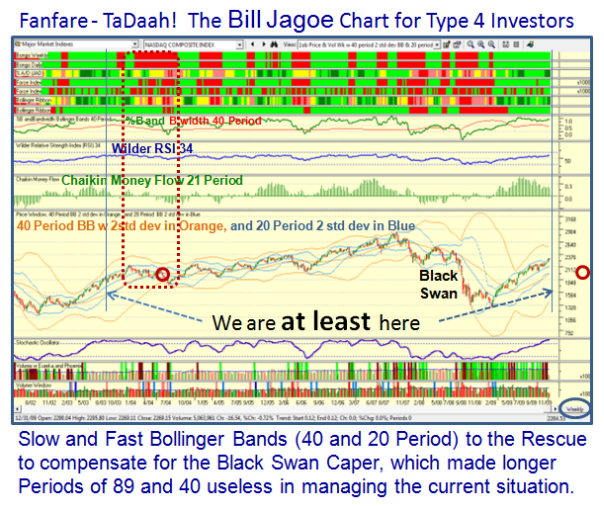
7.  I promised you a Bill Jagoe Chart which will elevate you to the peerage along with Mark Pharr in the annals of using Bollinger Bands.  After much soul searching, the problem we have with the current long term BB’s of 40 and 89 Periods is the “Black Swan Caper”, rendering it too loose to give sufficient warning EARLY enough, should things go south in a hurry.  So, I offer you the 40 and 20 Period BB’s which bring both the Middle Band of the 40 Period and the Lower Band of the 20 Period together and that coupled with the Nasdaq crossing down through them would suggest the party is over…at least for a 10% correction if not more.  These are currently at 1966 and 1981 with the Nasdaq Index at 2269 on a Weekly Chart, while the Middle Band for the 20 Period is at 2132.

By now you know my process well enough that I’m NOT Saying this WILL Happen, but it MUST Happen to Exit.  The Red dot is when the Nasdaq crosses over both the 40 Period Middle Band and the 20 Period Lower Band by using the old trick I have taught you to overlay past history from 2004 on the current chart as shown in the next two slides!

fanfare

extended

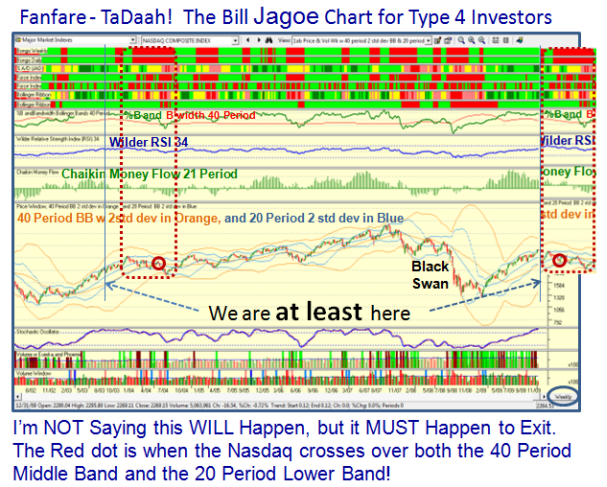
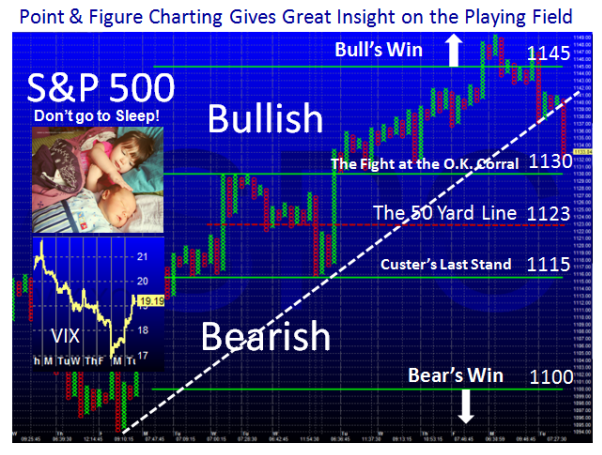
a.  Given the natural tendency for Bulls and Bears to always hold or break at even numbers, the battle will be first fought at 2200 which is only 3% below the current Close.

b.  If that is broken, expect the next battle at 2132, which is 6% down.

c.  The last resort will be around 2000, or essentially 12% down.

Obviously in the scheme of things, the first two targets are tolerable to a a Long Term Type 4 Investor, and I am sure they will start to scratch their heads at 2100, which is 7.5% down.  The rest depends on individual stomachs for Risk/Reward tolerance and proper Money Management.

Lastly, I have focused on the downside scenarios.  However, as we well know, the other two scenarios are sideways or up, and we shall have to wait and see what the New Year and the Earnings Reports bring.   Once again here is my New Year’s wish for all of you:

puppy

Best Regards, Ian.

Copyright © 2007-2010 Ian Woodward
Disclaimer: Commentaries on this Blog are not to be construed as recommendations to buy or sell the market and/or specific securites. The consumer of the information is responsible for their own investment decisions.