The Rally is Still Alive After a Shot Across the Bow
New Readers to my blog will need to go back and see the thread since September 5th to understand where we now stand since I suggested a Three Road Scenario for the Stock Market to take leading up to the Mid-Term Election. As a brief reminder we had three main dark clouds over the market’s head at that time:
1. The big fru-frau of the Hindenburg Omen raising its ugly head that had the Internet abuzz since August 12th.
2. The second year of a Presidential Cycle is the most susceptible to Bear Market Corrections.
3. We had 60 days or so to go to the Mid-Term Elections, which always cause concern in the Stock Market.
With that in mind I suggested that based on recent rallies which varied from a Fakey or Bull Trap of just 10 trading days for the Low Road Scenario, to 20 days for a Middle Road Scenario, and finally as much as 40 or more trading days for the High Road Scenario would get us ultimately past all three concerns.
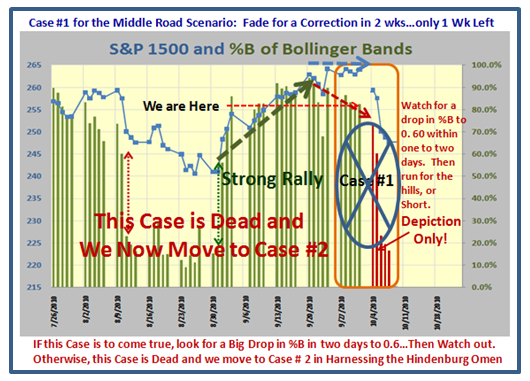
Two weeks ago we killed the Low Road Scenario as discussed in my blog note of September 21, and today Case 1 of the Middle Road Scenario is now officially dead and behind us as shown in the following slide:
Mind you the Bears made a valiant attempt at killing the Rally just this past week on October 4th, when they provided a shot across the bow with several well known leaders getting slammed for big losses, noticeably in the Technology Arena where I pointed to the droop in the Nasdaq 100 (NDX). Fortunately the internals of the market were still strong and in fact are getting stronger, so the Bulls came rattling back the very next day with a strong Eureka and drove all Market Indexes back above the 0.83 to 0.97 arena for %B to finish the week on a strong note.
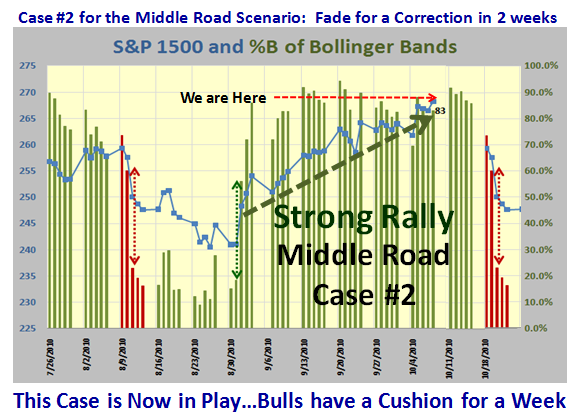
Along the way, I pointed out that Uncle Ben was dropping his leaflets again by firing up POMO, and it is painfully obvious that the Fed and the Administration will do everything in their power not to let this market slide into another deep correction until the Mid-Term Election is over. So now we embark on Case #2 of the Middle Road Scenario which should take us into the weekend of the HGS Seminar from October 23 to 25:
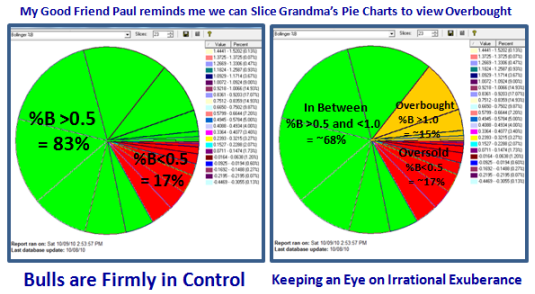
Understand that the purpose of showing this depiction is to suggest that if there is to be a correction it should happen in the next two weeks. If it doesn’t happen then we move into the Long Road Scenario which will take us into the Election and if that scenario holds up, then at least the concerns of all those dark clouds for an impending huge double dip before the Election will be blown away. It so happens that the % of S&P 1500 stocks above the Middle Band of 0.5 is 83%, and my good friend Paul reminds me that it would pay to watch the overbought bucket of stocks with %B greater than 1.0 to make sure we do not get too overheated…so here is that picture:
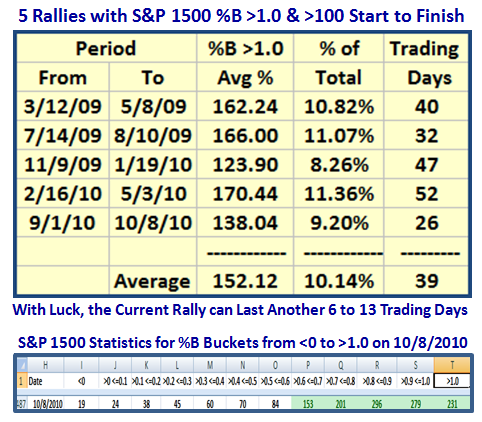
I am sure by now that you have understood that a 1-Day reading of >300 for %B >1.0 shows strength and you need to see many of them during the course of a rally. However, there have been three occasions in the last 20 months where %B >1.0 recorded over 500 stocks. The measuring rod is that once that occurs, the days for the rally are numbered. Expect the market to die within 12 to 15 days of such an event. Building on Paul’s idea, I have developed a chart of the number of Trading Days that each of the 5 Rallies have recorded since %B first hit 100 stocks in the >1.0 Bucket until the last time it hits 100 stocks in the same bucket. It usually takes another 2 to 5 days to die after the trading days recorded as shown in the table, i.e., more stocks <0.5. My point for all of this is that I repeat again this business of fast dropping %B and Bucket Skipping gives one a very quick early warning of impending major turns in the Market. Here is that picture:
Contrary to what most believe this has been a powerful rally so far based on using the criteria I mentioned above. During the period from September 1st to now, we see that the # of stocks in the S&P 1500 which have sat above a %B of >1.0 is 9.20% for that period of time, and it has done it in 26 trading days. The chart also suggests that there is upside potential for the %B >1.0 to still grow 1.5% to 2.0% if the rally is to continue. That implies we should see more occasions of hits above 300 stocks in this bucket and hopefully culminating in 500 or more. Then we will for sure know that this market is truly overbought and it will be high time to think of serious corrections to come. By the way, QE 2 (Quantitative Easing) or POMO (Permanent Open Market Operations) is again in full swing. Heaven help us when that stops and rates go up, but that is a story for another day. In the meantime, enjoy looking for the pony or ponies in this market!
Ron and I look forward to seeing you all in a couple of week’s time. Those who haven’t signed up yet had better shake a leg.
Best Regards, Ian.
 Ian Woodward's Investing Blog


