Stock Market is Stuck in the Mud
This Stock Market is stuck in the mud in second gear waiting for the events of this coming week:
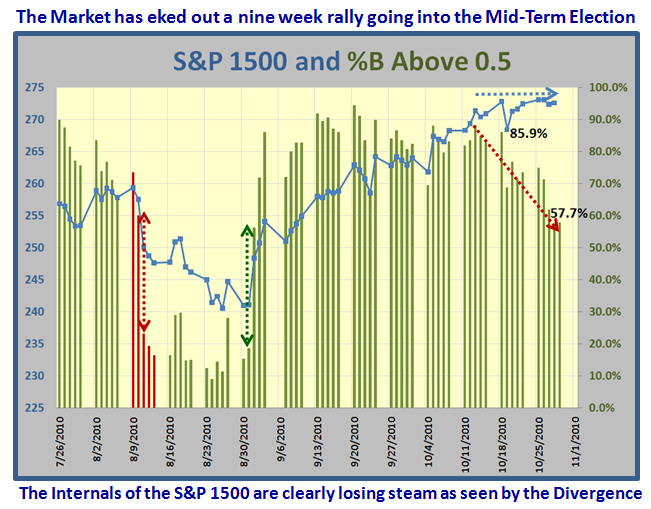
We have eked out nine weeks of a Rally, but the internals of the market as expressed by the %B above and below the Middle Bollinger Band of 0.5 for the S&P 1500 show a major divergence at this stage. It’s pretty obvious that the Large Caps have led the charge and that coupled with Technology including the Semiconductor Index SOX have kept this rally boyant until now.
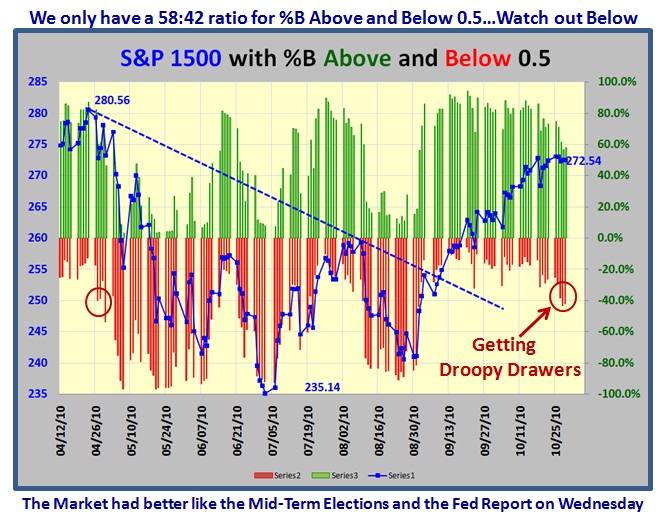
The S&P 1500 is struggling to reach a Double Top, but getting droopy drawers in the process:
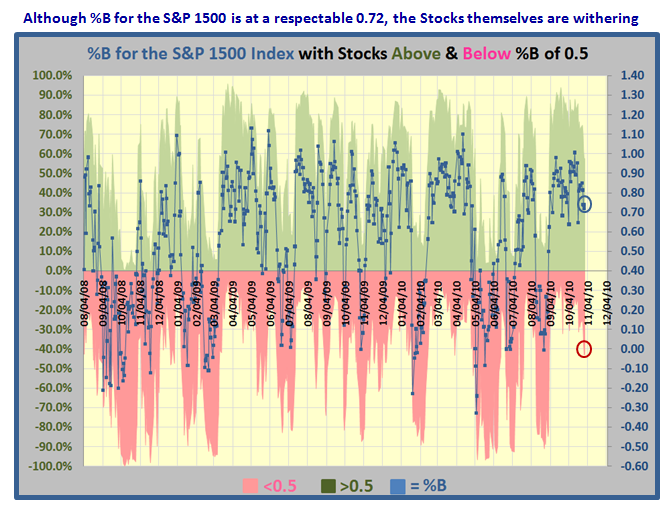
Note how the %B for the S&P 1500 Index is still at a respectable reading of 0.72, the ratio of stocks above and below the middle BB of 0.5 is decaying:
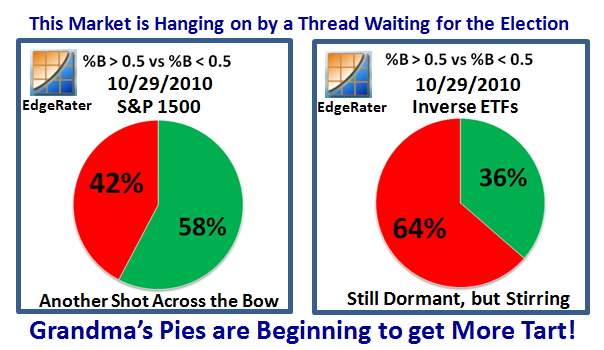
Grandma’s Pies are beginning to show a lot more red for the S&P 1500, and the Inverse ETF’s Index which I listed in my last blog note is still dormant but beginning to stir…i.e., “Green” increasing
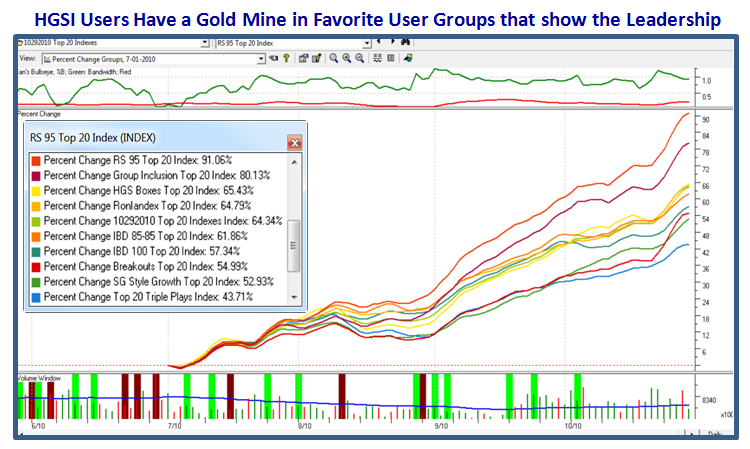
We had a great Seminar last weekend and one of the fruits of our labors was to evaluate different User Groups that showed us the Leading Stocks in the Market. Here is that quick snapshot using the Percent Change Chart with the Start Date set at the New Base Low of 7/1/2010. As you would expect, Relative Strength invariably leads the way:
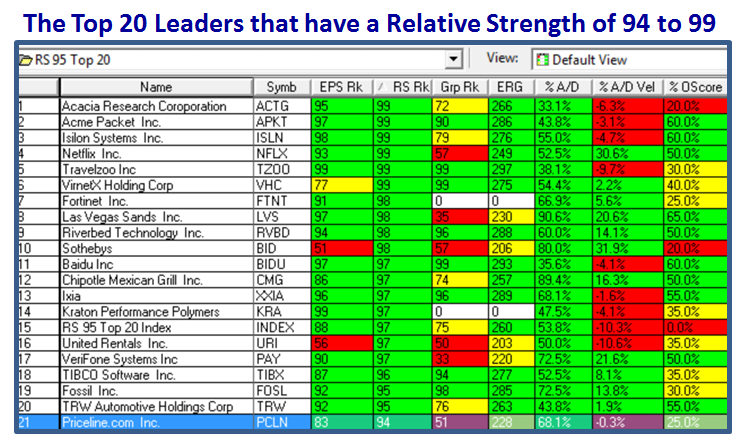
Here is a quick snapshot of the Top 20 stocks in that leading RS 95 Group:
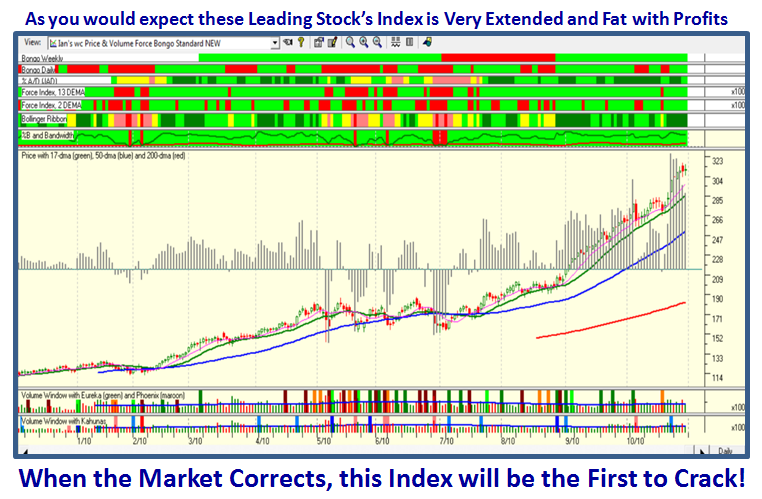
…And here is the overall Index for that Group; Extended and Fat with Profits. It should crack first when the market breaks:
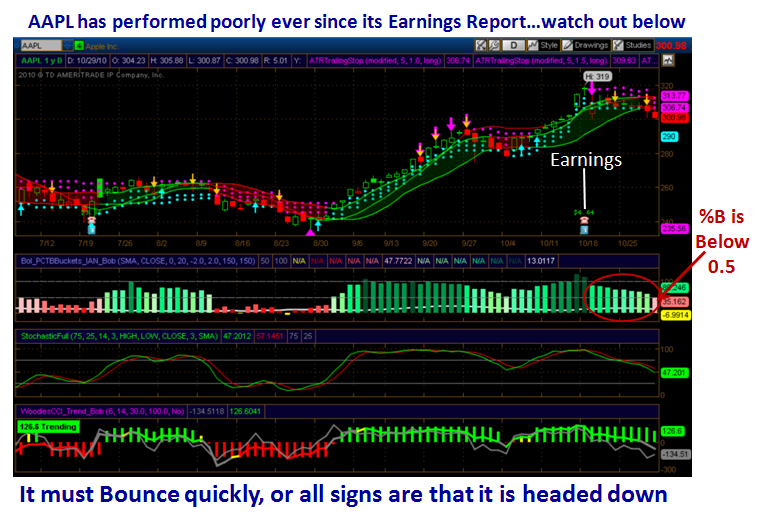
AAPL has been the Leading Stock in the market for quite some time, but since its recent Earnings Report came out it has been basing sideways with a 6% drop from Top to Bottom. %B has been gradually deteriorating as shown on the chart to the point where it is now below 0.5, not a good sign. It needs to Bounce quickly from this point or it will show us the way down:
And that’s My Story for Today! It should be an interesting week to come. Thanks to you all for your support.
Best Regards, Ian
 Ian Woodward's Investing Blog