Stock Market: Primose Path to Fugacious Blossoms
My good friend David Galardi prompted me with a theme for this weekend when the market is teetering on fumes, and there are cross-currents appearing that suggest the Large Players may be leading us “Down the Primrose path to Fugacious Blossoms!” I had to look up the meaning of “fugacious” which turns out to be fleeting, so I offer you this reminder:
So David is right as after a strong recovery on the first trading day of the New Year, similar to last year I might remind you, we are now on the brink of once again sitting at the hairy edge of Stalemate where we wait and see if we bounce out of this hole or give up the ghost and head down for a correction. Next week should settle the fight between Bulls and Bears:
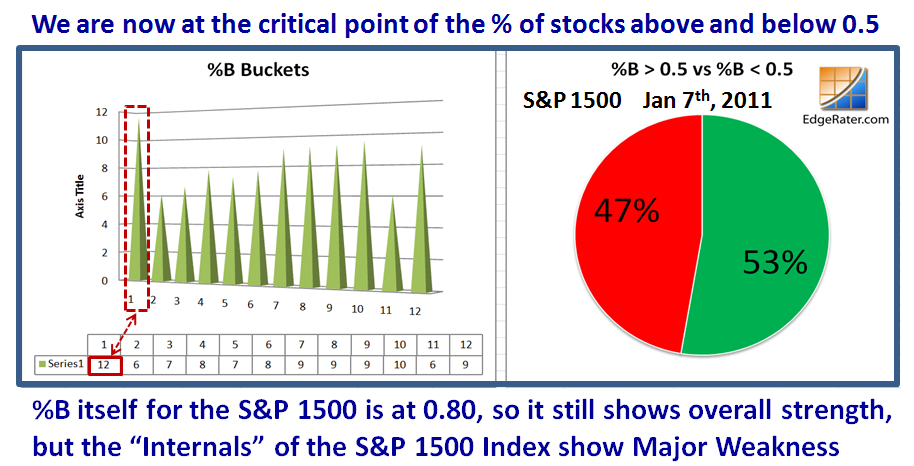
The question you might ask is “What new evidence do we have that things are looking a trifle bleak?” Another good friend of mine, Mike Scott, recently talked to spying “Bifurcation” where on the one hand %B for the S&P 1500 is still a healthy 0.80, while the internals of the stocks themselves within the S&P 1500 are essentially at 50:50. More importantly, the bifurcation shows that although the upper end of those stocks above %B >1.0 is still holding up reasonably well with 9% in that bucket, we now see that the highest % in any bucket is in the one <0 with nearly 12%…i.e., being well and truly trashed:
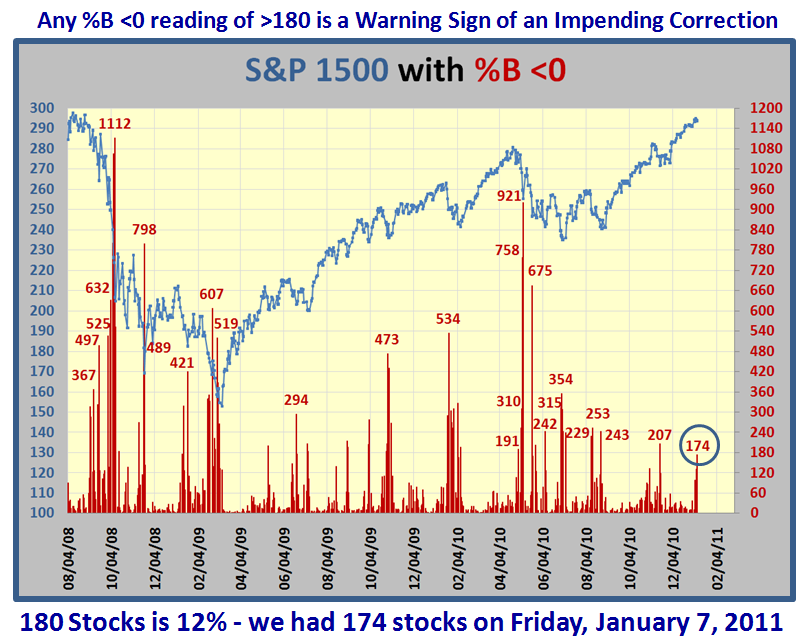
I am sure you have forgotten that one of the Golden Rules I established moons ago is that any %B <0 reading of >180 stocks is an early warning sign of an impending correction. We had 174 stocks on Friday, January 7, 2011, so we are knocking on the door, and that is close enough for me to give you that picture to prove my point. It does not mean “die”, but it invariably means correct.
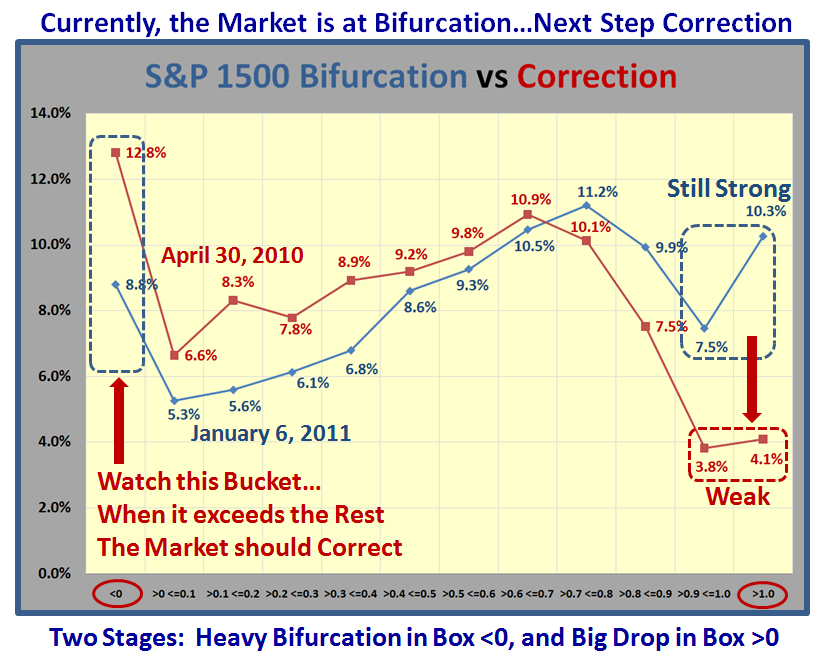
But now I offer two further charts as evidence that Bifurcation is well on its way, and that is invariably the first stage of two to bifurcation and a correction. I trotted back in time to when the Market Top occured back in April 2010, and here is a comparison of Bifurcation underway on Thursday January 7th, but yet not quite ripe enough as compared to both Bifurcation and Correction on April 30th. Note how Bucket >1 is still holding up, while on April 30th, 2010 the last two buckets are very weak as shown in the chart below:
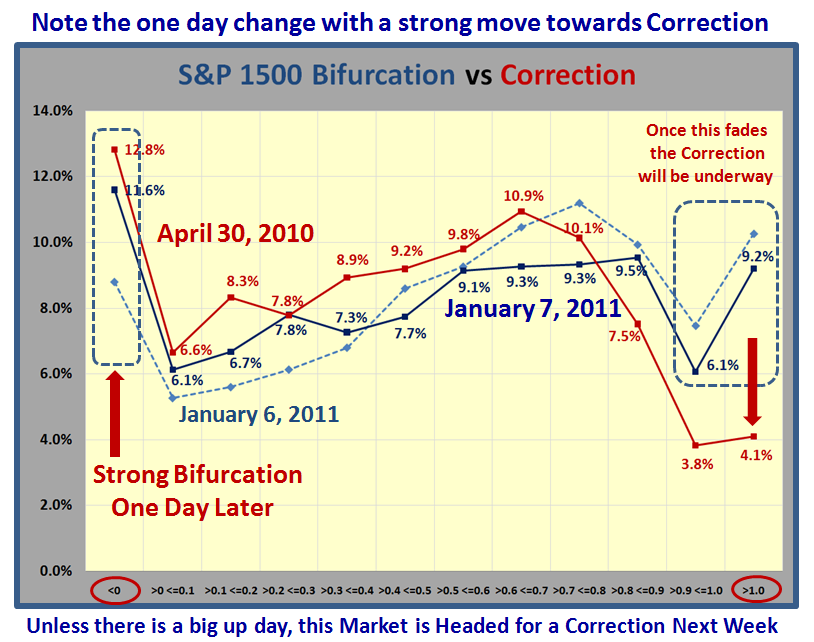
The above was the picture on Thursday, January 7th…now look at how the picture changed for the worse on the very next day, Friday, January 8th. With the bucket <0 showing the highest percentage of 11.6%, it mimics what we saw on April 30, 2010, so bifurcation is “complete”. Now we wait to see if the last hold out for the bulls of 9.2% in Bucket >1 gives way to weakening down to below 5%. I suggest that will be the final blow. At least we now know what to look for in the critical aspect of the tide turning from Overbought through Stalemate to Oversold.
There are always surprises in the Stock Market, so don’t count your chickens before they are hatched, but for sure things are ripening towards a correction as early as next week. We do not have long to wait. We are now in our 20th week of this Rally.
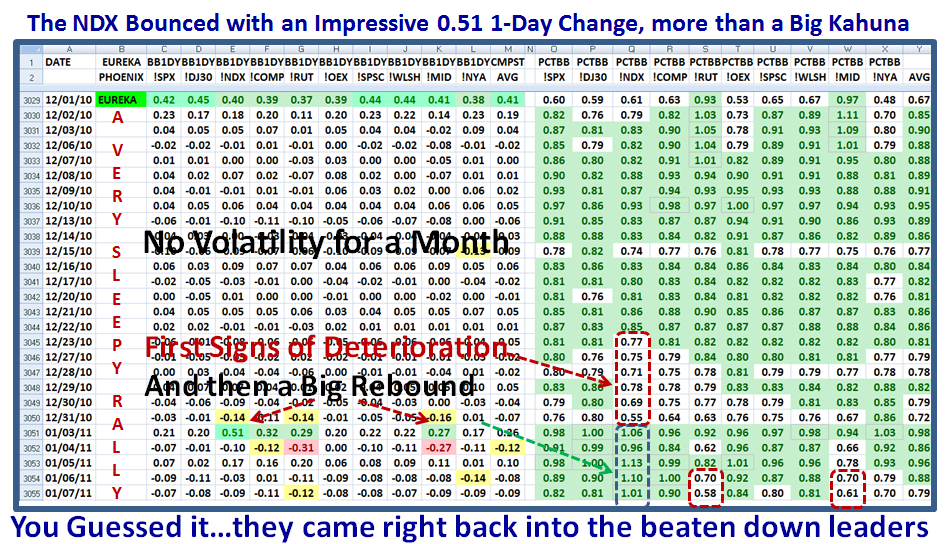
At the top of this note I warned of several cross-currents, and one way to confirm this view is how rapidly the shift in the market occurs when the leaders in the NDX (Nasdaq 100) were being trashed behind the woodshed two weeks ago to come roaring back these past five days as shown below. Likewise the Small Caps Index of the Russell 2000 (!RUT) is currently the weakest with a %B of 0.58 along with the Mid-cap at 0.61.
This may well be due to the natural changes Portfolio Managers make at the end of the old year and the start of the new, but then the January Effect hardly lasts more than a couple of weeks, so we might have a surprise reprieve though not for long, especially if the Bucketology continues to show sloshing to the left!
Best Regards, Ian.
 Ian Woodward's Investing Blog

