Ian Woodward's Investing Blog

Archive for February, 2012

Stock Market: Leap Year Voodoo

Wednesday, February 29th, 2012

The saying goes, Beware the Ides of March which is all of 15 Days away.  It looks as if the shot across the bow today suggests that the Leap Year may have beaten it to the caution:

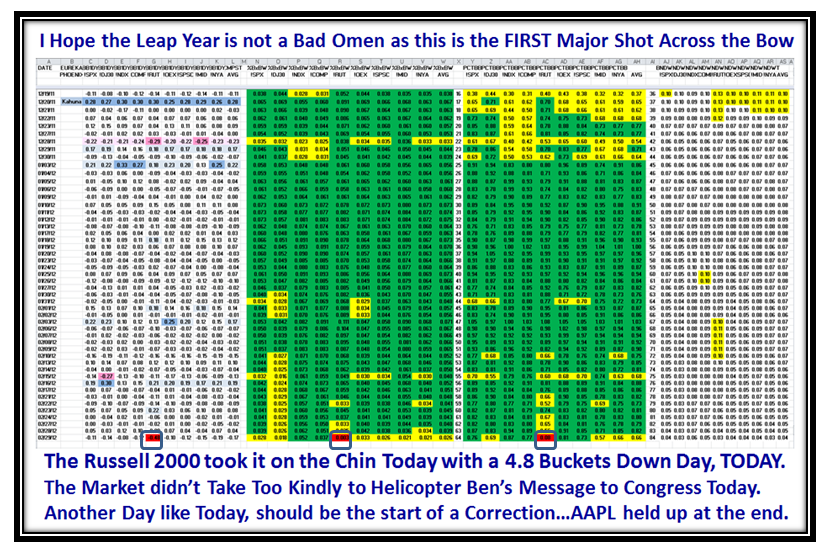
Anyone watching today’s action in the Stock Market couldn’t help but see that the Small Cap Russell 2000 Market Index had a bad day with regard to our terminology…Close to a -5 Bucket Down Day!  The other Indexes have turned “Yellow” and could follow with another bad day in succession:

You don’t need to know the numbers…those three red blobs which I have ringed says it all.  The RUT had 4.8 Buckets DOWN today, and as you can see from the sea of green we have had since late December, we have had a first MAJOR shot across the bow. Read carefully my last Blog Note to understand the significance of 5 Buckets down.

AAPL shot up first thing but towards the close was under pressure giving most of the gains back…however, it held fast and came roaring back in the last half hour after a small shake out.  Uncle Ben was not  encouraging today and the Market was not too pleased with his outlook, hence the fall in the Small Caps which have yin-yanged now for all of 18 days.

I felt I should give you that quick review to be on your toes for tomorrow to see if the other Market Indexes follow suit or that it was just a flash in the pan letting off some steam.  Of course it is no news to you that the Market is long in the tooth so a little bit of a pullback would be healthy.  By the way the TVIX and VIX remained very calm, so that is still a good sign for the Bulls, and until you see the kind of jump I explained in my last Blog, just watch those two to stay alert for which way the wind is blowing.

For those planning on coming to the seminar in three weeks time, you have until March 9th to sign up for the discount rate we have secured for you at the Courtyard Marriott…don’t dilly-dally on the way.  You snooze, you lose.

Best Regards, Ian.


Stock Market: A Second Wind, but Watch for the Evil Eye!

Saturday, February 25th, 2012

As I write this Blog Note, I am reminded that we have just one month to the day for the Gathering of the Clans at our March 24 to 26 Seminar.  Hurry, hurry, hurry if you want to learn how to Manage Fear and Greed and to stay on the right side of the Market using the Balanced Approach which Ron Brown and I have developed.  Our objective is to show you winning ways in enhancing your Portfolio Gains, so let me once again ahead of time lay out the value of what we offer you at an intense but very friendly seminar which might help you grow and preserve your hard earned Nest Egg.

I note that my good friend Kevin from Qatar is wondering what is happening back here in the pulse of the market, so let me lay out the High Road and Low Road Scenarios and Targets so that he might be induced to come and visit us again!  Ron and I are having withdrawal symptoms from all the folks whom we have not seen in a while but are still loyal followers.  As usual, my opening picture gives you the gist of what to expect in the Blog Note below:

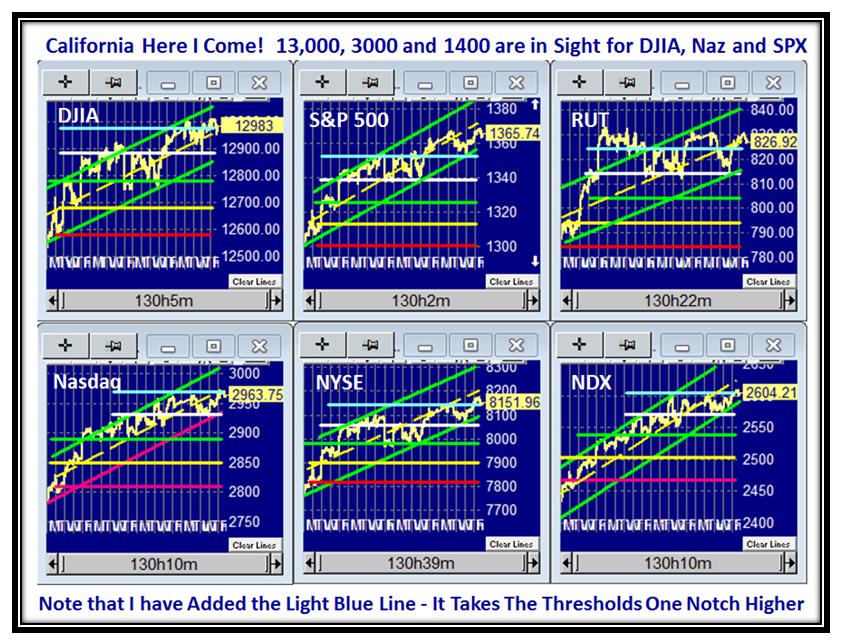
Those who are regulars to these notes now know what to look for in the following chart, but you will immediately notice we are now into “Nose Bleed” Territory with the light Blue lines I have added to the Major Market Indexes Chart.  However, the higher the Market goes the harder it falls, but the Bigger the Cushion before you get creamed.  The White Lines are your “Get Out of Jail Free” card:

It is painfully obvious that the Institutions do not want to let this Market die until we are well past the 13,000 mark on the DJIA.  It gets the juices flowing for the “herd” (usuns) that may be sitting on the sidelines and something for the talking heads at CNBC to pump things up for those who wish they “coulda, shoulda and woulda” been in at the start of the year.  Meanwhile the big boys are also reluctant to step up the bidding as witnessed by the turn down in the Money Flow, yet not enough to cause a stampede for the exits as yet.  I’ll show you that picture later.  The beat goes on albiet slowly to the High Jump Targets I laid out in the Newsletter:

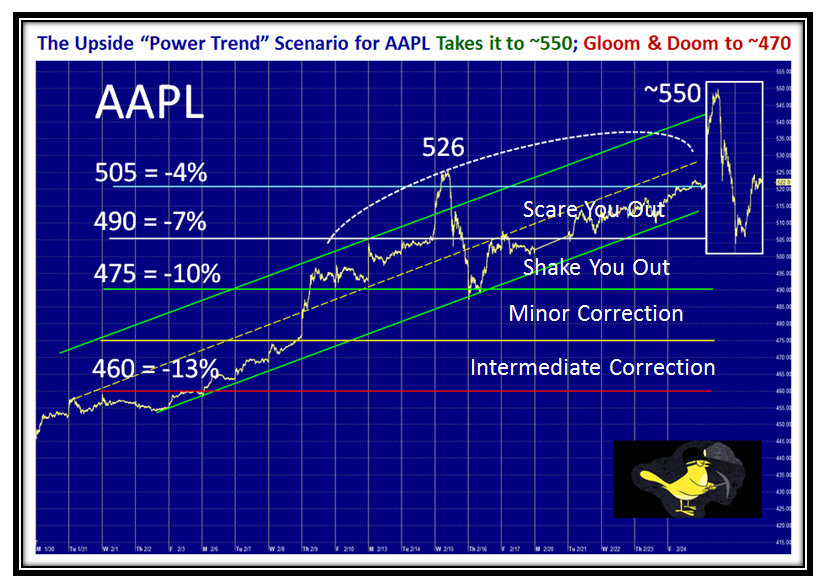
The Canary in the Coalmine, AAPL, survived a whiff of Carbon Monoxide and is now sitting close to its old high.  It’s not difficult to estimate the two near term extremes on the high and low jump based on what transpired a week ago as it trotted into a climax run.  Don’t be surprised if the big guys suck you in for another Upside Power Trend move and then kill you to the downside:

Having given you enough for Targets on the Upside, let’s now turn our attention to the Volatility Scenarios that help us determine ahead of time when the Party is truly over long before you and I get whalloped.  The chitter-chatter on the HGS Investor Yahoo BB leaves me smiling as we look to “What If” Scenarios for some dramatic action to the Upside in the VIX and TVIX.

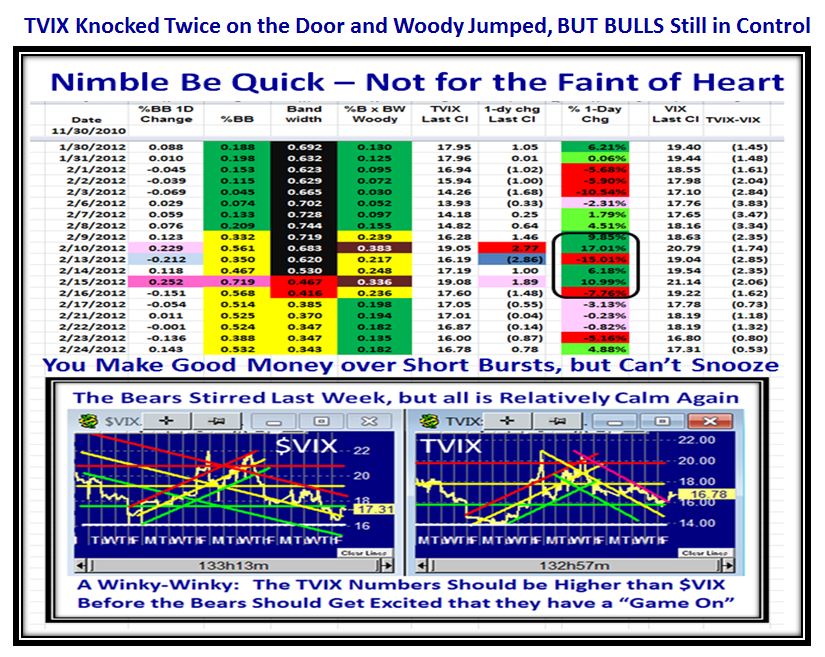
The Market has played right into our hands to develop the Up and Down Scenarios, especially as we now know for sure that 5 Buckets Up or Down in one day is a “Take it to the Bank” heads up to either enjoy the Power Trend or Run for the Hills with the Woody Indicator showing you the way.  With the TVIX this quiet despite the two shots across the bow last week, the real challenge for it is to get above the VIX in price before there can be a real surge in the making.  Otherwise it can again fizzle into a “Fakey”, as it did a week ago.  Yet, let me not deter those who are lamplighters with cast iron stomachs as there is good money to be made in the very short term when it stirs for a day or two as I show in these next two charts:

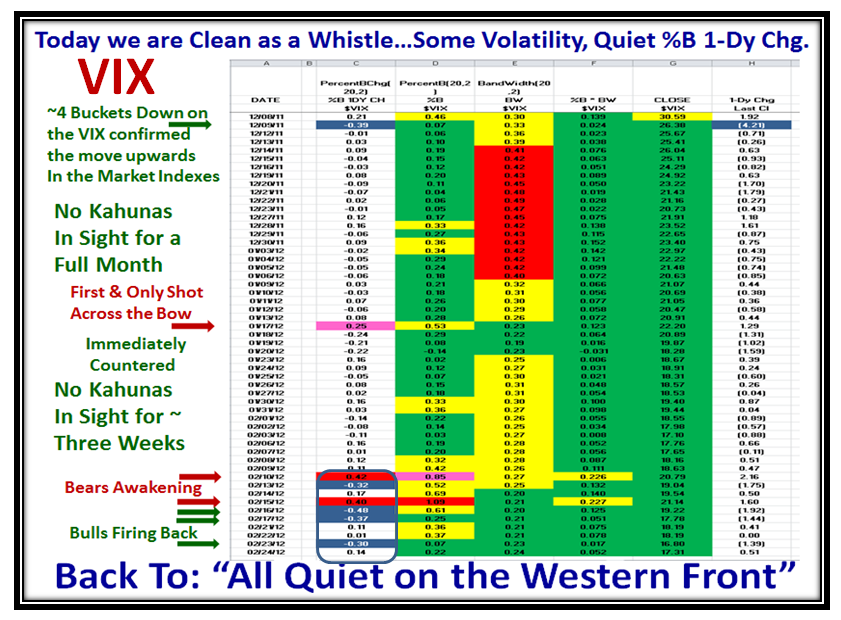
Here is the picture for the VIX and as you can see by the red and green arrows and comments on the bottom left hand side of the chart we had a couple of shots across the bow and despite the volume being light this week, the Bulls still have control:

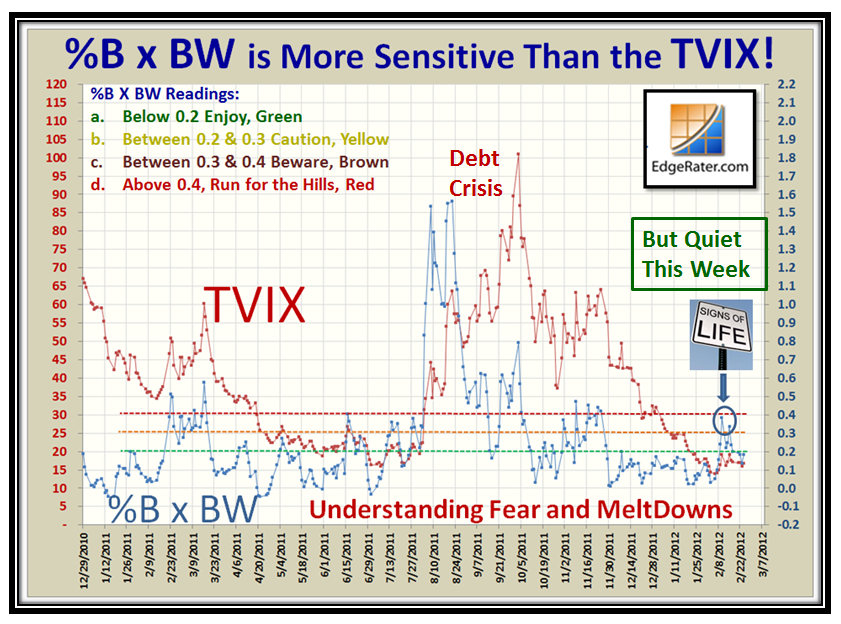
This next chart shows you the full value of the Woody Indicator which leads the TVIX, and is our Savior from a Catastrophic Failure in the Market when it goes into shock ala Black Swan 2008, Flash Crash in 2010 and Debt Crisis in 2011 as shown below.  Let me add that those who come to the Seminar will have this chart in the HGSI Software so that you can follow this goodie in it:

This next chart is worth its weight in gold as there is much chatter on the HGSI Yahoo BB about “What If” Targets for next week so that you can be ahead of which way the wind is blowing.  By now, I have drummed into you that five buckets up or down can either be Mana from Heaven or the Kiss of Death, so here are the targets to watch for should there be a sudden knee jerk one way or the other.  I am not suggesting for one moment that we WILL see a Plus or Minus 5 Bucket Day, but in addition to whether we do or don’t, the chart shows you that the two numbers to watch for in the TVIX is either 13.31 for a strong move up in the Market or 20.05 for a Knee Jerk downwards:

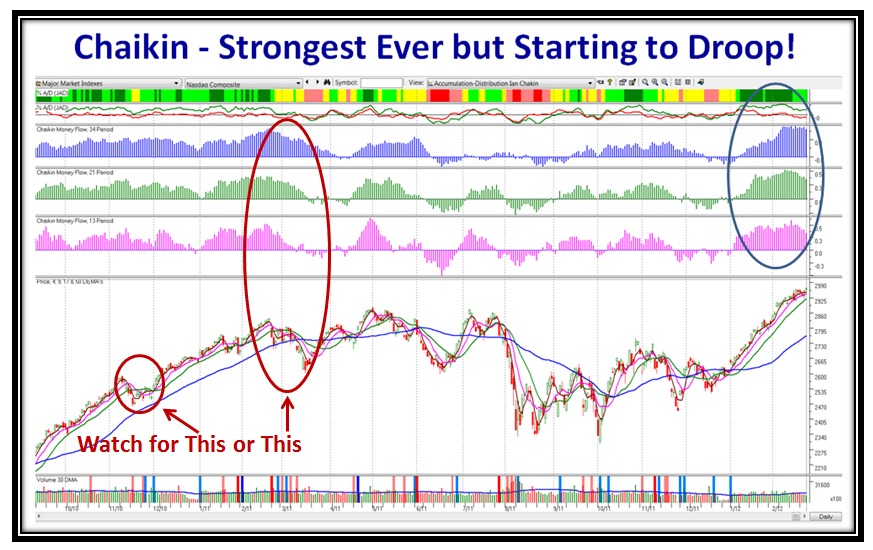
As you well know in times like these, I always hunt with Chaikin’s Money Flow to sense the direction of the Wind Sock.  It is strong but starting to droop as big boys are gradually pulling money out while still buoying the Market up with talk of Golden Crosses and driving the Market above their old highs.

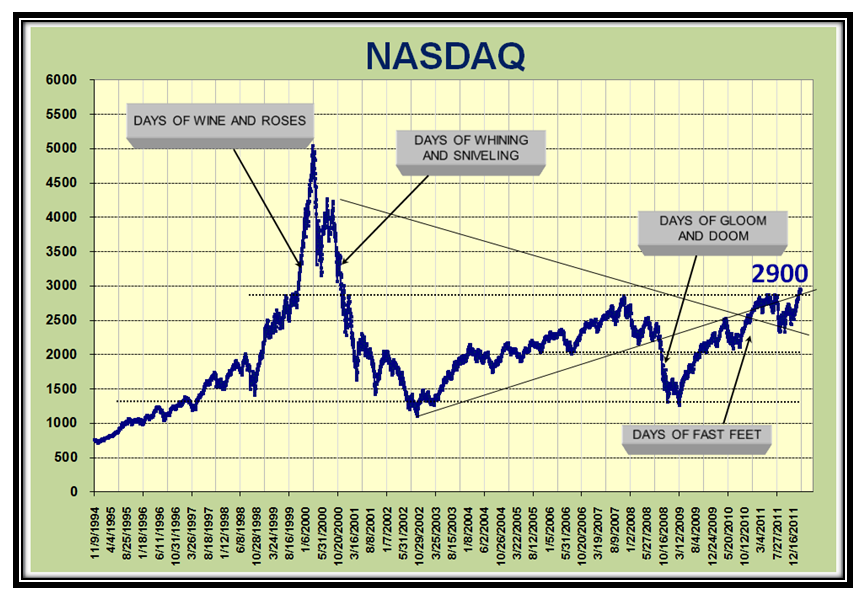
On the positive side, let us not forget that 2900 on the Nasdaq has been the buggaboo level since the Days of Wine and Roses and we are once again knocking on the door for a potential strong breakout!  This is a chart my good friend Aloha Mike Scott generated many moons ago and I savor it with fond memories of 20 Years of giving back to the Community:

…And finally as I leave you with this thorough analysis of the pulse of the Market, never fall in love with one scenario.  In this day and age we are too quick to look to gloom and doom as the go to scenario, but there is usually a silver lining especially in the 4th Year of a Presidential Cycle, which seldom sees a Bear Market in 72 Years of History:

If you got to this chart, the sentence in red at the bottom is all you need to remember going forward.

Should you be thinking of coming to the Seminar, it does help you and us if you will sign up quickly as time is running out and the curtain is coming down in two weeks time on the special rates at the Courtyard Marriott, so it is up to you.

Best Regards, Ian.

Stock Market: First Shot Across the Bow?

Friday, February 10th, 2012

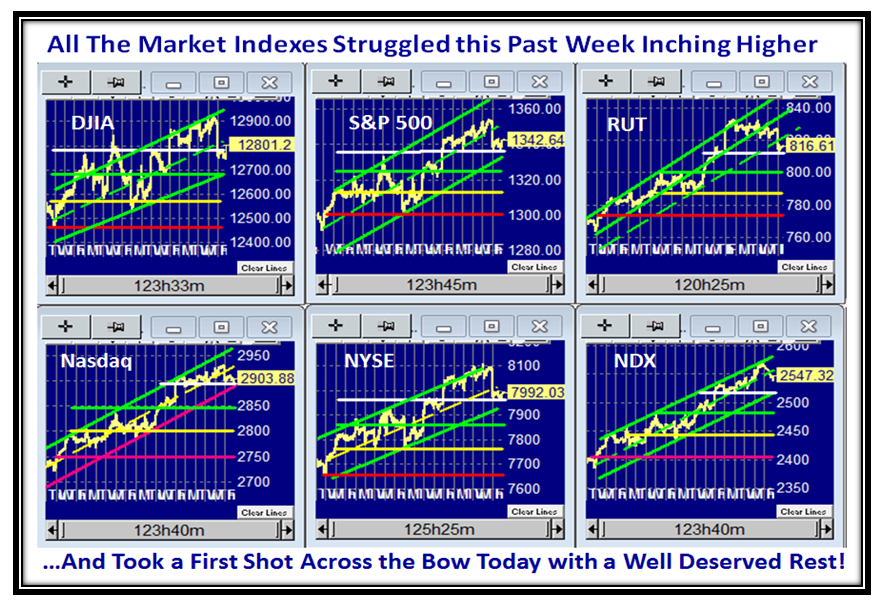
As we well know the Market has been gradually troting up in sync with AAPL, but seems to be running out of steam for a much deserved rest.  It got its first shot across the Bow and we shall see what next week brings.  As AAPL goes so goes the Market.   Meanwhile, those who took the time to listen to my video which I did with Chris White of EdgeRater on Tuesday will see that the good stuff I covered worked well today.  If you haven’t seen it trot over to his website and enjoy.

Here are six Major Market Indexes and it doesn’t take two minutes to see they are all well extended over the past 20 day period.  Many retraced to the “White Line” that suggests support from the last six days or so, which all lost today with about a 0.8% drop…not big enough to cause panic at this stage as the Volume was not unusually heavy:

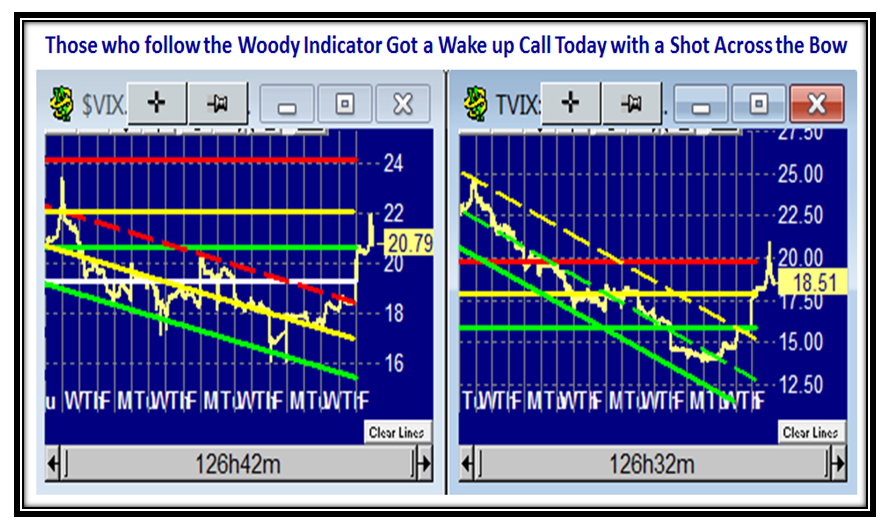
If next week these Indexes hold support at around this level then the inference is that they will attempt to go again, and if not, they better not drop below the Green Lines on heavy volume or this might be something for the Bears to get excited about.  As I covered in the video, the new Woody Indicator worked well the last couple of days against the targets I gave and especially today when viewed in conjunction with the VIX and more so the TVIX, and here is where we stand tonight.  If you have the stomach to play the TVIX and watch the market all day, you can make some impressive gains in a matter of a few days, but you had better be as quick as a Lamplighter!  Don’t blame me if you get caught.   However, Woody signals these moves with even bigger volatility, so enjoy:

As a reminder, here are the three subject videos which I am sure you will enjoy from Chris, Ron and myself.  You will find them on the Link I have provided you below.  They will be with the rest of the Videos on the Course just completed by scrolling down the right hand side.

EdgeRater Site

Best Regards, Ian

Fishing for High Growth in Your Portfolio

Friday, February 3rd, 2012

I have done this Stock Market Blog for nearly five years and hope that those who fish in my pond have felt that over the years I have kept you on the right side of the market, helped you GROW your Portfolio and 401K with my ideas, and have given you the key warning signs to protect your Nest Egg in understanding Fear and Greed.  In essence Ron and I cover High Growth Strategies be they for Growth, Value, and Dividend Investors, with a prime emphasis on which way the wind is blowing in the Market Indexes.

With that preamble in mind, I have also shown you the value of using two Software Products which I use and have recommended by example after example in these blog notes.  This Blog Note shows you that  we are again at a critical juncture in the Market, and how to use the tools to your best advantage right now, especially when the examples in recent blog notes are fresh in your minds:

Talking about “Fishing” I have shown you a tool to fish for up and coming “New America” companies that become the lifeblood for continuing the growth of this country, which have a balance between strong Fundamentals and yet are in the early stages of their growth.  Those who use the HGS Investor software know it well as the Nine Box Matrix, and particularly those that meet the requirements for Strong Earnings Growth and Revenue of over 100% in the last two quarterly reports, known as Box 7 Stocks.  Better yet, these are the very stocks that invariably will enrich your Portfolio.
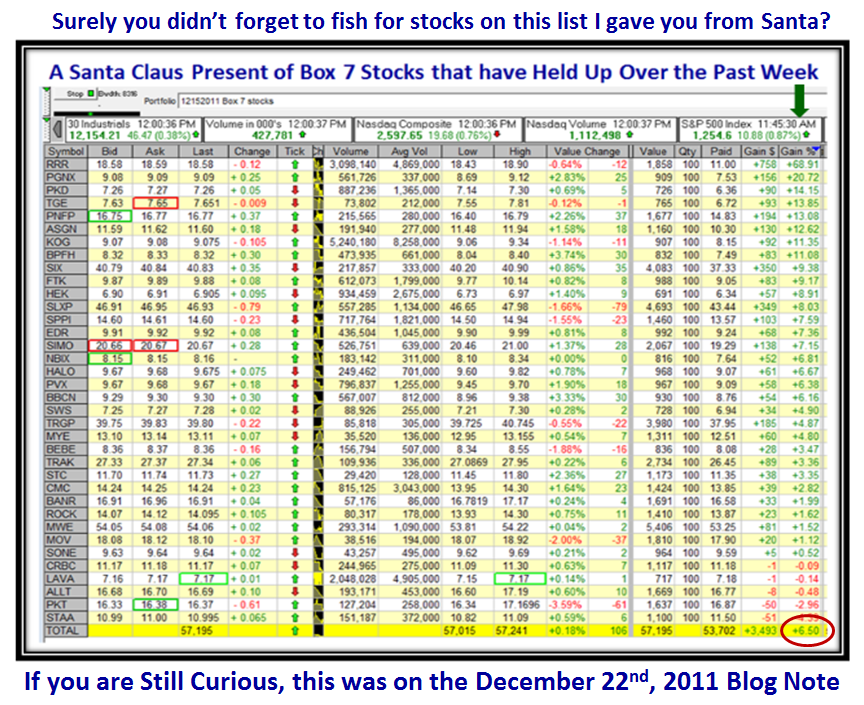
You will recall that the week before Christmas I gave you a long list of Box 7 stocks to keep a Beady Eye on which might help to make your Portfolio Grow and here it is posted from the Dec. 22nd, 2011 Blog note.
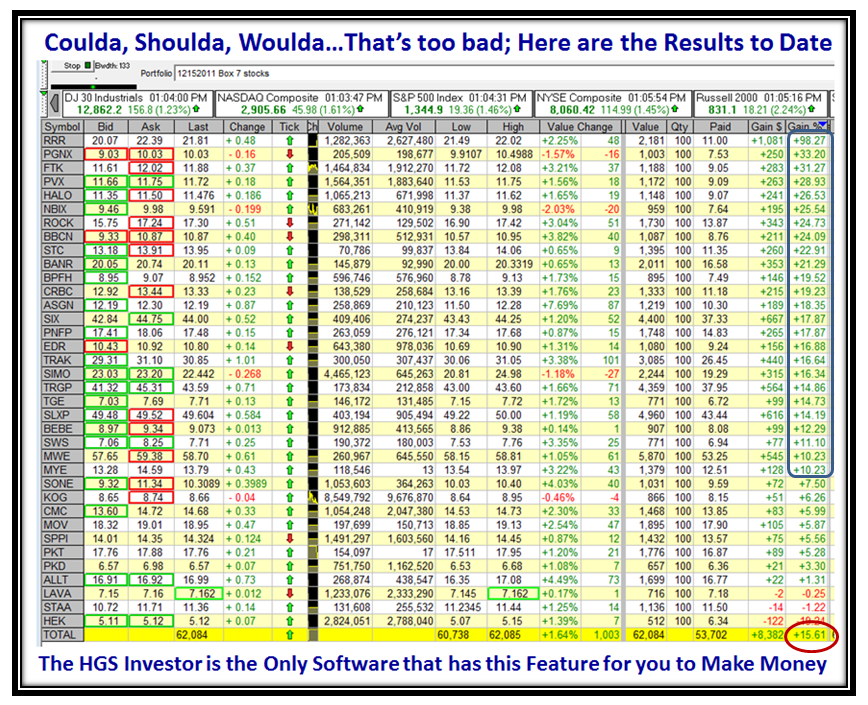
You will note that the list used equal lots of 100 shares each for me to keep it simple.  It would be different for Equal Dollar Weighted.  So let’s see how this bunch has performed since then, recognizing of course that the Market has been kind to us during this period, but none-the-less delivering a respectable 15.61% in a matter of 7 weeks, and up 9+% since I posted the note…if you had the temerity to take them all!  That’s more than many make in a year in their Portfolios.  Now if you were good at Technical Analysis which I assume you are and know when to buy and sell, just look at the 25 stocks that made over 10% to 98%, you might well feel this process has VALUE as a Strategy in providing High Growth to your Portfolio.
Don’t forget to either click on the chart or change the % of the view at the bottom of your Internet Explorer to get a bigger picture.  Now those who have seen me time and again use the High Jump Tool to assess “Greed and Meltups” when the market is getting “Peaky” will recall that just a week ago I gave you the “High” Targets, again a tool found only in HGSI:
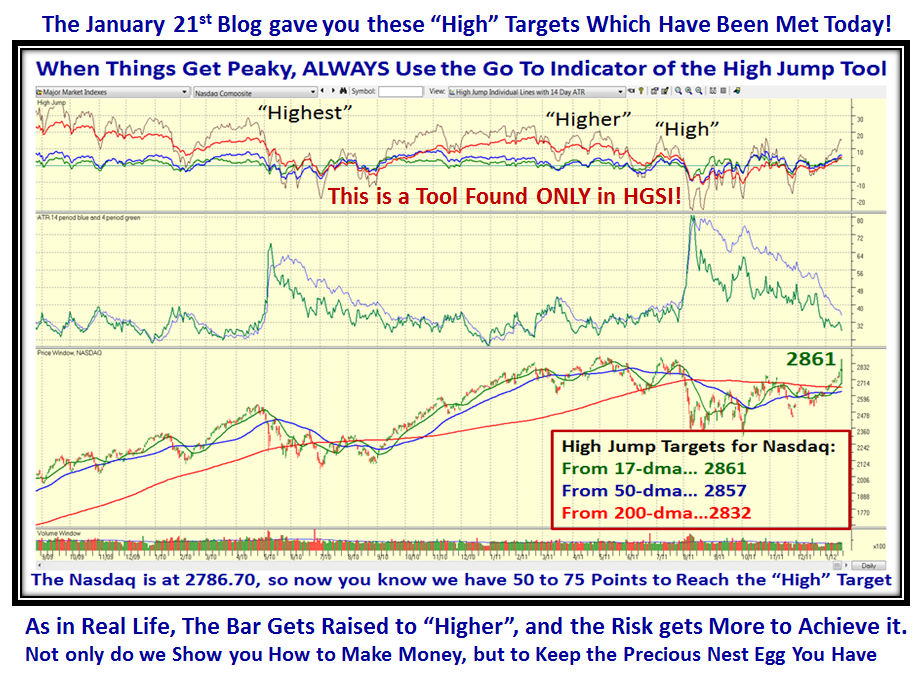
This time I show you how to raise the bar as the Market rises, the Greed turns to Irrational Exuberance, and to assess the next level of Higher and/or Highest based on past expectations.  This work of mine helps you to understand “Greed and MeltUps”:
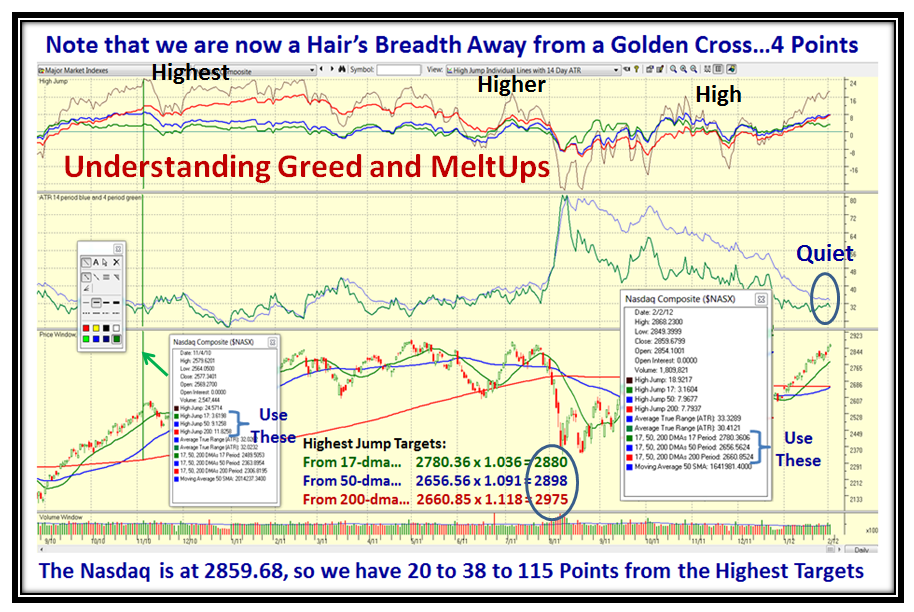
This chart was done yesterday and with today’s explosive move we have not only had the Golden Cross I predicted as the High Road Scenario, but have already surpassed the targets for the first two conditions shown above for the “Highest” Targets from recent history over the past year or so.  Not only do I give you the “How To” do it, but also provide the expected results on a silver platter.

Having shown you only a smidgeon of the Value of using HGS Investor as your Analysis Tool, now let’s turn our attention to the other one I use, EdgeRater, which as you well know works hand-in-glove with HGSI and has provided me with the breakthroughs I feel I have made in using John Bollinger’s Indicators of %B and Bandwidth with a Woodward Twist!

Those who take Ron and my Monthly Newsletter were privileged to see my latest work of blending %B x BW into what my associates have dubbed the “Woody” Indicator and those who have both products are already reaping the benefits that is immediately visible.  Yes, I know that those who are good at “scraping” gems like this will immediately do so into their favorite programs, but over these past twenty years I have given generously of my research to help others help themselves.  Of course Ron and I expect some return for all the work we do by attending our Seminars and buying our Newsletter and many of you have supported us faithfully over the years for which we thank you.  However, in this day and age it is a fact of life that scraping is here to stay without nary even a Thank You!

So now by any stretch of imagination the Market is Overbought and the key at this stage is to understand Fear and MeltDowns which is easy to figure out with what you see on this next slide, where I have given you the whole nine yards:
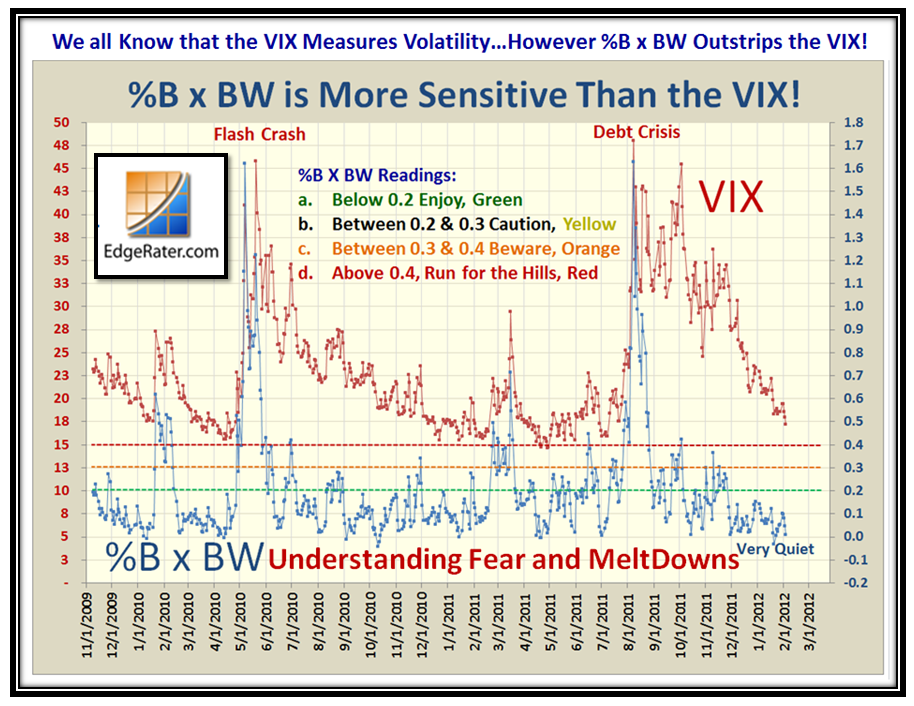
I see a lot of jabber on the HGSI Yahoo bb today about the TVIX and its value in hedging one’s Portfolio at times like these and I hope that those who are into this high risk good stuff will sit up and take note of how and when to get the best of both worlds BEFORE the TVIX takes off into the sunset:
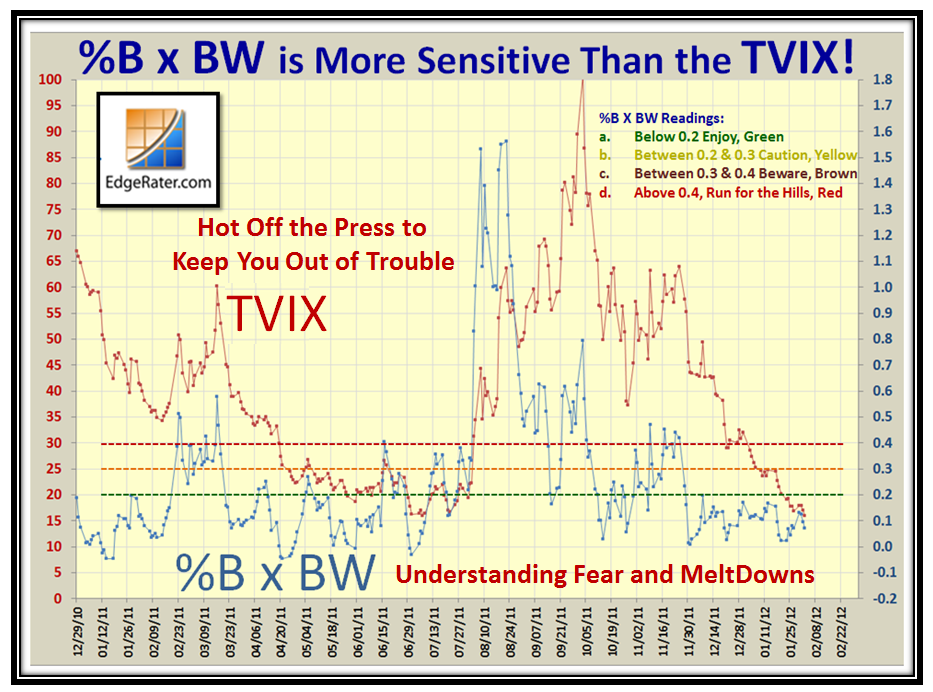
If the cap fits, I will remind those who had promised me their third million that I am still waiting and maybe this goodie might tip the scales!

Now then…here’s a new teaser for you to ponder over when a market like this can take off into the sunset ala March 2003 and 2009, so don’t be asleep at the switch…more fun to come:

As I mentioned in my last Blog, we are holding a series of “Drip Fed” Videos that you can view at your leisure and we thank you for your enthusiastic response to our advertisement to help you help yourself.  I’m sure you enjoyed the one that Ron did a few days ago and also the introduction by Chris White to what I will do next Tuesday, so look out for that, or if you haven’t, you can still Register:
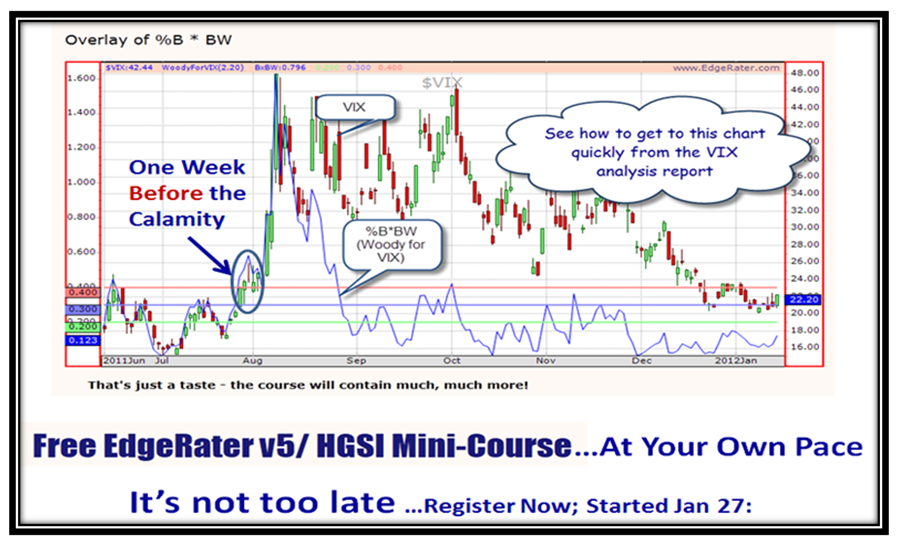
Please take a moment to register for the EdgeRater / HGSI mini-course below:

Register for the course

…And last but not least, if you like all you see, why not sign up for the Seminar on March 24 to 26 where you will get the whole nine yards:
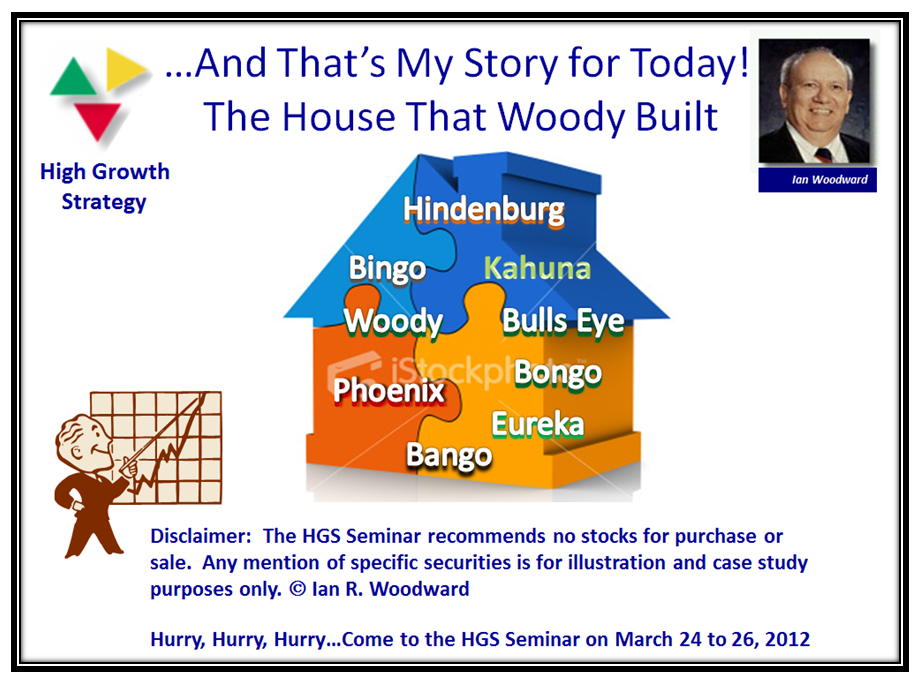
Register for the seminar:

Register for the seminar

Best Regards, Ian

Copyright © 2007-2010 Ian Woodward
Disclaimer: Commentaries on this Blog are not to be construed as recommendations to buy or sell the market and/or specific securites. The consumer of the information is responsible for their own investment decisions.