The Stock Market has Met an Immovable Object
The Market is marking time waiting for the Unemployment Report due out tomorrow, and by the looks of things it seems we may have had a leak that the numbers are not going to be good, given the late sell off in the last half hour. Neither the Bulls or the Bears have been willing to make a major commitment and the Line in the Sand these past 16 days has been at the convenient easy number to remember of 1111.
The Bulls held a slight edge with the S&P500 sitting at 1110 until the last half hour drove it down to just under 1100. Fortunately we have a tight Darvis Box around the last 16 days trundling back and forth between 1110 and 1085, so it is not difficult to make a call to the downside if the report is wishy-washy and the S&P500 breaks 1085 to the downside.
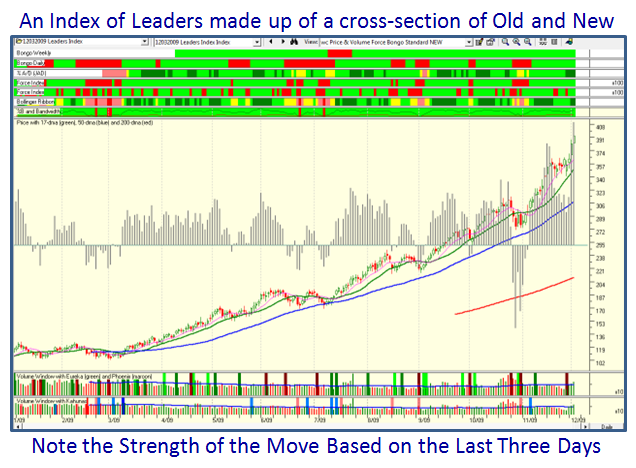
At times such as these where the market can go either way, it pays to think out of the box and find a set of old and new Leaders based on their recent performance. I have picked four distinct groups of five stocks each, and those that follow my blog will soon understand why.
There are plenty of new name leaders that have been making a move, including CAAS, HEAT, RINO, TSTC, and MELI. Likewise, the likes of AMZN, REV, MED, LFT, and CREE have also shown their stripes. Yet again some old favorites which have been basing and yo-yoing for the past few weeks are poised to go again such as SXCI, CRM, FIRE, VPRT, and RHT. Throw in the Old Silverbacks like AAPL, GOOG, BIDU, PCLN, and ISRG which have been relatively quiet of late and we have an Index that will quickly tell us which way the wind is blowing.
Naturally, this group is heavily biased towards Technology, which is always a favorite Sector to lead one out of the doldrums. However, the Index provides a good cross-section of 16 different Industry Groups and no more than two stocks in any one Group. If the Santa Claus Rally is on, be rest assured this Index will be really fat with profits and leading the way. If not, it should give an early warning since it is already fat with profits anyway. Here is what the Group Index looks like:
Now don’t all shout at once…yes the HGSI Team is working on goodies for the next seminar in March 27 to 29, 2010 and I am giving you a peep show of just a fraction of what we will have for you.
In honor of a very fruitful luncheon I had with John Bollinger this past Tuesday thanks to my good friend Chris Wilson making a charitable donation for “Take a Technician to Lunch”, we have now incorporated a couple of ribbons which are new to the “wc” chart you are all familiar with. This work is in beta test at the moment, so NO amount of yelling and screaming will give you what you see.
However, take it as the HGSI Team’s early Santa Present for you to drool over as we raise the bar one more time in March. Yes, it is hard coded in the software so it comes up in a flash, and there will be no more excuses not to use the RoadMap to Hog Heaven with the wc chart! Lurkers…it’s time to buy the software.
Good luck and good hunting.
Best Regards, Ian.
 Ian Woodward's Investing Blog

