Stock Market: Biggest Bungee Jump Yet on %B Below “0”!
The hour is late and I can see that there are a lot of you giving me support for my work, but I am now in overload. Anyway, this may help some of you tomorrow to have an update tonight of exactly where we sit with regard to the Market. There are several messages in the following dozen charts so you will have to plough through them carefully. Moment traders are even finding it hard to stay on the right side of the market.
Of course there are many with ants in their pants who are itching to catch the bounce play, but be careful you don’t get cut by the falling knife syndrome:, especially as we have the jobs report tomorrow:
I couldn’t resist another picture to capture what was a technical point gone haywire when the “hammer got nailed” today:
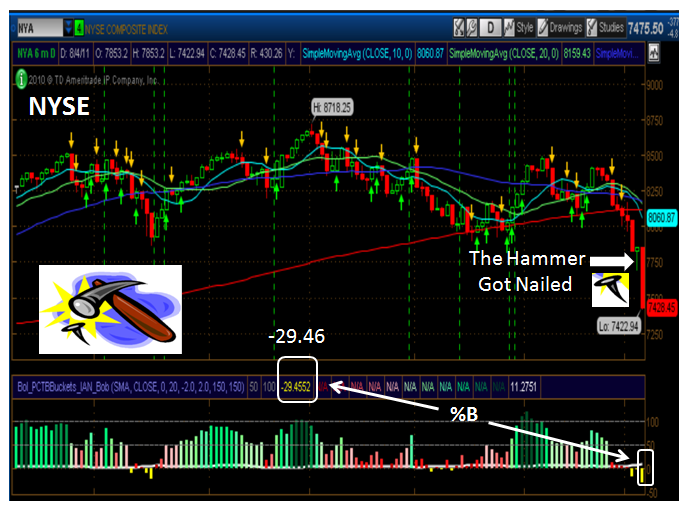
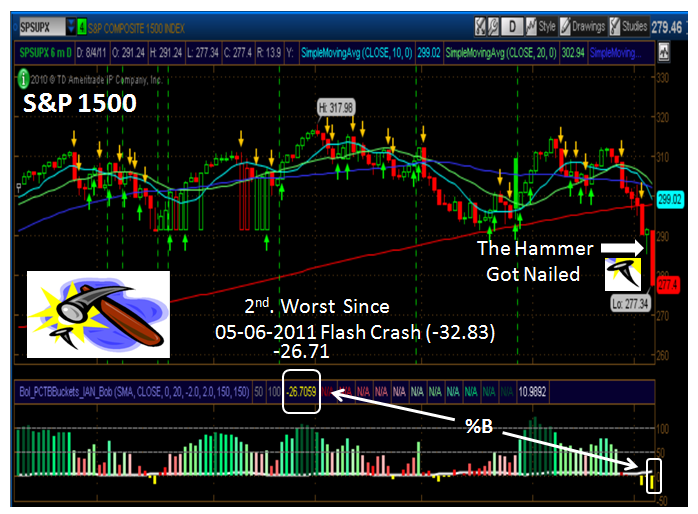
…And here are two examples to show you what I mean using the NYSE and S&P 1500 Indexes, respectively:
These low numbers are seldom seen for %B, so make a note for the future:
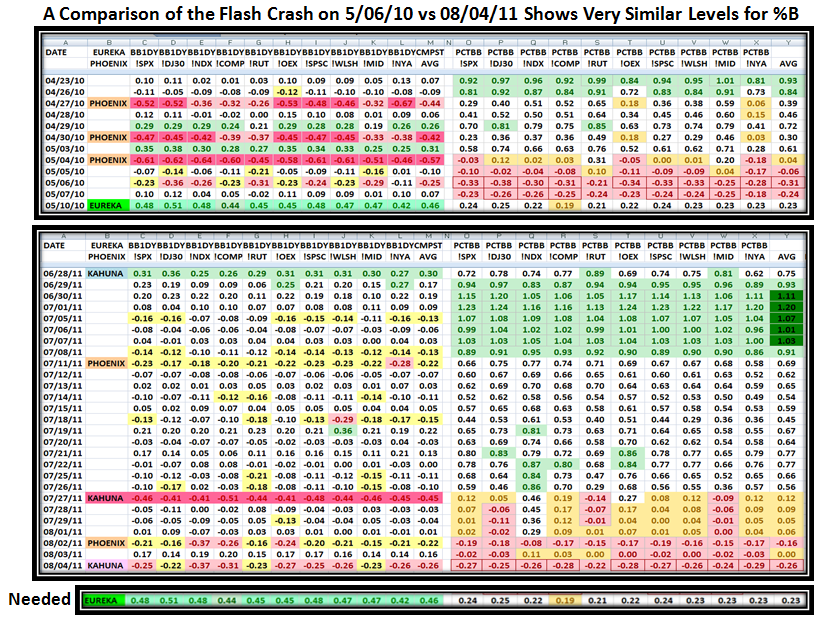
Always use a Stake in the Ground and a Measuring Rod: Here is a Comparison of the Flash Crash and Now. It doesn’t take two minutes to realize that when a market is this oversold the Bounce Play is around the corner, but it has to be robust to lift the Market off the bottom:
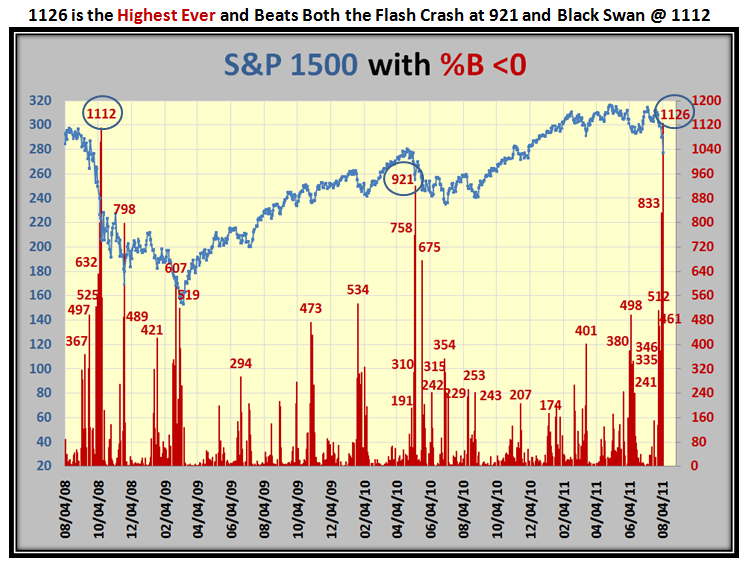
Now this chart is an eye-opener…The number of S&P 1500 stocks with %B <0 is the highest on record…so that will give you a feel for how deep this correction is at already, although it is only down ~12% or Intermdiate Correction level:
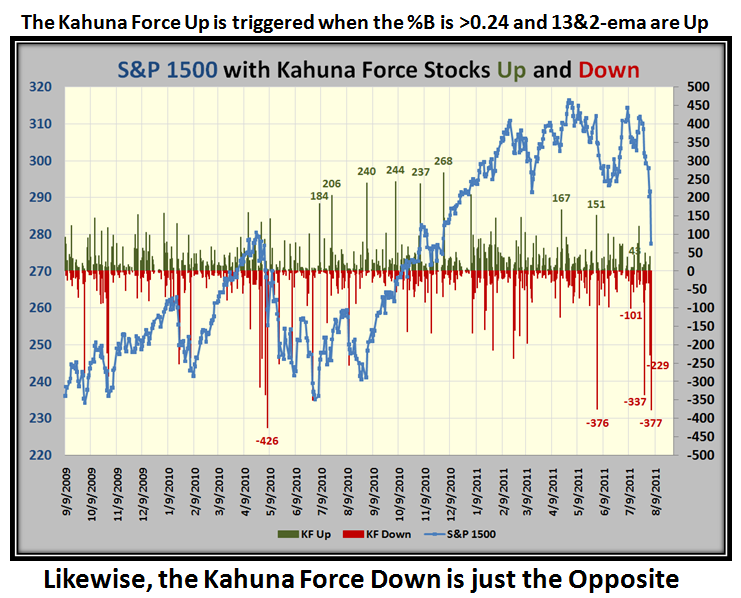
Here is a new one for you…Ron and I call it the Kahuna Force, and the criteria is explained on the chart below:
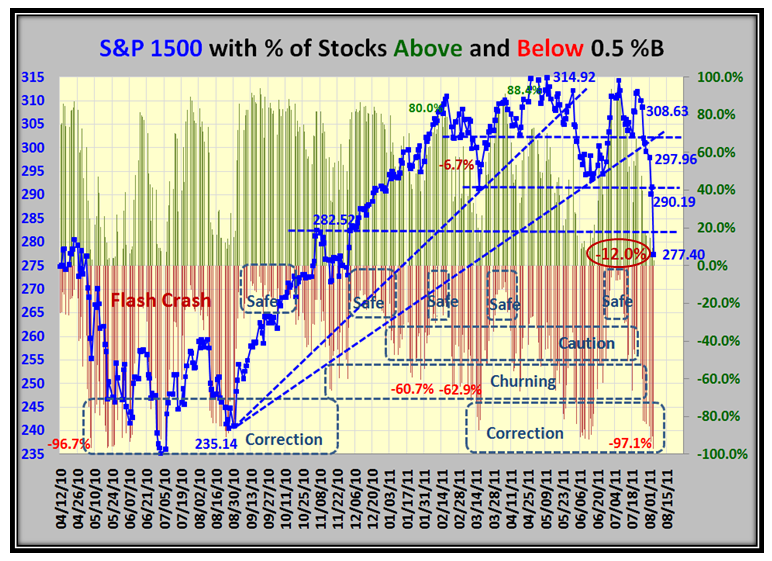
This next chart is a favorite of ours and shows that again we are as oversold as the Flash Crash numbers and are -12% down from the high:
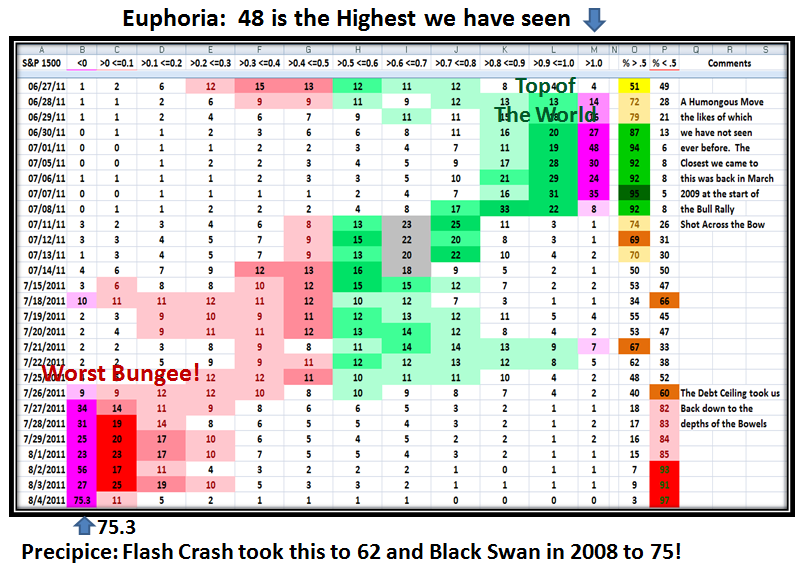
…And this chart confirms the biggest Bungee Jump on record, surpassing both the Flash Crash and Black Swan:
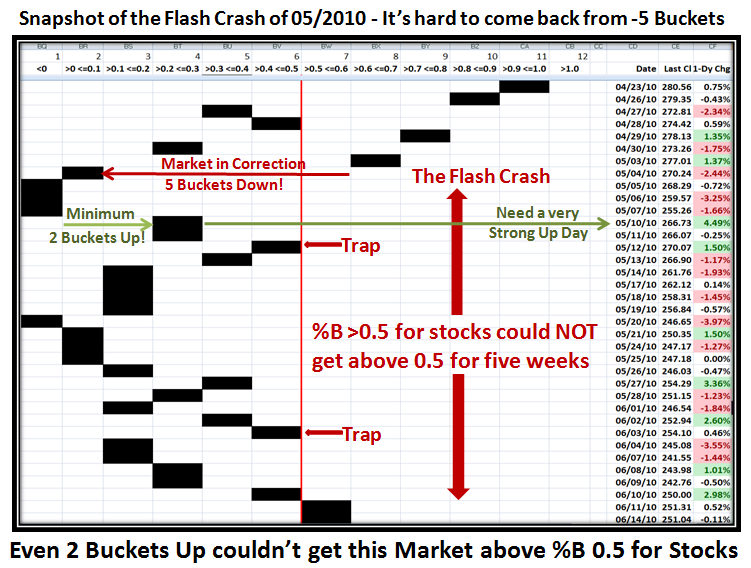
When we have a 4 or 5 Bucket down day, it always sets the stage for a Correction. However the return path is slow so be careful not to be caught in a Fakey as shown in this Flash Crash slow come back that produced several traps along the way.
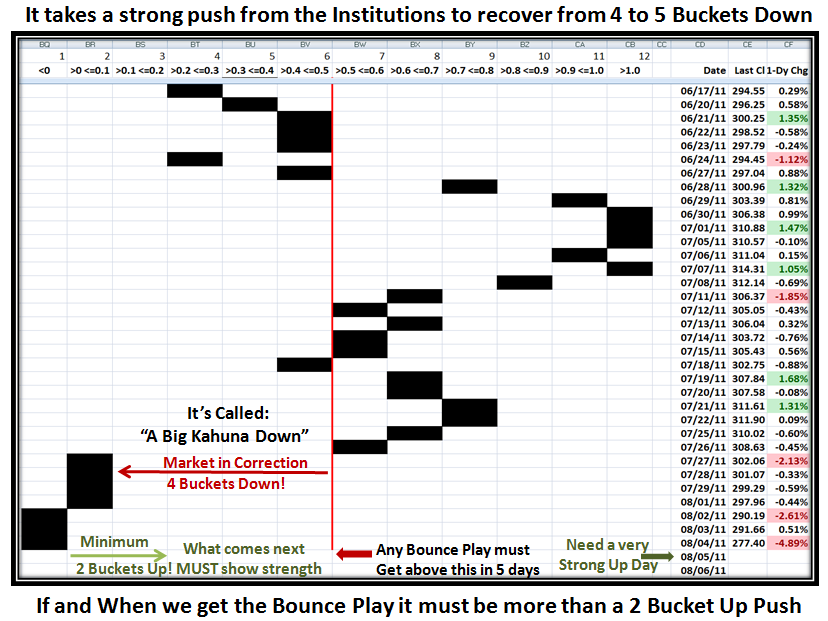
…And here is where we stand right now. Don’t forget we have the Jobs Report tomorrow:
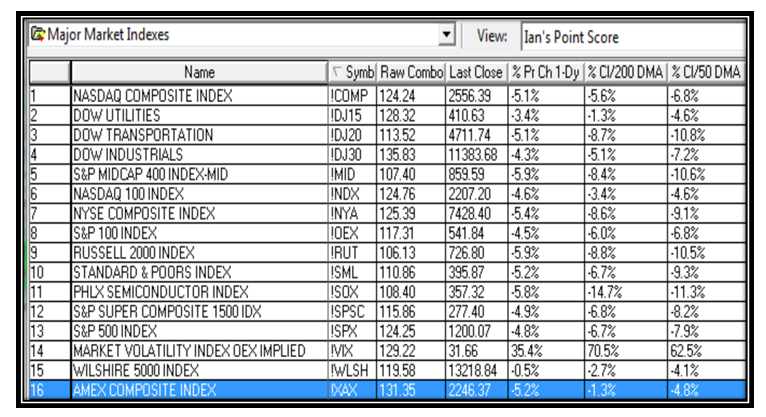
The challenge to fight the resistance is a lot tougher after today as we can see from this next chart. It shows the distance from the 200 and 50-dma and since few Bounce Plays provide more than about a 5% up move within 5 to 7 trading days, we can set the immediate targets to get over these natural resistance levels that all Technicians watch. In addition, if you put up Fibonacci levels from the Recent Base Low around 9/01/2010 you will see that we are right at the 50% level, so use that as a guide both up and down from there:
I like to have your feedback so spend a moment and make a comment if you find this of value to you. Better yet, tell your friends to visit my blog!
Best Regards, Ian.
 Ian Woodward's Investing Blog
