Pump & Dump, Slop & Crop, See-Saw…Whatever!
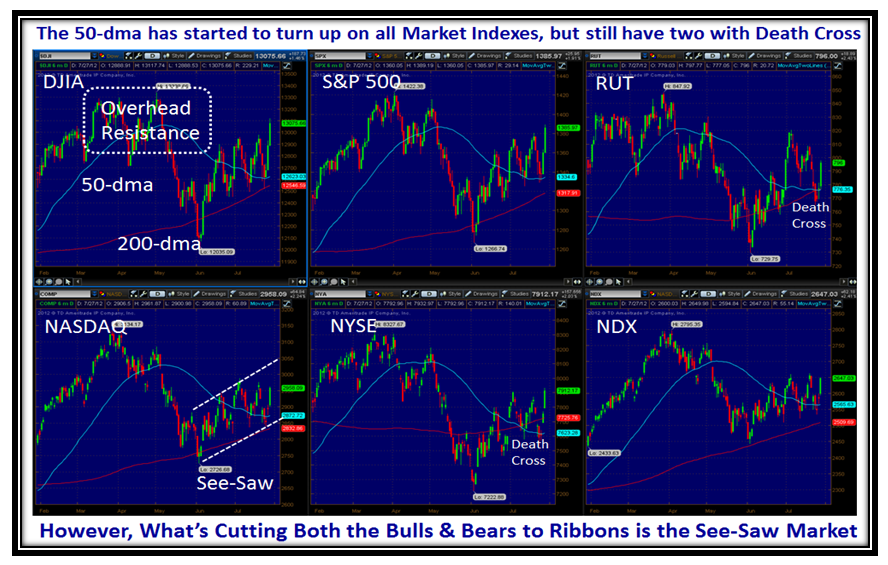
Can you believe the two-day turn up for the books on Thursday and Friday of last week to raise the hopes of the Bulls that there is enough momentum to lift this Stock Market out of the doldrums. Make no mistake about it this was a strong rebound as I will demonstrate in the ensuing charts. However, we are still suffering from a chop-chop market:
Prior to the last two days we were in danger of heading down to break the 50-dma on all the Market Indexes, and although we have two Indexes with Death Crosses where the 50-dma comes down through the 200-dma, we now have a whiff of all Markets with their 50-dma turned slightly up:
This See-Saw Market now has a pattern to it which is five days up and down (between friends) for the past five weeks with little progress to the upside:
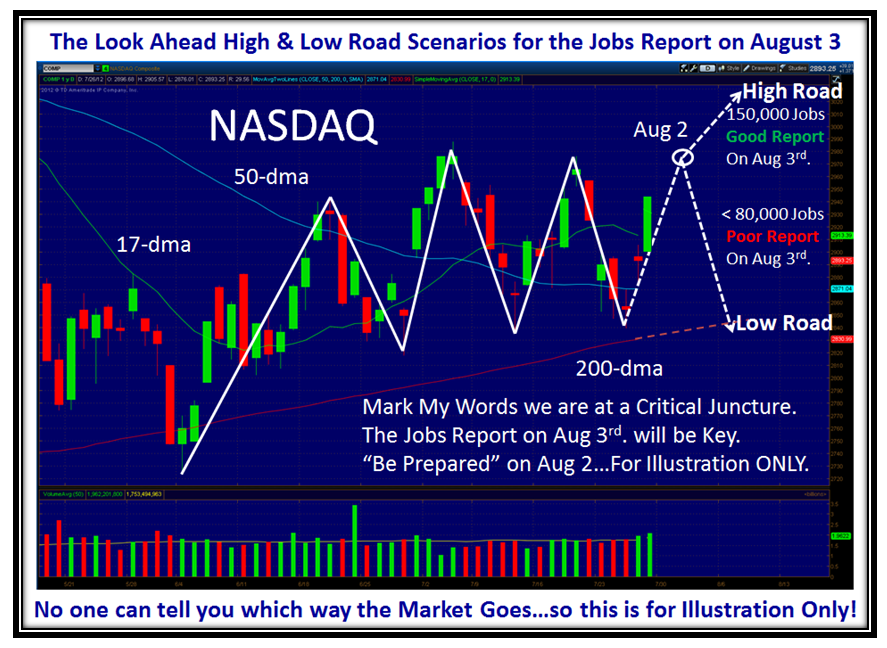
However, with two explosive moves upwards on Thursday and more especially on Friday where we had a Strong Eureka, the Bulls can now hope that they can once again get the Nasdaq above 3000 and close the gap as shown by August 2nd. Don’t tell me you have forgotten the significance of August 2nd?…Be Prepared for the Jobs Report on August 3rd. At least the European Central Bank president, Mario Draghi, turned the market upwards with his assurances to preserve the Euro.
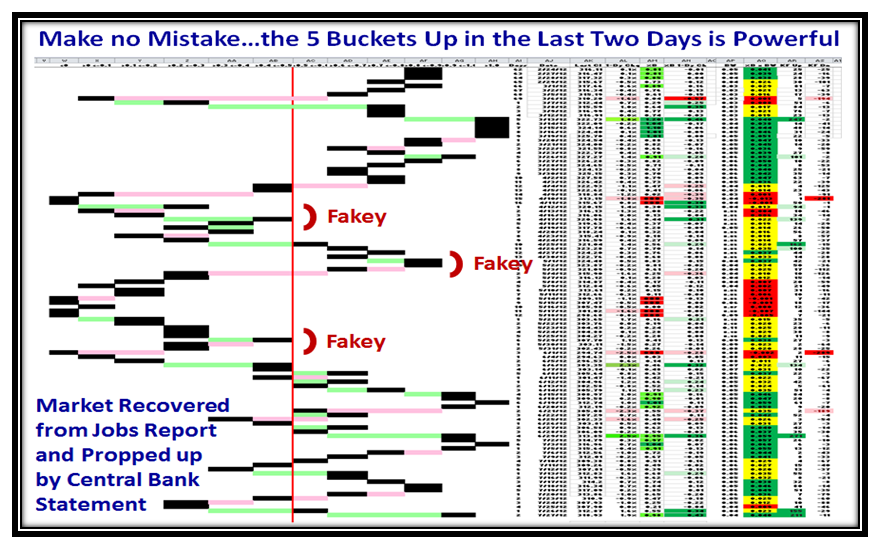
This two day upward thrust of 2 Buckets and then 3 Buckets up has put a whole new compexion on the momentum of the market. We must now wait and see if it was yet another flash in the pan of supposedly good news or whether we fall back once again into the doldrums:
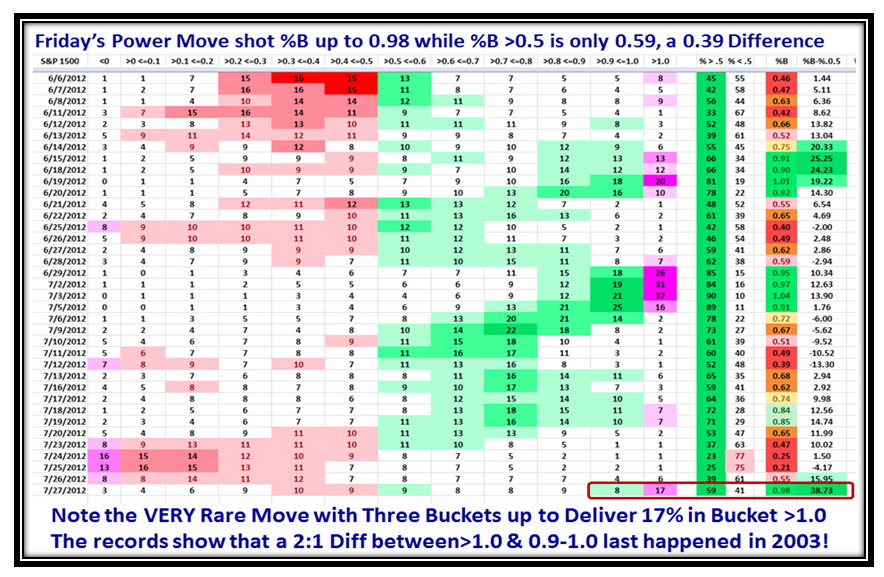
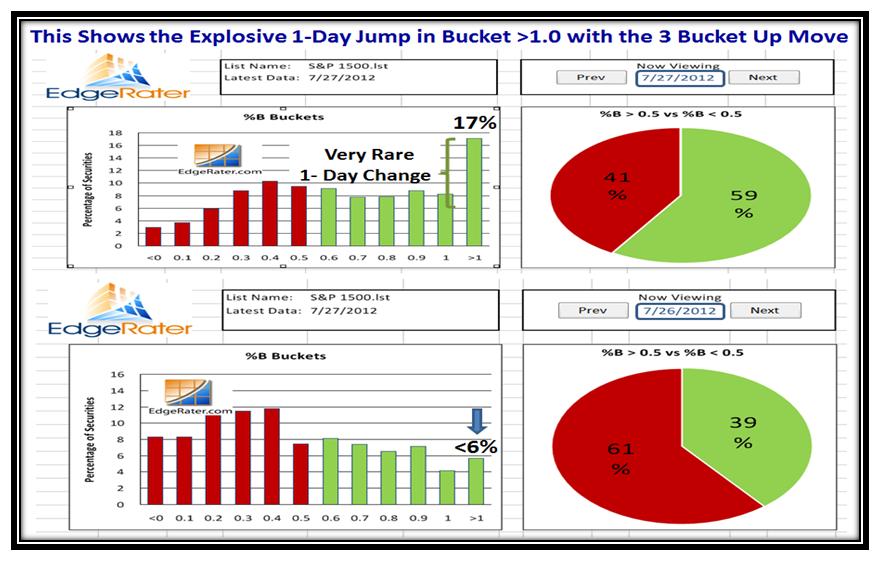
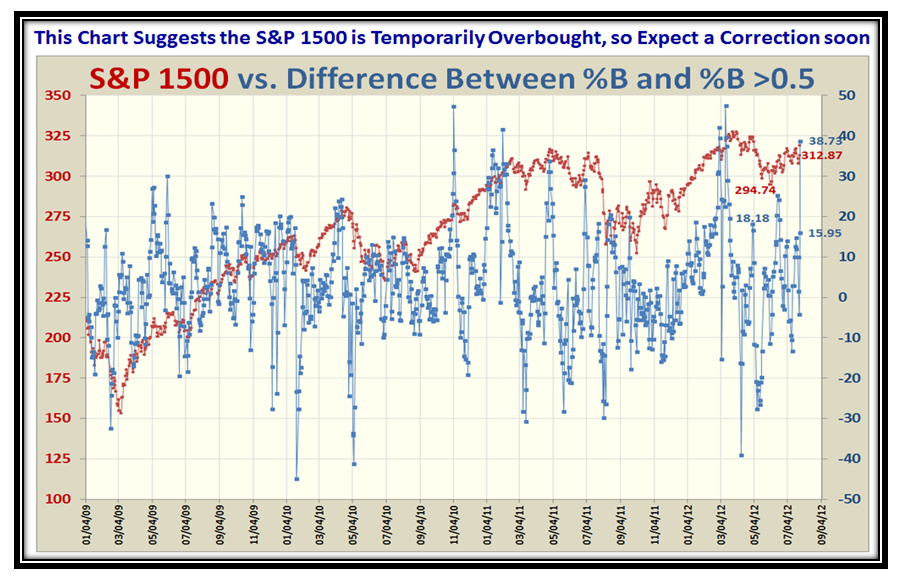
Reviewing past history shows that the move on Friday to jump from 6% on Thursday in Bucket >1.0 to 17% was no mean feat and was similar in momentum to back in March of 2003! We must also note that the %B for the S&P 1500 is now at 0.98, whereas the % of Stocks above 0.5 is only 0.59, a difference of 0.39. This suggests that we are truly overbought in the Leaders, and we either amble around here for the rest of the pack to catch up or we slide down into the doldrums once again. I have my dear friend Pat Turner to thank for the concepts displayed above and below:
Note also the 1-day change in the Pie Chart and especially the one day jump from ~6% to 17% in Bucket >1.0, which is not to be sneezed at:
Now here is a New Chart to get your arms around. It shows the DIFFERENCE between %B for the S&P 1500 Market Index and the % of S&P 1500 Stocks >0.5. You will note that it jumped from 15.95% to 38.73% in one day. Note that we are now in nosebleed territory and it is most likely there will be a correction and then hope that the Index itself will go higher.
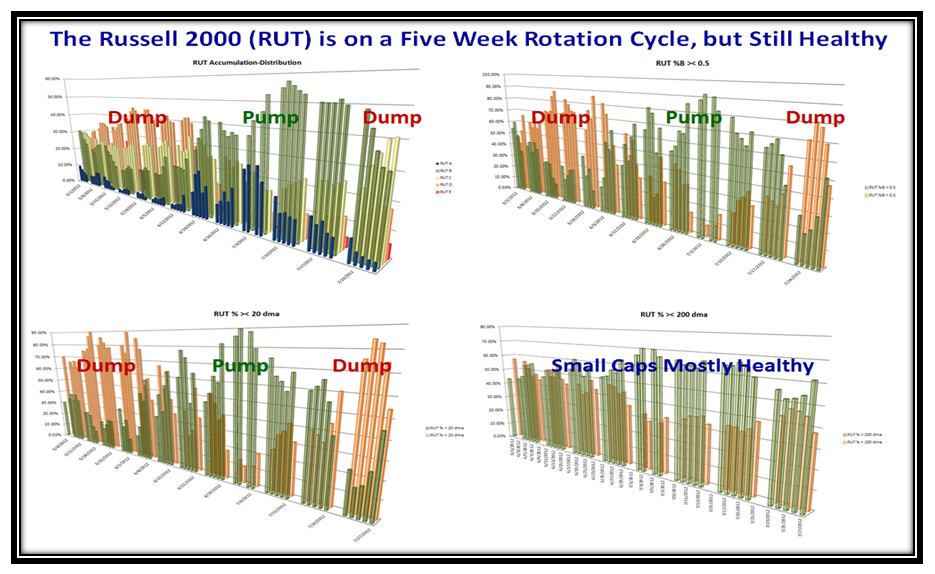
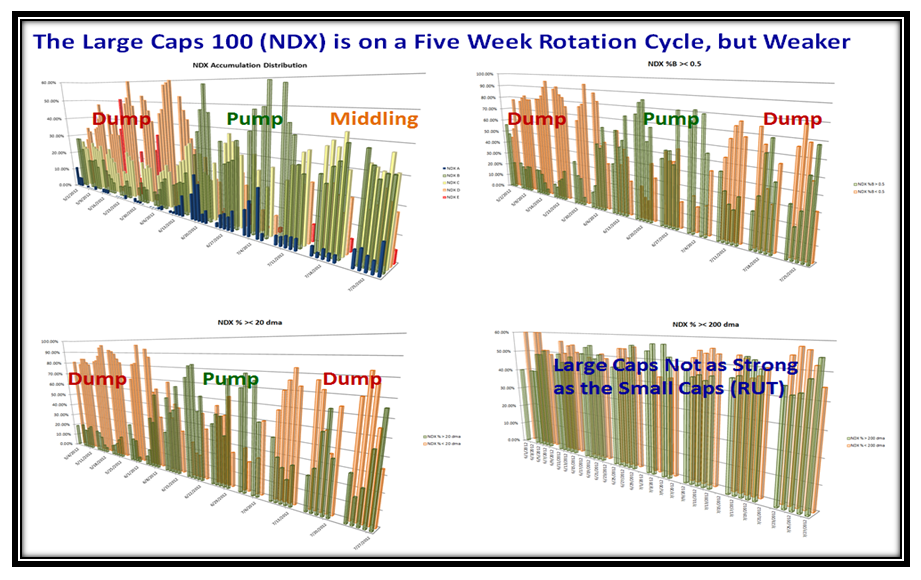
Three Cheers for my good friend Dr. Robert Minkowsky who has turned up trumps once again to give us a more rounded feel for what is transpiring in the Internals of the Market Indexes and specifically the Small Cap Russell 2000 (RUT) within itself and then compared to the Large Cap Nasdaq 100 (NDX). The pictures are for Acc/Dist, %B ><0.5, %>< 20-dma and %>< 200-dma. Note the Dump, Pump, Dump cycle we have been in since last May:
My good friend Maynard is holding his Monthly Group Meeting this coming Wednesday and I hope they will chew the fat on all of the above and especially my sense of the projected High and Low Road Scenarios to come. This anticipates two conditions I gave you in my last blog note on the Jobs Report due this Friday, which I hope you have pinned to your desktop:
In a nutshell, the Jobs Report had better be good at >150,000 or so and not <80,000 for the gurus to get excited to the upside!
I hope you are all enjoying the London Olympics.
Best Regards,
Ian.
 Ian Woodward's Investing Blog