Round #3 at the OK Corral is Almost Over
Over several months since the market peaked in October, I have kept account of the critical fights for territory between the bulls and bears, and now we are into round #3.
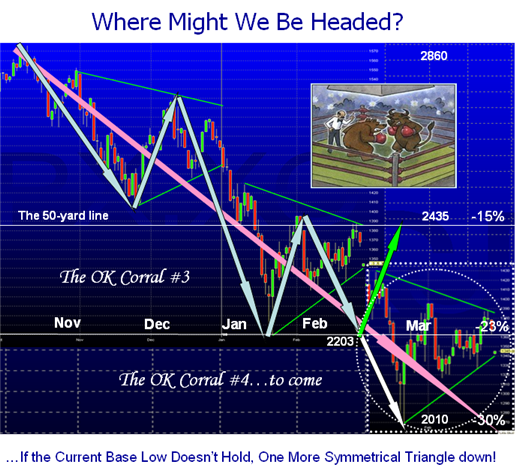
Round #3 of the Fight at the OK Corral between the Bulls and Bears is fast going to the bears despite the encouraging contra trend rally we experienced. It was still too weak to hold and having broken the triangle to the downside it seems we are headed down again to test the low at 2203.
It is now very apparent that with today’s action that the odds are high that we will retest the previous low on the Nasdaq at 2203, as we are now just ~ 50 points off that low. I felt it important to expand the playing field to include a HYPOTHETICAL third leg of a symmetrical triangle as shown in anticipation that at least we are familiar with what it might look like…should it come to pass. Of course I am game playing, but there is little harm in having a game plan that bounds the Bulls and Bears Scenarios.
Bear Scenario: Today was an extremely high volume day with 2.7 Billion shares traded on the Nasdaq, with 298 New Lows and only 14 New Highs on the Nasdaq. With that low New Highs it will take a big positive surprise to turn the sentiment around, and deliver over 150 New Highs to kick start any form of rally. The Nasdaq eked out a positive gain in the last half hour when Charlie Gasparino once again fed his latest understanding of the hope of an Ambac bailout which yet again took the DOW up to close just down 45 points and bring the Nasdaq back to positive territory having been down over 25 points for most of the day. INTC’s bleak outlook, GOOG down below the $450 mark and Ben Bernanke speaking at a community banking forum in
Based on Past History of the Nasdaq Bear Markets since 1973, we already had a -23% drop when we last hit 2203 five weeks ago on January 22. This drop was the second lowest since 1978 which had -20.37%. The Average over the 13 Bear Markets is -36.5% so if we are to head down, it would not seem unreasonable to suggest that -30% would be an appropriate next leg down (white arrow). That would put it only in the lower third of past results, and if and when we get there we can review the bidding further. A 30% drop would put us close to 2010, which is the Base Low of July 21, 2006 when we first had a taste of the extreme Volatility we have today. That is depicted by the White Arrow on the chart.
Bull Scenario: Given that the hope of the Bulls is that capitulation will occur at the double bottom of 2203 and they can muster enough good news to propel them back up on a Bounce Play one more time, the best they can expect at the first instance is a quick repair to 2435 (green arrow), the 50-yard line I show on the chart. What is significant in the psychology of the market about 2435, you might ask? You will recall on January 10, 2008, Helicopter Ben gave a speech where he said that the Fed would “Take Substantive Additional Action” and the Stock Market yawned and went rattling down from there as shown on the chart. That drove the chart down into the second symmetrical triangle. It has yo-yoed for the past 5 weeks and has completely run out of steam, so the only other potential good news would be an extraordinary rate cut of 50 basis points prior to the March Meeting.
Best Regards, Ian.
 Ian Woodward's Investing Blog
