Ian Woodward's Investing Blog

Archive for the ‘Market Analysis’ Category

Stock Market: A Turn Up For The Books!

Monday, July 2nd, 2012

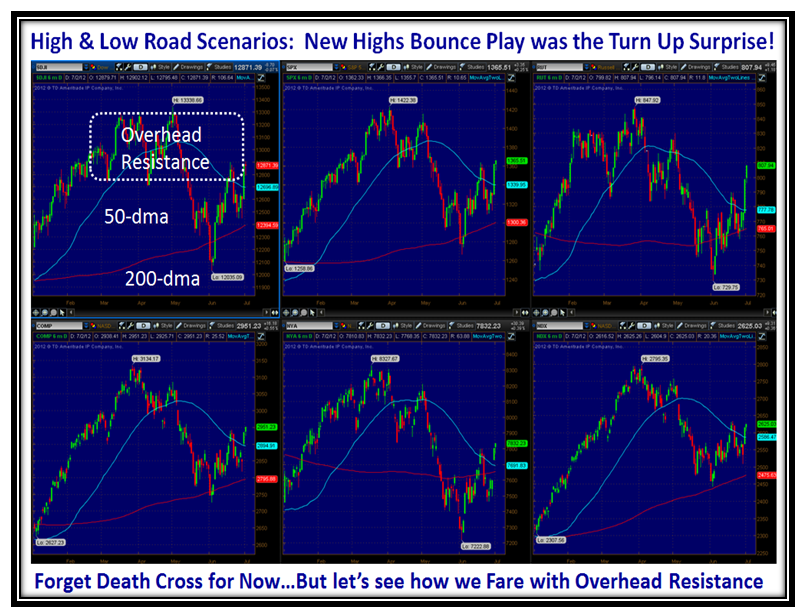
After the major surprise on Friday when we had an enormous 3% Day on most Market Indexes, we had a Turn-Up for the Books the likes of which is seldom seen:

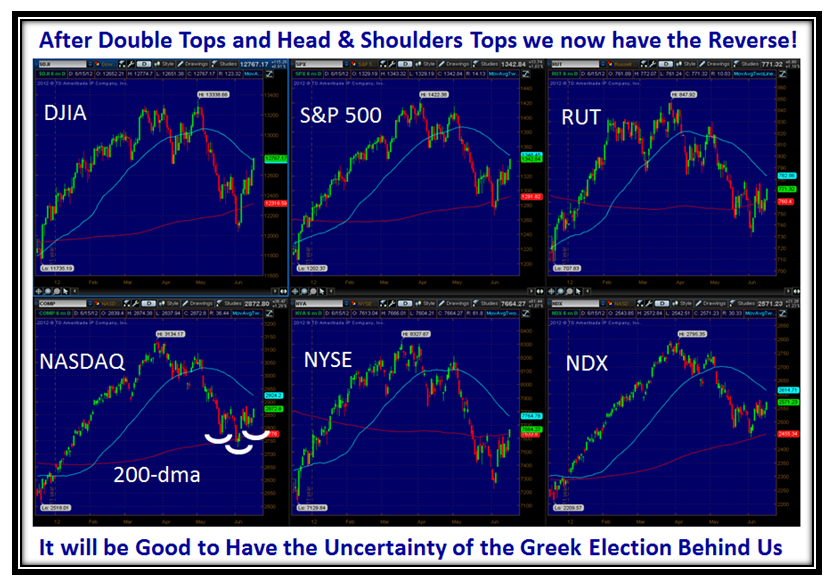
Here is what happened to the Market Indexes and the Strong Bounce Play resulted.  Death Cross is on the Back Burner:

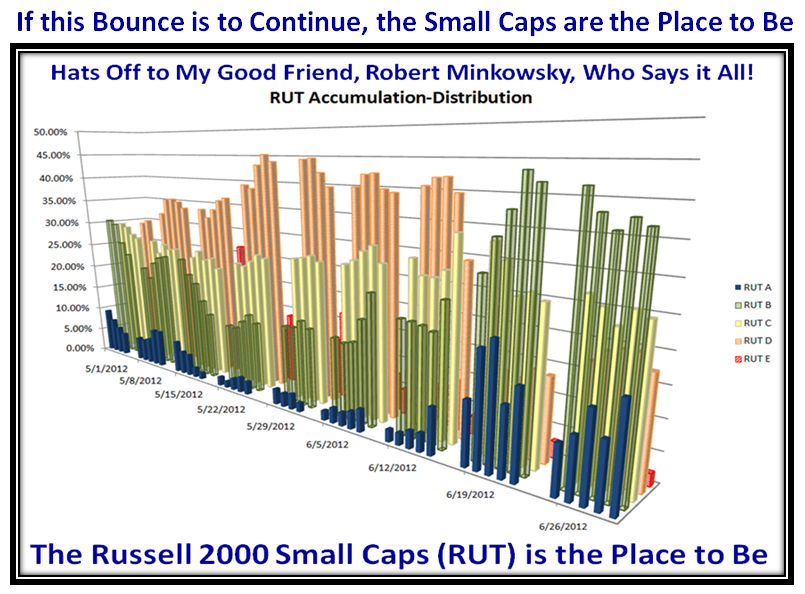
Here is a brand new view that I am indebted to my good friend Dr. Robert Minkowsky for sending me.  It says it all…The Russell 2000 (RUT) is the place to be!

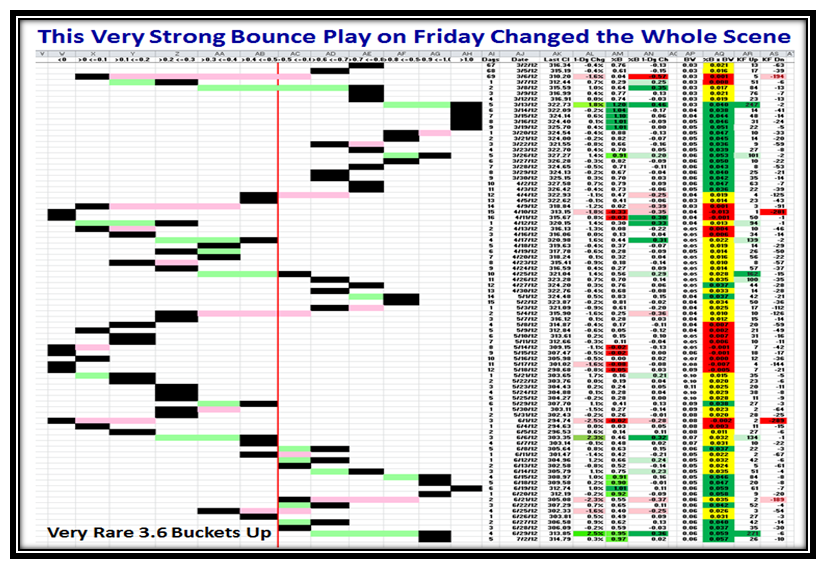
Make no mistake about it, the Momentum on last Friday was humongous with 3.6 Buckets up on the S&P 1500:

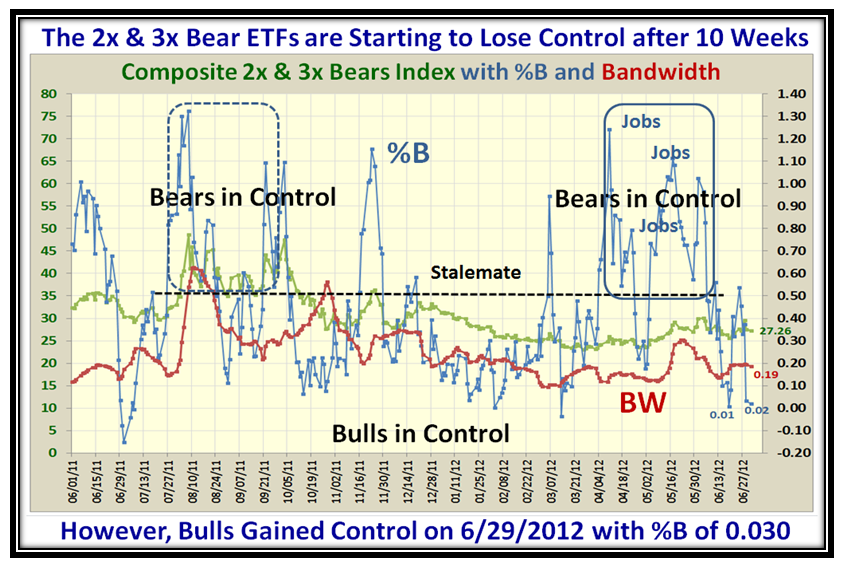
The 2x and 3x ETFs show that the Bears lost control on Friday and we are now firmly into Bull Control Territory:

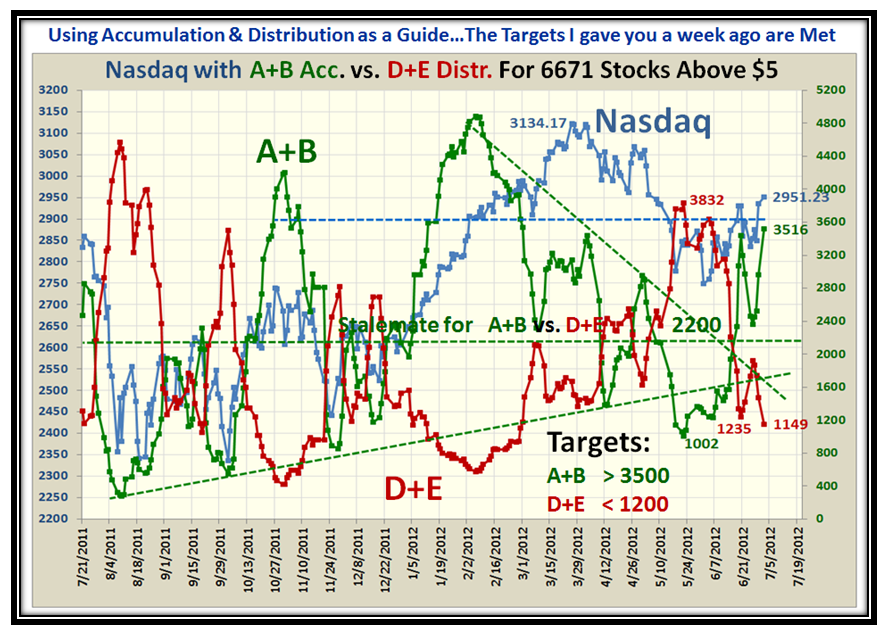
Also, Accumulation/Distribution Targets I gave you a week ago are Back into a Healthy Bull Picture:

I can tell that many are looking forward to the 4th. of July Celebrations on Wednesday…Have fun.

Best Regards,

Ian.

Stock Market: More See-Saw

Thursday, June 28th, 2012

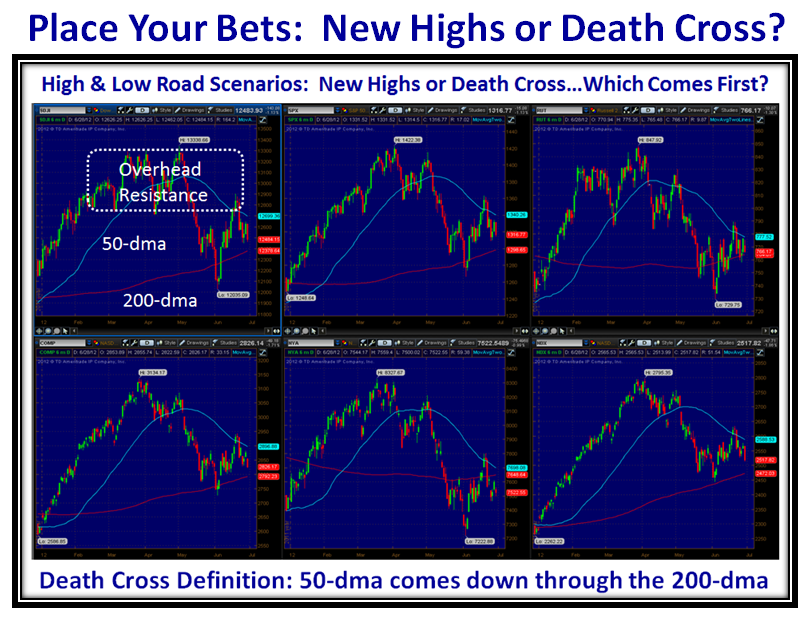
Lesson learned:  It’s called “Buy the Rumor, Sell the News!”  Now the $64 Question is “Black Cross or Up, Up and Away?”  Well, I have to get my jollies sometimes, so as the highgrowthstock bb is mighty quiet here you go:

Although the “Market has Spoken” there is no Panic Selling since the volume is mediocre.  For what it is worth, I say again to Type 3 & 4 Long Term Investors “Keep your Powder Dry!”  Intra-Day Type 1’s play to your Heart’s content, since you are Nimble!  I leave you with my feelings:

Thanks to those who took the time to comment on my last note.  Best Regards,

Ian


Stock Market: See-Saw Stalemate

Wednesday, June 27th, 2012

The hour is late, but for my International supporters especially in the Far East they would like to get a feel for what is occuring on this side of the pond.  Bottom line is we are in Stalemate and bouncing up and down:

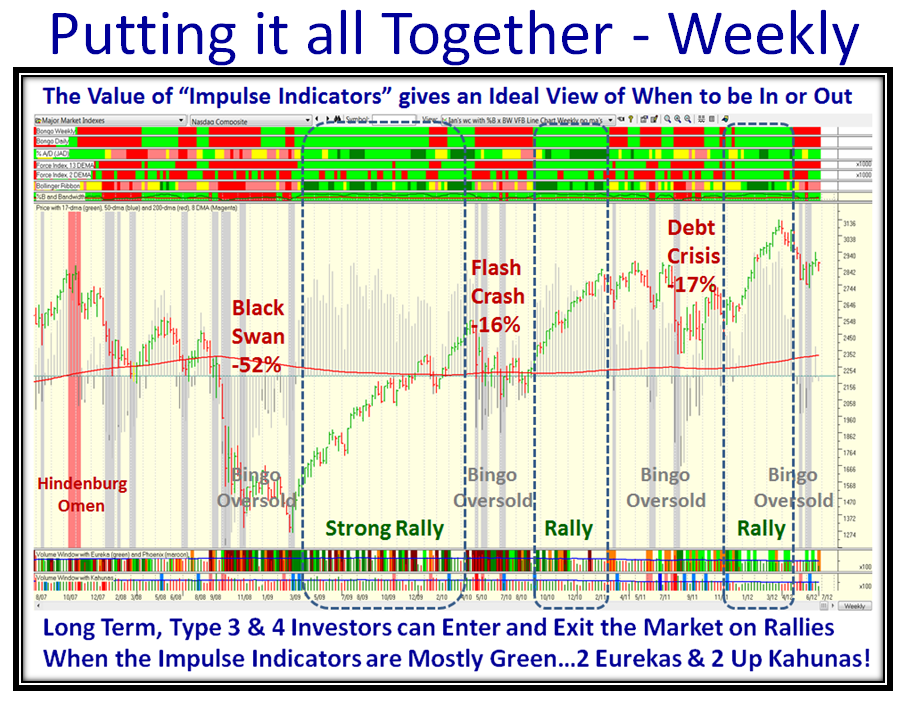
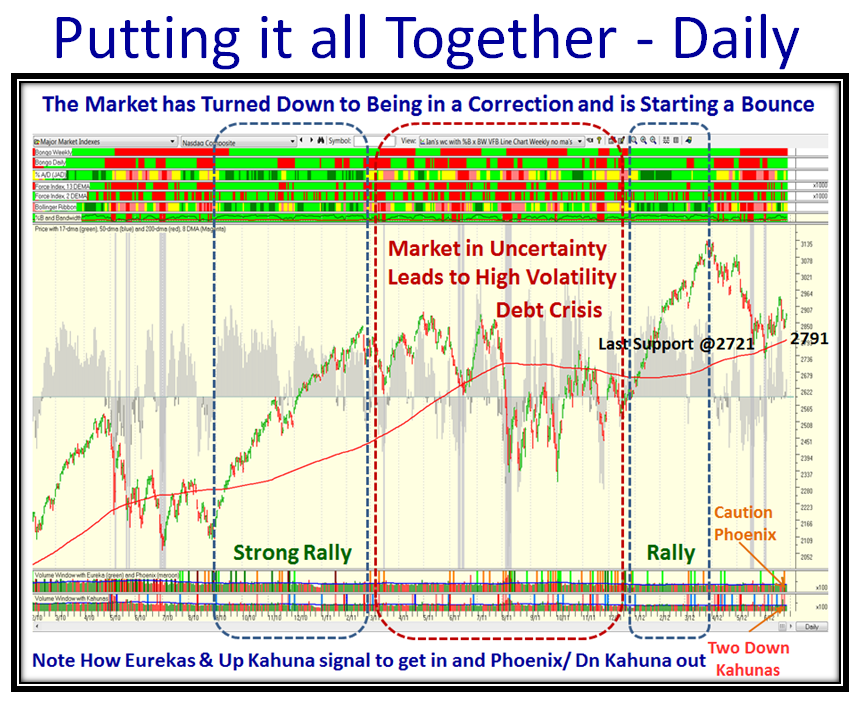
Let’s step back and put all that I do together using Impulse Indicators with both a Weekly and Daily Chart for the last few years.  I have kept you on the right side of the Market with Eurekas, Phoenix and Kahunas Up and Down:

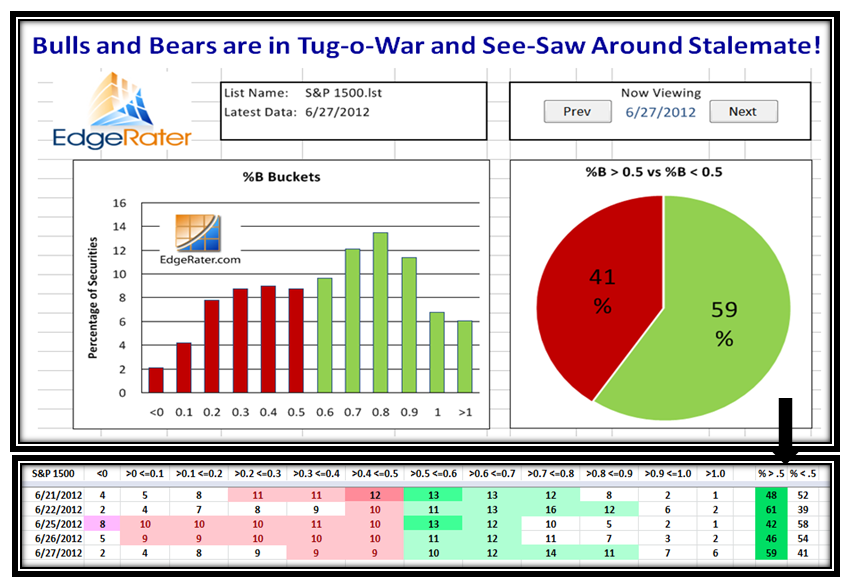
%B has flip-flopped either side of the 0.5 line these last 5 days, so Bulls and Bears are in a tug-o-war:

More of the same showing the Stalemate:

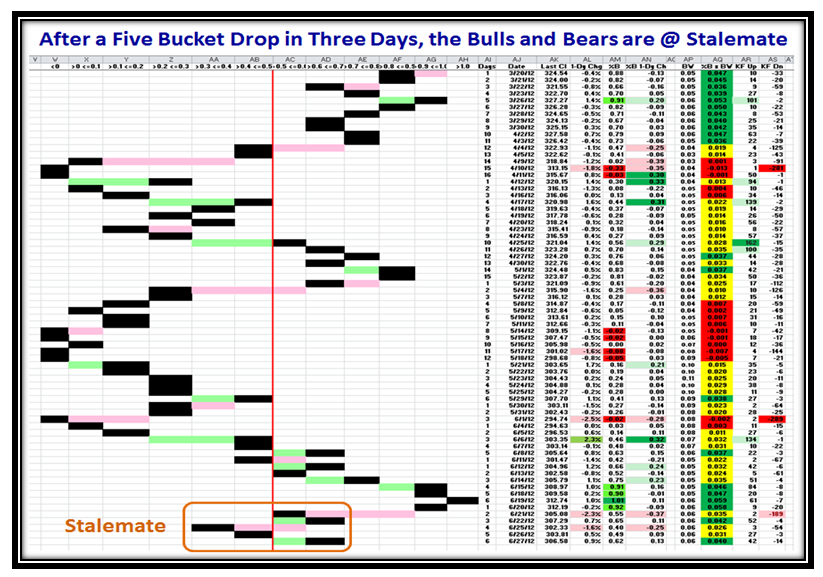
Although there was a three Bucket down followed by a two bucket down day two days later, we are  near Stalemate:

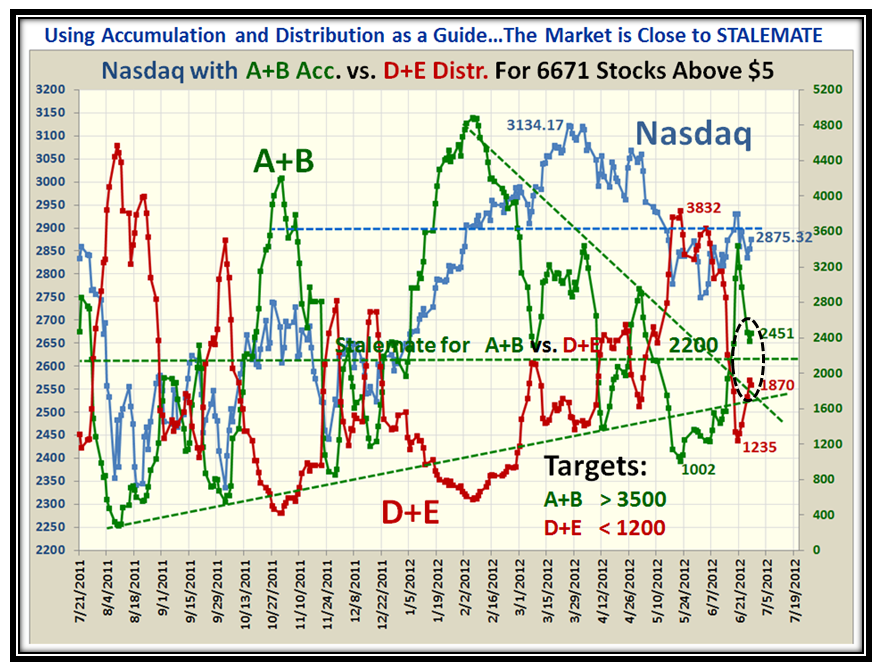
…And here is the same thing using Accumulation and Distribution:

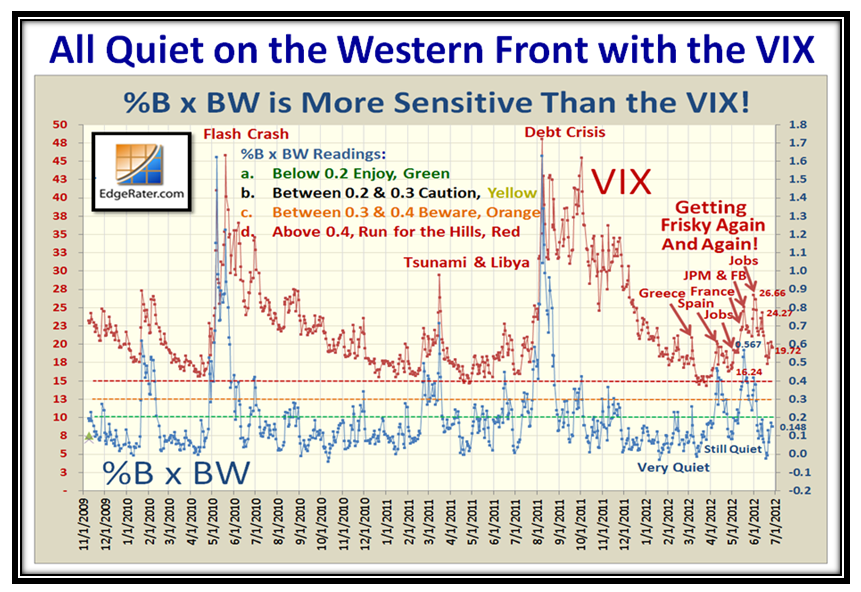
Last but not least, we are “All Quiet on the Western Front” with the VIX:

Best Regards, and Long Term Investors should keep your powder dry until this yin-yang settles down.

Ian.

Stock Market Climbing a Wall of Fear

Sunday, June 17th, 2012

With all the Fear and Uncertainty who would have thought the Market would be climbing up a Wall of Fear?  We shall see what today’s Greek Elections bring and as I write this the Late Breaking News is that “Greeks Back Bailout Party, and the New Democracy is the Projected Winner”.  It holds a narrow lead over antiausterity Syriza; they are expected to attempt to form parliamentary coalition, possibly with socialist PASOK party, projected to finish third.  Such a coalition could ease global tensions  by accepting bailout austerity, staying in euro zone.

The Market Indexes finished strong on Friday despite Options Expiration and all the uncertainty swirling from Europe.

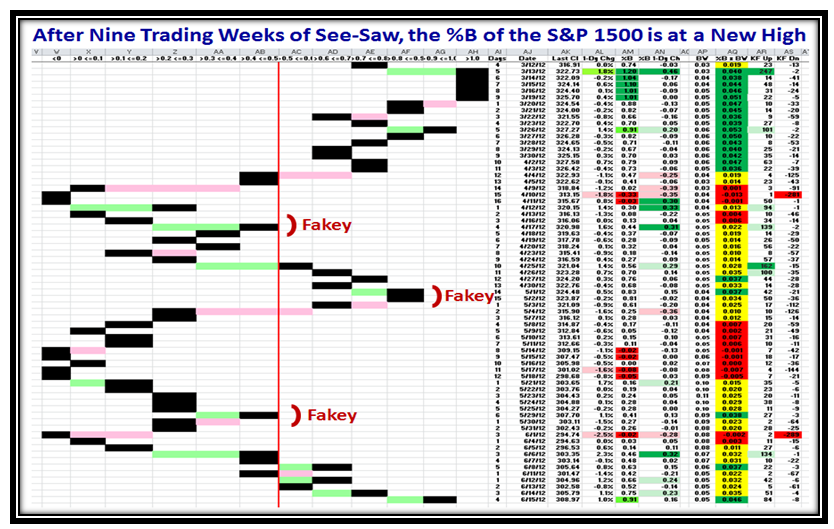
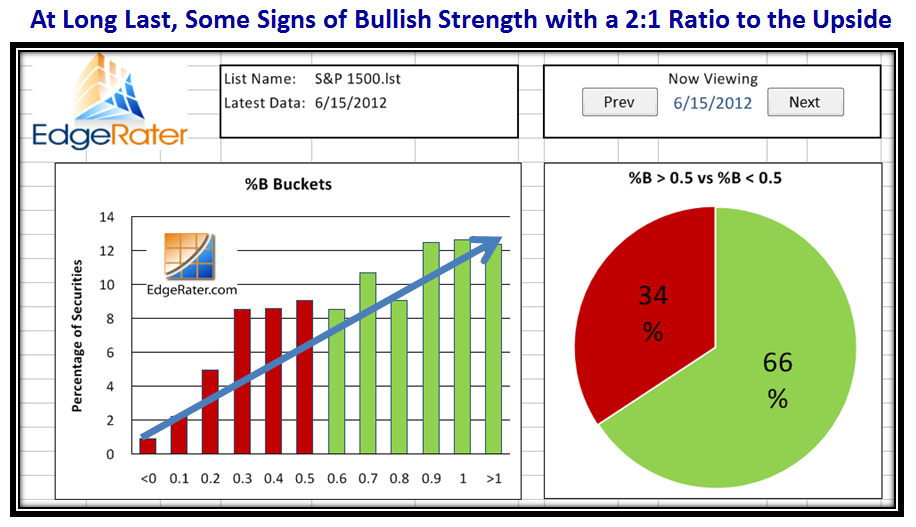
At long last after three “Fakey’s” where the %B of the S&P 1500 has been turned back from reaching back up to the “Top Buckets” with strength for most of last week:

We immediately see signs of life in Grandma’s Pies after being in the doldrums for nine trading weeks:

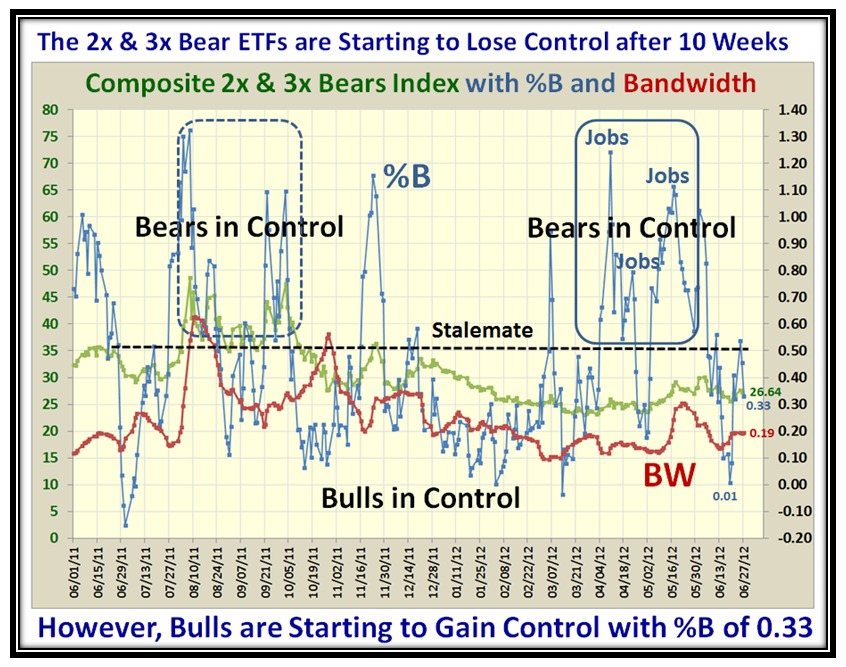
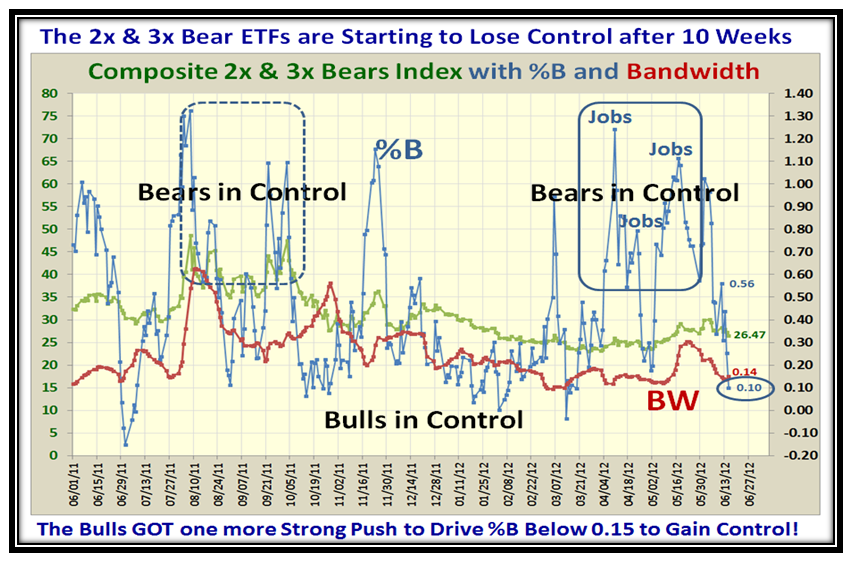
This next chart is a relatively new one which is proving to be worthwhile.  I have focused on the 2x and 3x Bear ETFs for the last few Blog Notes to gain insight for an early clue as to which way the wind is blowing.  As you would expect, when the news is in favor of the Bears as it has been recently with four bad jobs reports in as many months, the %B spikes into High Ground Territory.  Conversely, when the Bulls are in control, %B for these ETFs drops BELOW the Bandwidth, and there it is shown ringed after Friday’s action:

Unless there  is a major negative surprise, the picture suggests that the Market will remain positive with %B holding below the Bandwidth red line for a while.  Below we have the twin picture that shows the Bears have lost ground with two days in the red:

Well that’s it for now as I turn my full attention to the U.S. Open where Tiger has faded and all my US and International golf friends are glued to the screen cheering on their respective favorites to win.

Best Regards,

Ian.


Stock Market: Stalemate with Slight Edge to Bulls

Sunday, June 10th, 2012

The Stock Market is neither Fish nor Fowl, waddling back and forth this past month with 12 Days down, 6 Days up, 3 Days down and 5 Days up so far…Only nimble Traders who are quick to turn on a dime may make money in this Market.

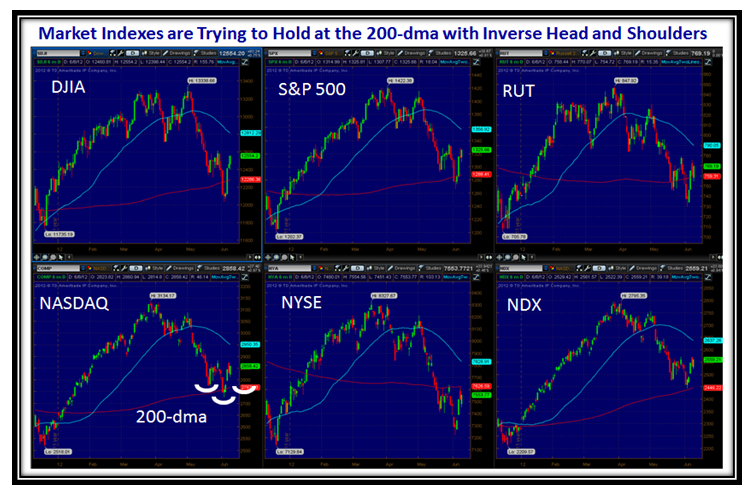
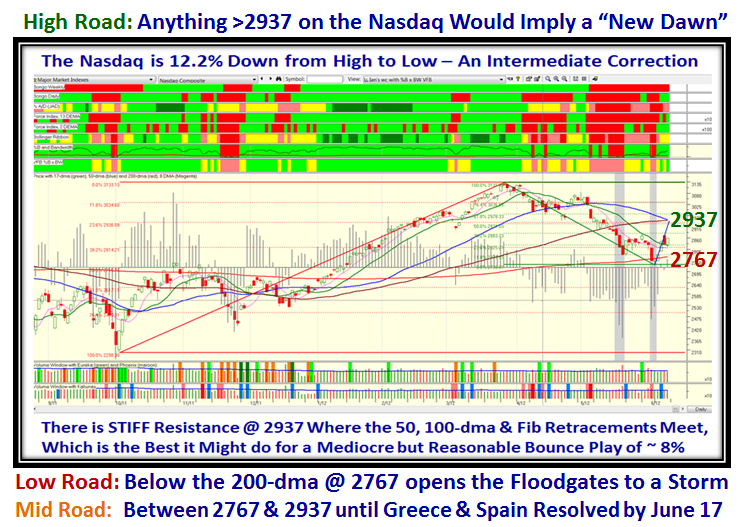
The Market Indexes are on a Cliff Edge waiting for either good or bad news…primarily from Europe this week with both Spain and Greece to contend with.  The Indexes are trying desperately to hold around the 200-dma with Inverse Head and Shoulders patterns to form before the hope is a New Dawning with a decent rally.
The Bulls cannot get too excited as seen by the next Chart.  Even if the Nasdaq breaks back up above the 2900 mark, there is stiff resistance where the 50 and 100-dma Moving Averages are joined by the respective Fibonacci Retracements at 2937, just a mere 8% up from the recent low…nothing to crow about!

The High, Middle and Low Road Scenarios are shown below:
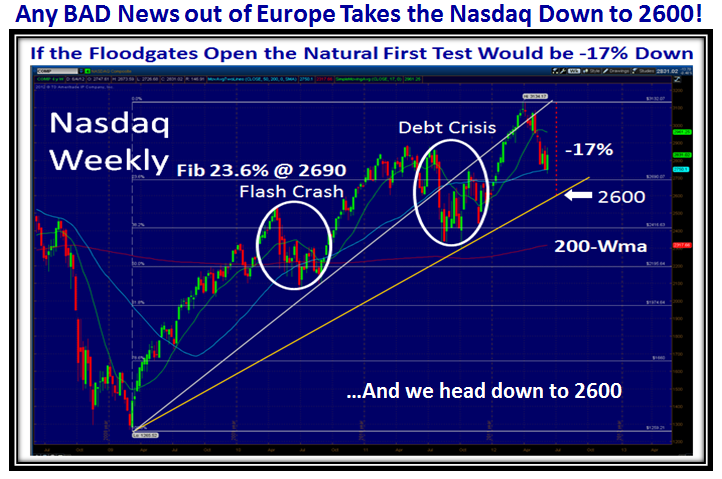
I note that my new found Taiwanese Friends are enjoying the blog this weekend and leading the Worldwide audience, and hopefully appreciating how to get to what matters in terms of knowing which way the wind is blowing here in the United States of America.  They know full well that with at least two black clouds over our heads from Greece and Spain, any whiff of Bad News will open the floodgates downwards and send the Nasdaq towards 2600 for a -17% drop from its high as we had in Flash Crash and Debt Crisis days:
Last week I gave you the Game Plan for AAPL, and so far it is behaving well and according to Plan.  This week we need to see it break up through the 50-dma and then head for at least a double-top at 644:

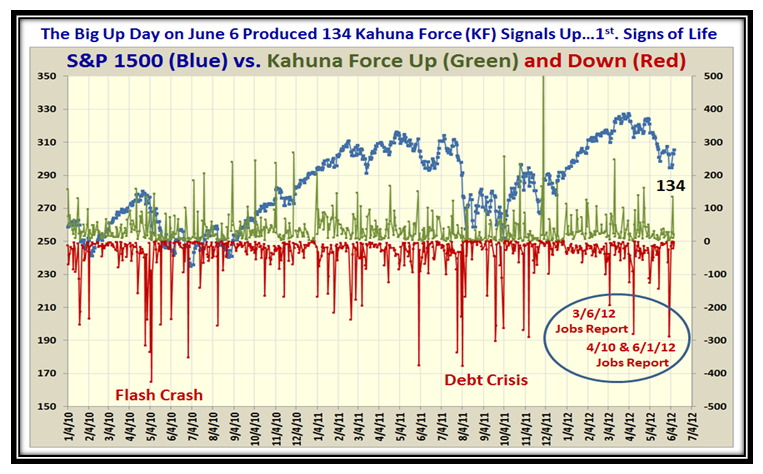
The count in Trading Days up and down tells you how treacherous this market has been the last month, but there seems to be signs of life to the upside these past 5 days with hopefully a follow through day to come:
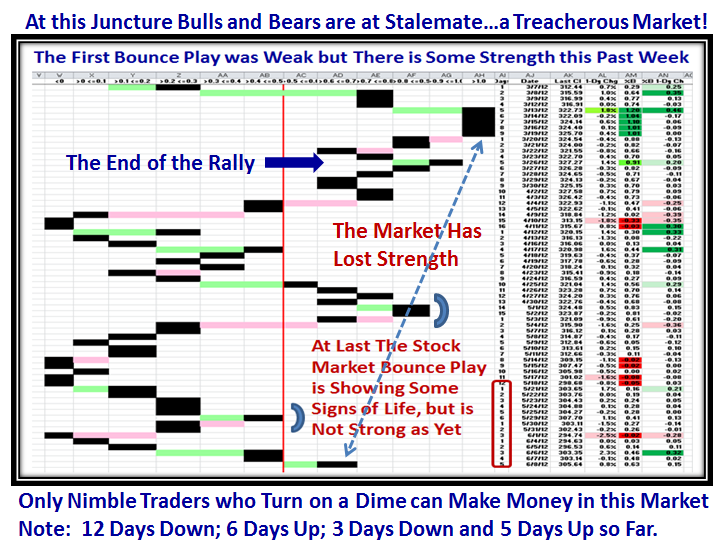
At long last we see some signs of life in the movement to the right of the Stocks into the green buckets.
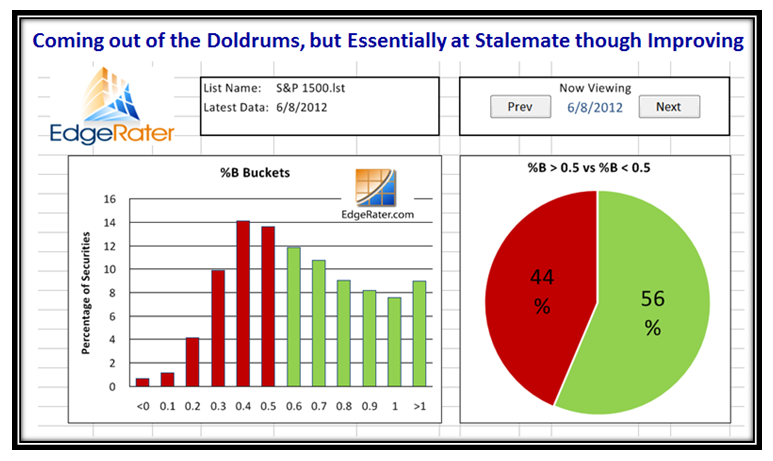
…And on that strong up day on last Thursday we have a healthy 134 Kahuna Force Stocks UP showing signs of life:
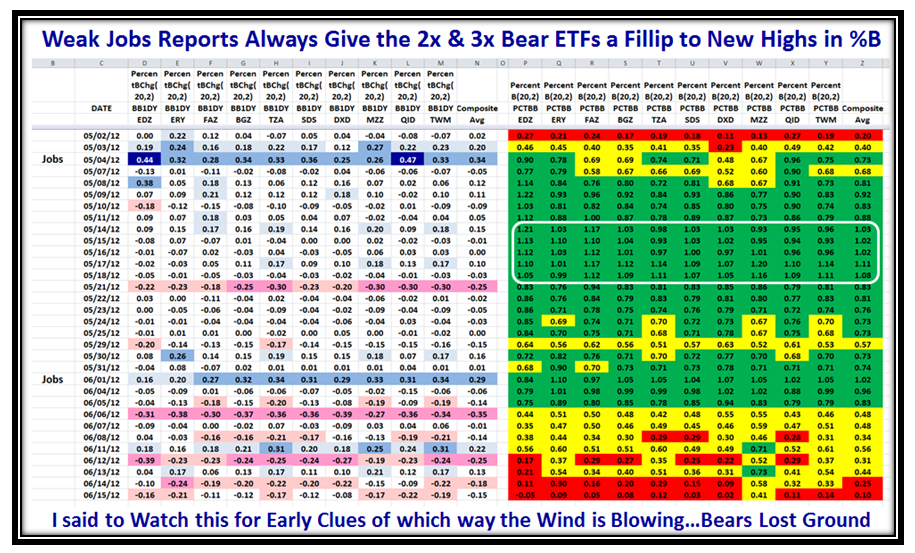
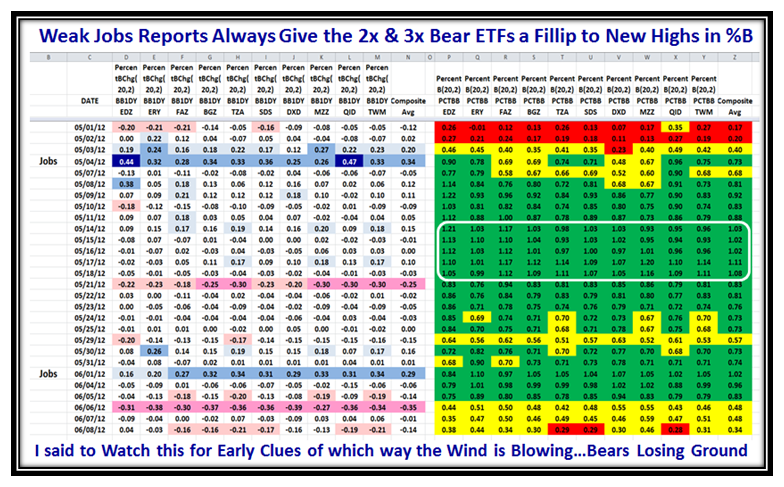
This week we see the 2x and 3x Bear ETFs losing ground with three in the red zone as shown on the bottom right:
Here’s another view showing the 2x and 3x Bears have lost ground.  We have another three weeks of breathing room before we see the next Jobs Report on July 5th.
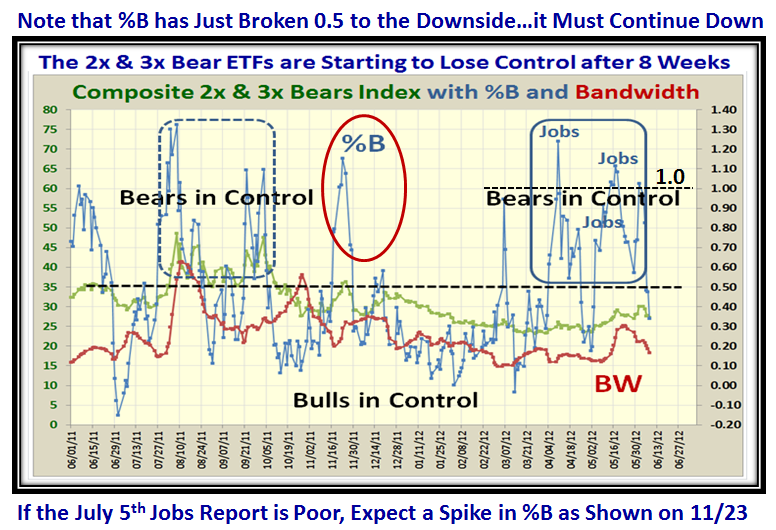
…And that’s my Story for this Week!

Best Regards,

Ian

Copyright © 2007-2010 Ian Woodward
Disclaimer: Commentaries on this Blog are not to be construed as recommendations to buy or sell the market and/or specific securites. The consumer of the information is responsible for their own investment decisions.