Market has Spoken on Kicking the Can Down the Road
Wednesday, August 3rd, 2011Those of you who follow my blog faithfully know that I never discuss politics here, or in our newsletter, or in the seminars…this is an investing blog not a political one. However, you also know that trying to understand the IMPLICATIONS of political actions relative to the stock market next actions is important. It is with that in mind that I write this blog, but as I have always said “Have three scenarios, and then let the Market tell you which one it is on.”
Dr. Jeffrey Scott is holding an HGSI Webinar tonight and I am sure there will be much discussion on how to use the tools to look for any clues of which way the wind is blowing, so this blog note written in haste will present more questions than it will provide answers! Once the dust settles, I will continue to provide the three Scenarios, but for now there are no Highland Flings in sight for the bulls!
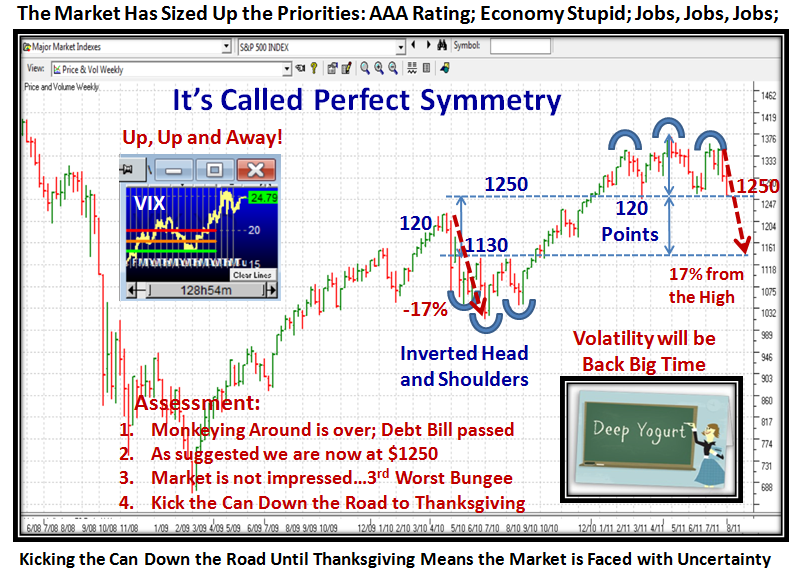
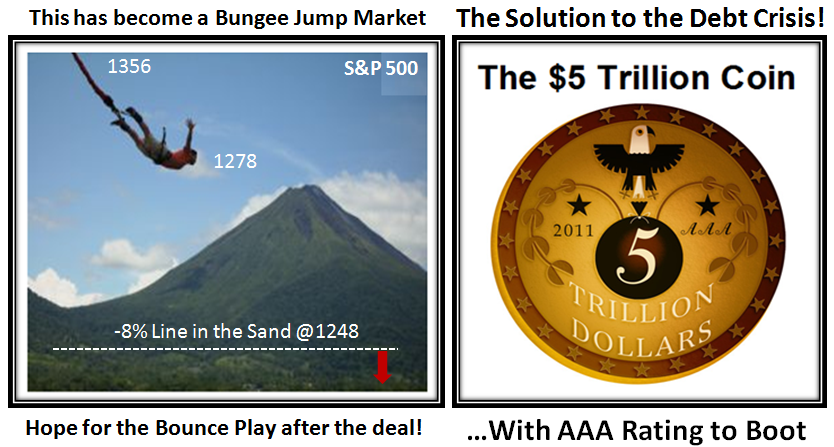
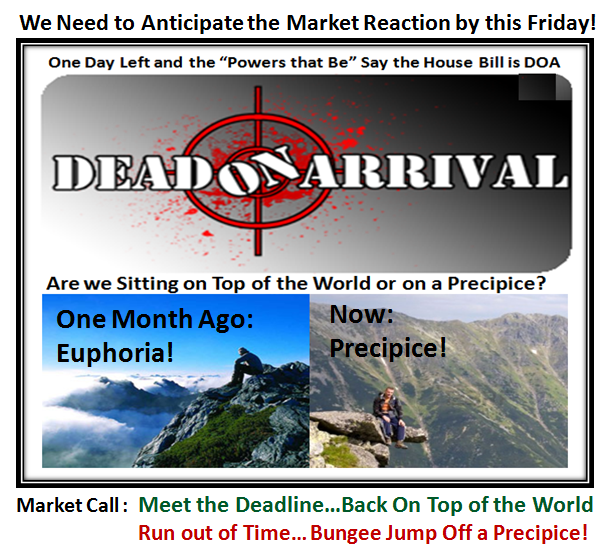
Yes of course we should expect a Bounce Play from an oversold market, but right now the market is in deep yogurt as my good friend David Galardi reminds me with this picture which he sent me:
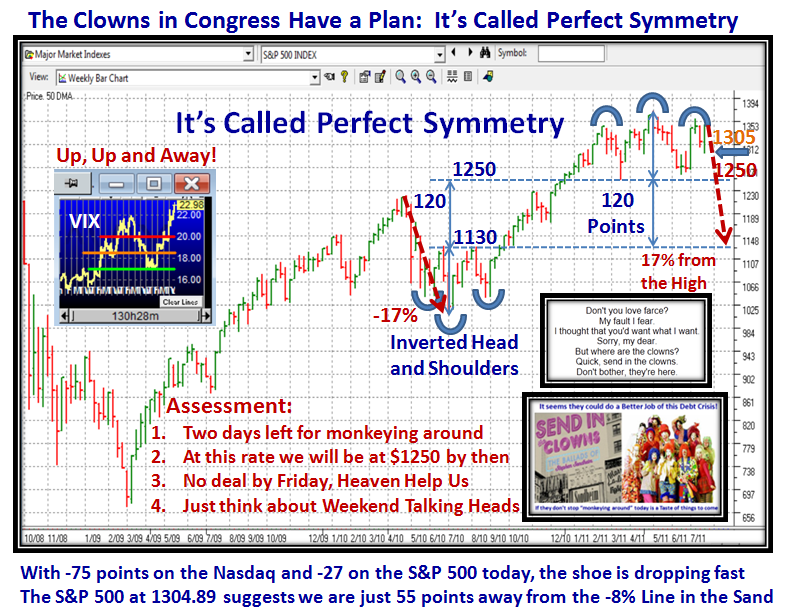
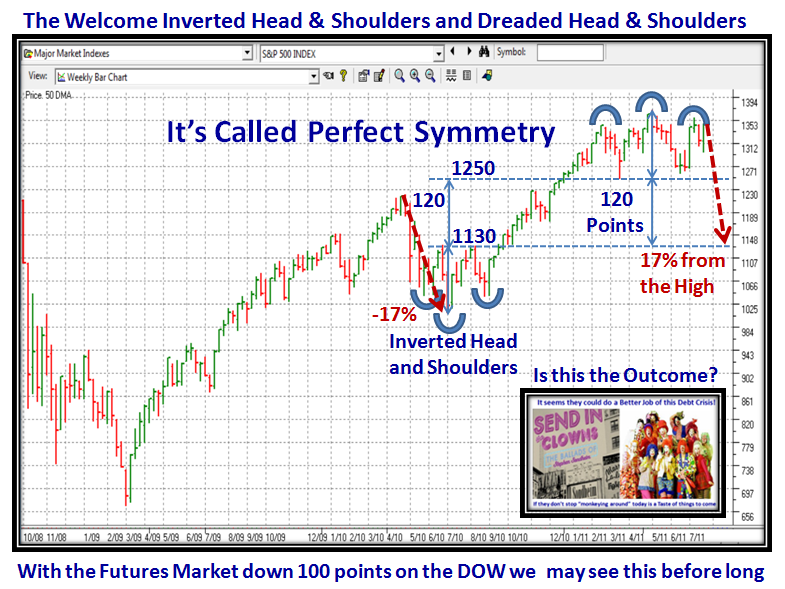
To continue the thread of the last few blog notes, here is the updated picture of the “Perfect Symmetry” chart, and at least the first suggestion I made that we were headed for 1250 on the S&P 500 has come and gone. Now the $64 question is whether we get the Bounce here or continue on down to hit Flash Crash proportions of a 17% correction as the natural next line of support to complete the symmetry:
By the way, please digest the updated lines at the top and bottom and my Assessment which are all on this chart for posterity sake. The last line finishes with “Uncertainty”. Uncertainty begets Volatility. The Grinch will be back in full force sooner rather than later. But always let the market be our guide as to which road it is on. There is a distinction between short-term Type 1&2 traders and longer time Type 3&4, and that is what must be kept in mind as we digest and search every nook and cranny for clues of which way the wind is blowing. “When it’s at your back, Attack; when it’s in your face, Disgrace.”…but that is exactly what the moment traders are good at.
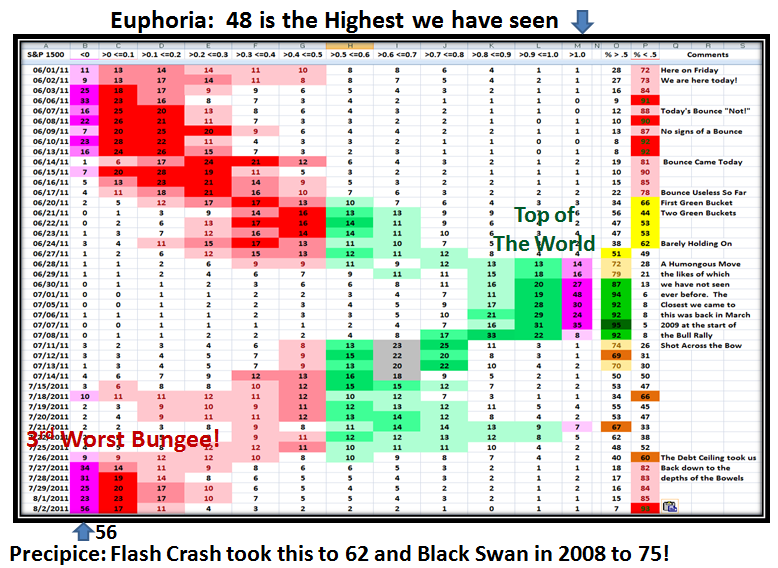
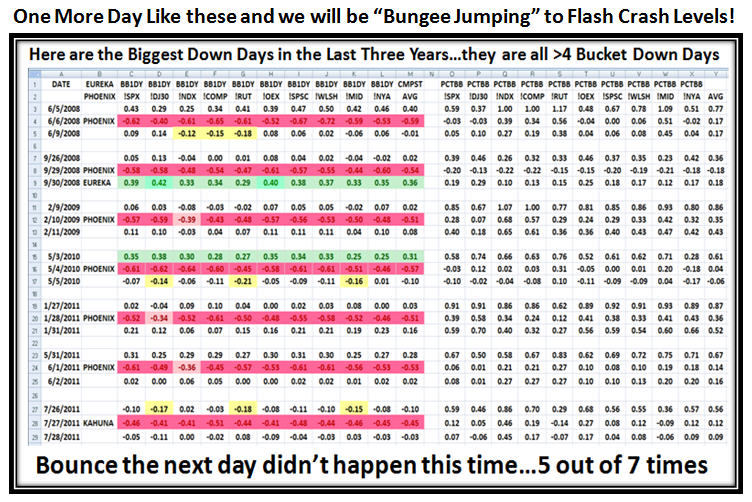
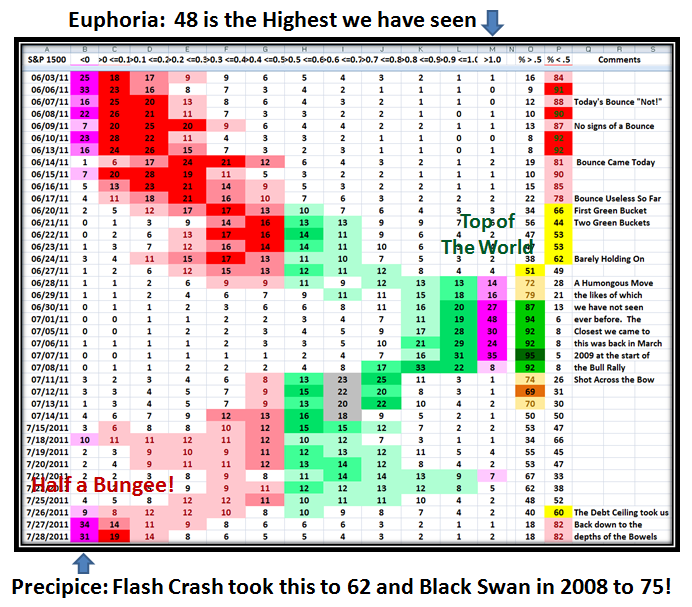
Would you believe it, the Bounce Play has already begun while I am at this point in writing the note, 10.40 am PST…well that is no surprise. But let me not digress and show you for the record that the oversold situation in Bucketology Terms has delivered the 3rd Worst Bungee jump we have recorded, with only the Flash Crash and Black Swan era being deeper, as shown on this next chart:
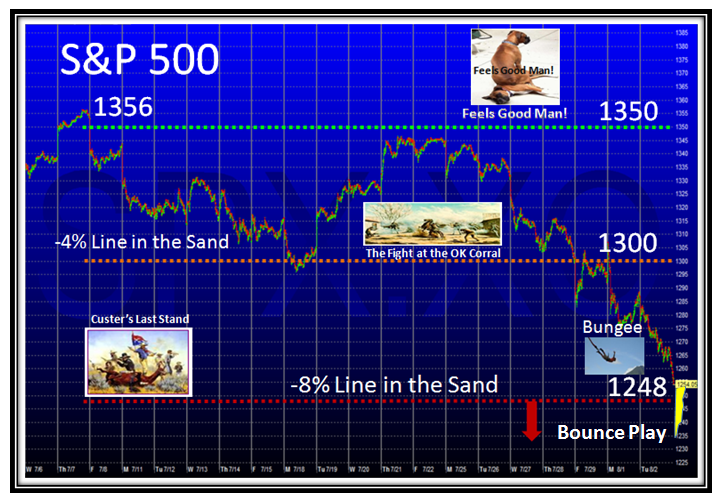
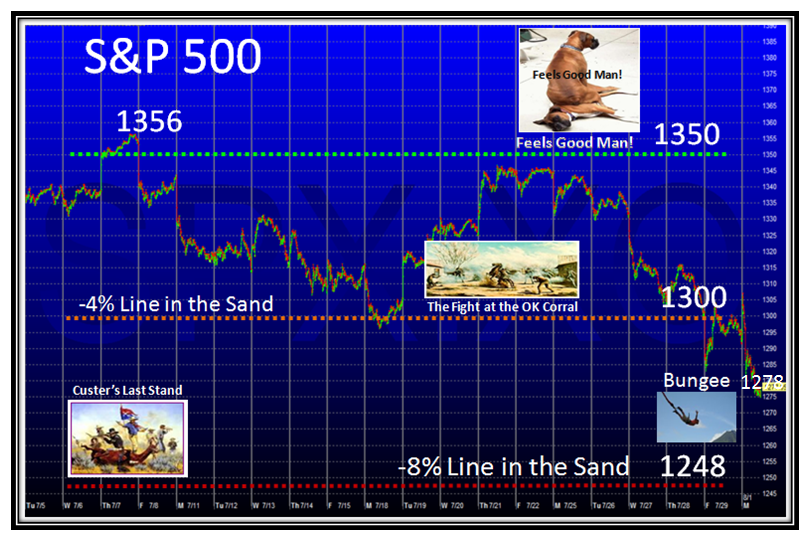
The next slide is the “Custer’s Last Stand’ and “Feels Good Man” Slide which my readers get a kick out of, especially the latter which my good friends Chris Wilson, Dave Baratto and Maynard Burstein always say they enjoy. A heads up to them too as they all get together for their monthly meeting lead by Maynard in San Antonio, tonight.
True to form, this is out of date as I prepared it last night, but note that it broke the -8% Line in the Sand today dropping to 1235, and as one could expect, the Bounce Play was on. I just updated it in yellow for the Bounce that is now in progress. Now its simple to measure the quality of the Bounce and where to expect the “Fakey”! 1300 gets us back to the -4% Line and is the fight at the OK Corral, and don’t hold your breath for 1350 to “Feel Good Man”. Always have THREE SCENARIOS and let the market tell you which one it is on:
Now comes the “Coulda, Shoulda, Woulda” second guessing with ants in your pants for type 3’s and 4’s. I’ve just shown you where to expect a Fakey, but of course if you want to play like a Type 1, then the longer you wait the more you get left at the post.
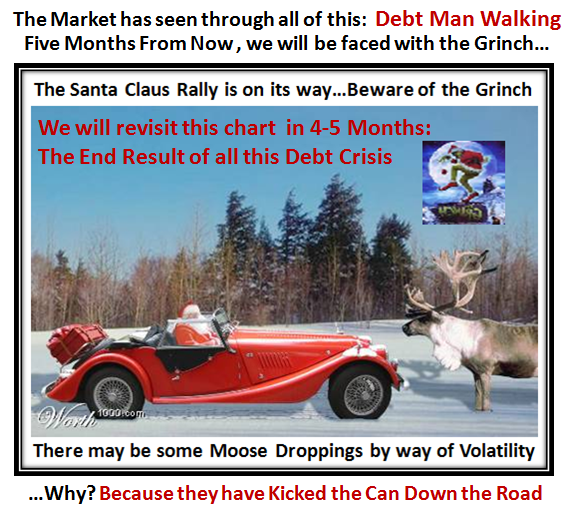
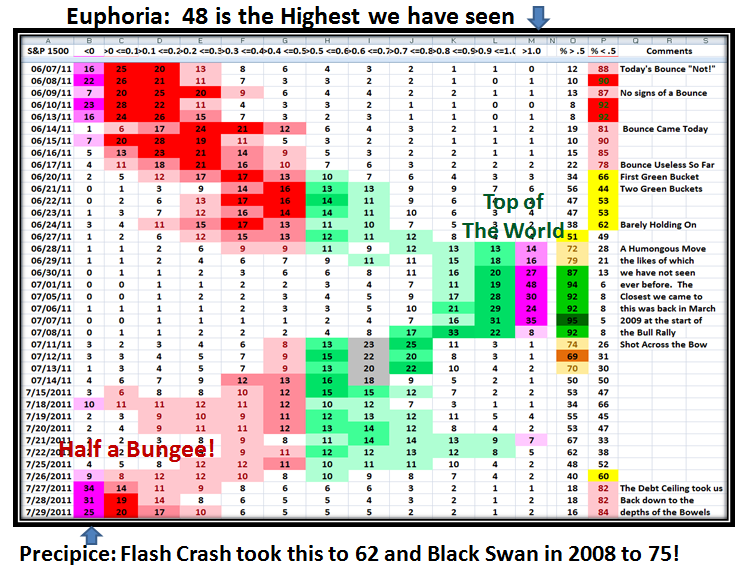
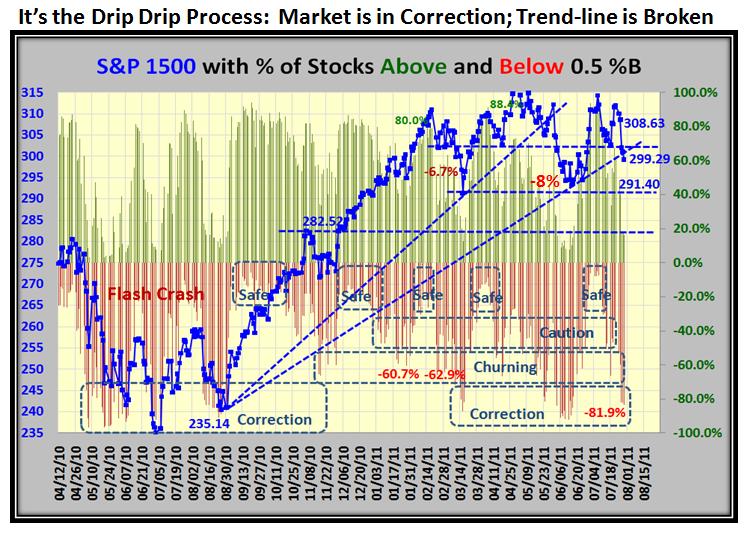
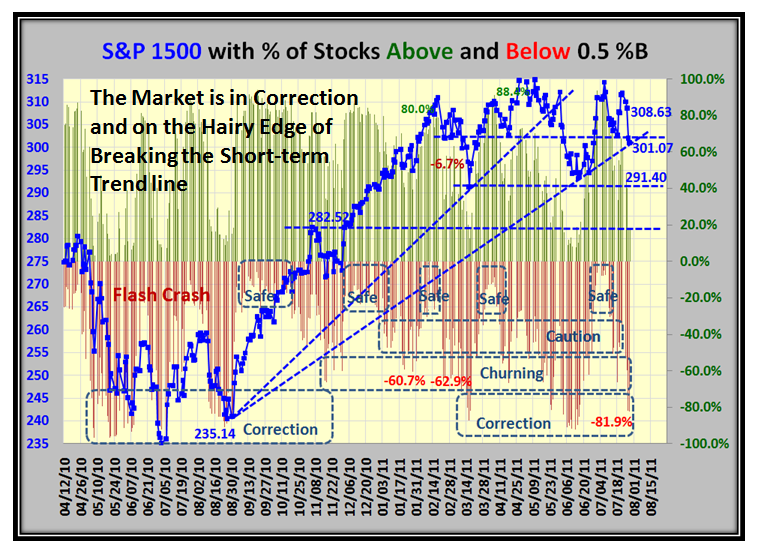
However, my mind is not on this short term mumbo jumbo right now. Rather I want to leave you with two old pictures which are most appropriate at this writing. They both go back to the gloom and doom era of Black Swan, but I submit that they are worth tucking in the back of your mind for when we get around to Thanksgiving time and the Volatility we can expect from the uncertainty that the recent actions have caused to the Market.
As you well know, I am a Glass Half Full Type but I have always given you fair warning of the other side of the coin, so in the spirit of leaving you with how that scenario can develop over the next six months, here are the two slides with no further commentary other than to mention that David Galardi reminded me of the second one:
Good Luck to you all, and may the Kahuna Force be with you whatever you decide.
Best Regards, Ian.
 Ian Woodward's Investing Blog
