Ian Woodward's Investing Blog

Archive for the ‘Market Analysis’ Category

Stock Market Rally – Days are Numbered

Sunday, April 18th, 2010

I am a little pushed for time so I will fall back on snippets of a Running Commentary with my friend and Seminar Attendee, Hsin, and others over the last three days.  We also covered this at yesterday’s Monthly HGS Investor Meeting, so all are up to speed.

Wednesday, 14th April, 2010

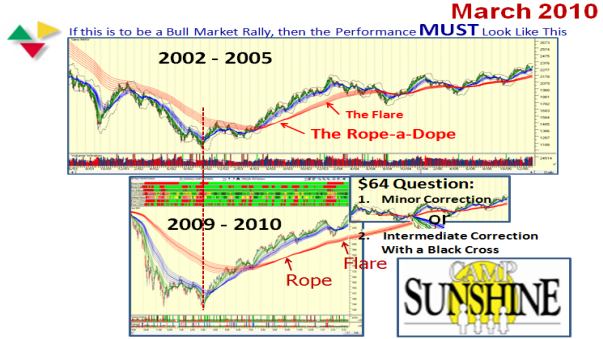
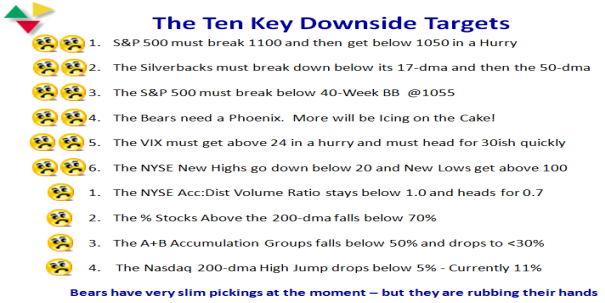
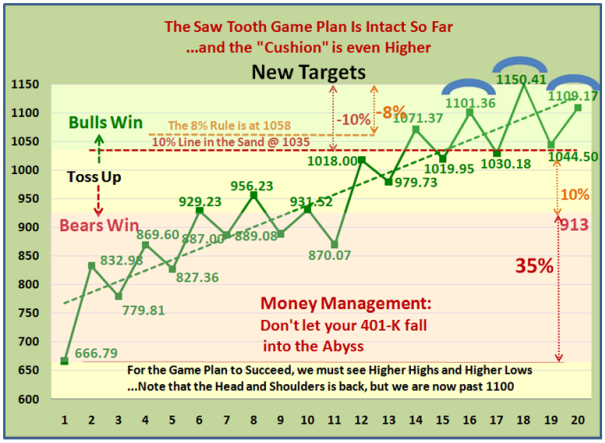
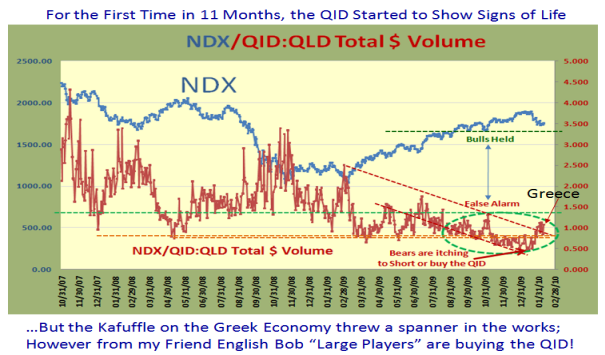
When you start rubbing your hands with glee, for sure that is the time when the Market is nearing a top:

pic

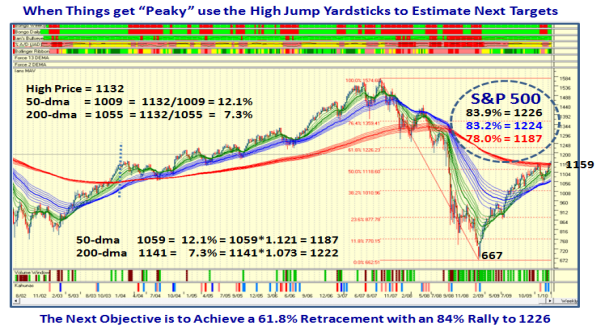
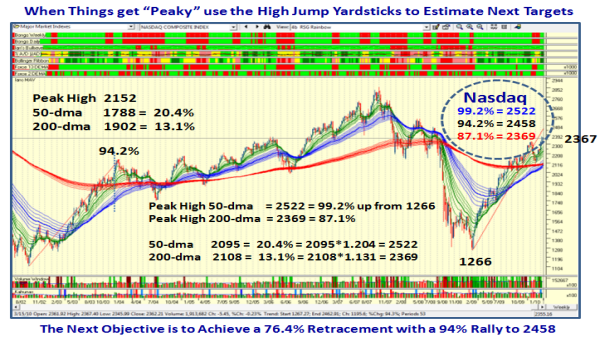
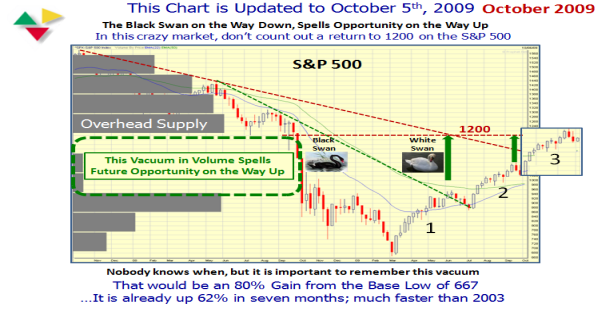
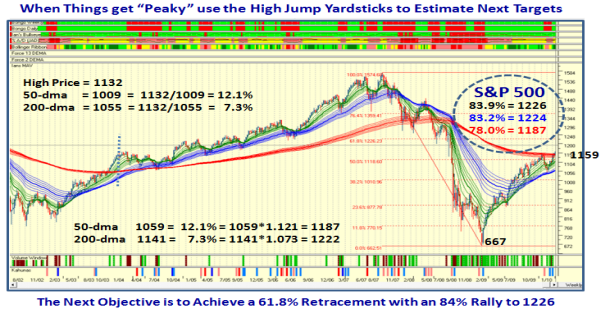
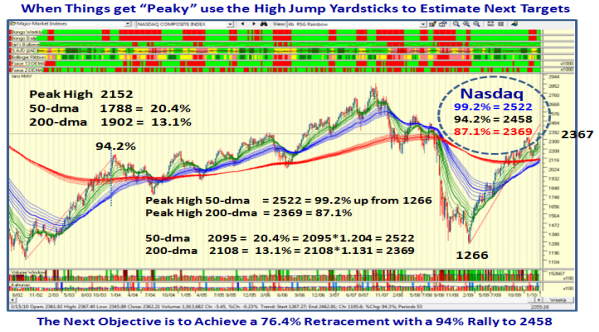
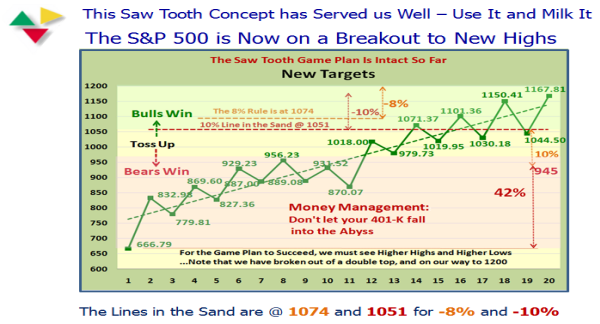
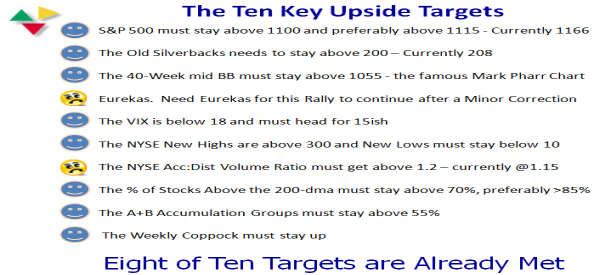
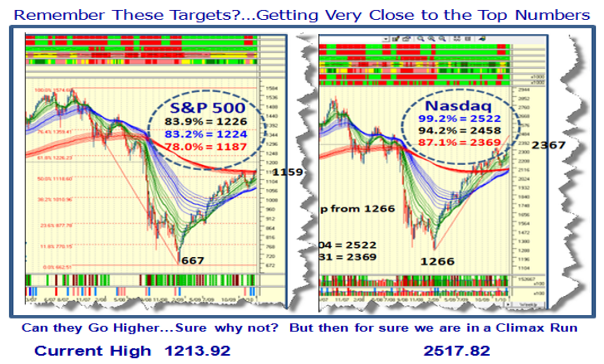
Recall the Targets I gave you at the seminar and have since posted twice on the blog…it suggests we are very close to the top for now:

targets

Now the $64 question is when will this beast give a Climax Run?  The answer is very soon, and I am claiming that some form of correction is due within a week to ten days.  We shall see, as you well know nobody knows for sure.  But why do I even suggest that?

ss

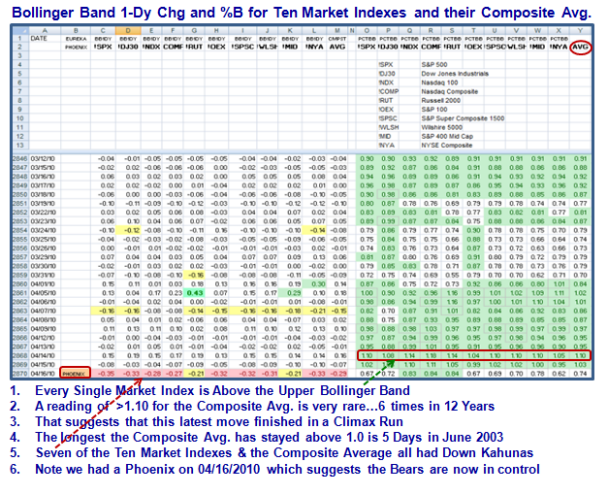
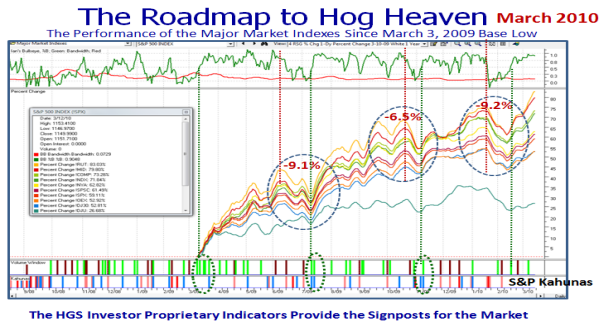
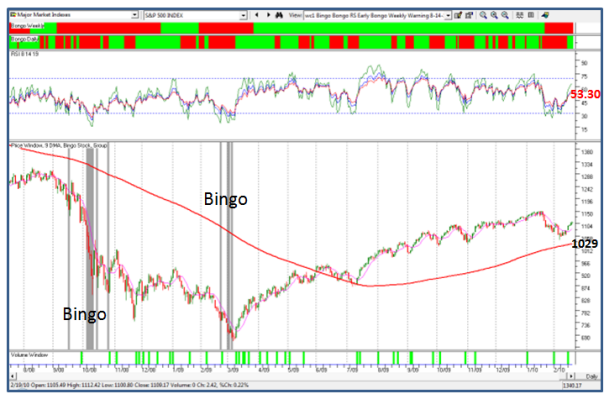
Hsin, you now have eyes in the back of your head…just look at the  chart above and you will see from my notes why we are in VERY RARE Territory.  There are only six other times in 12 years that the COMPOSITE AVERAGE of %B of the Bollinger Bands of all ten Market Indexes have been above 1.1.  I go on to give you additional statistics on that slide so enjoy before I put up my blog hopefully this weekend.  Only back in June 2003 did the Composite of these ten Mkt Indexes stay ABOVE the Upper Band for five days before they began to drop. 

 We have no way of knowing when the break will happen and there are many other things you should watch to see if they are breaking down, none the least of which is the JIRM Index…it will be one of the earliest clues.

The Three Scenarios:

1.  A SURPRISE Knee Jerk down which will cause an obvious deterioration that all will see quickly
2.  A Climax Run which will surpass the Targets I show on the 3rd chart…give it a few more strong UPSIDE days
3.  A gradual fading of the rise with a correction that either gains steam or is minor and the rally goes again.

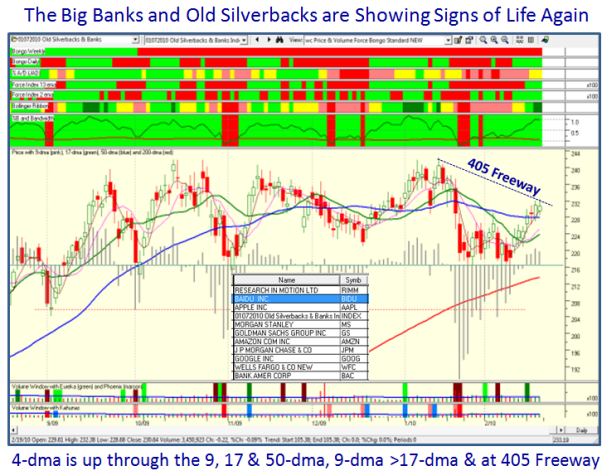
Don’t be TOO Eager to switch to the Short Side TOO FAST, is my next suggestion to you.  The stock Market is not a Black or White, on-off switch, flip-flop, call it whatever fits your fancy…especially at the top.  There are shades of Gray that you have to watch for very carefully.  After all, what caused this sudden additional recent euphoria…INTC and JPM, Technology and Big Banks firing on the same day.  Days like that don’t get turned off quickly.  So make sure to keep an eye on the Old Silverbacks and Top Banks list plus the additional obvious ones you added such as CREE, NFLX, ISRG, PCLN, BUCY and PRGO, etc. etc. If you have to pick one stock of all to watch it should be CREE, why?…because it has given us >16% since the Seminar and is double all the rest.  Late Breaking News:  Note that they hammered GOOG after hours.

Good Luck,  Ian.

Friday Night, April 16th, 2010

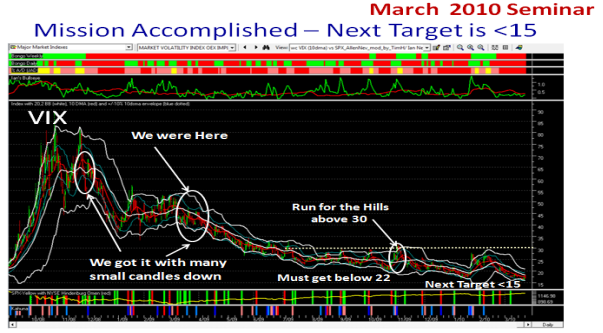
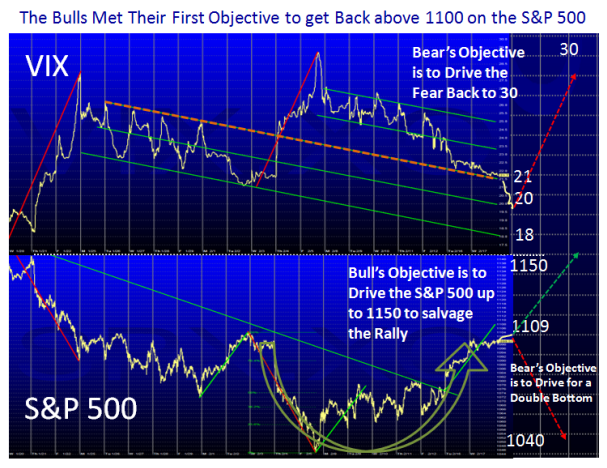
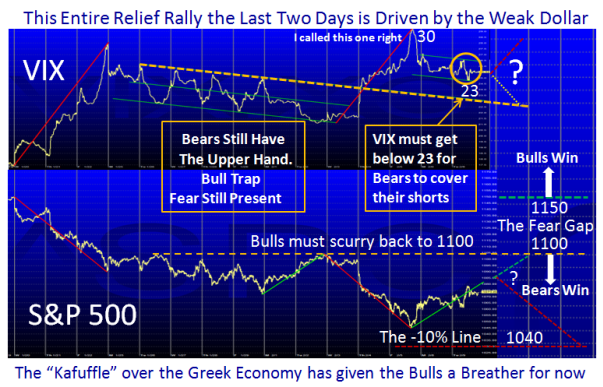
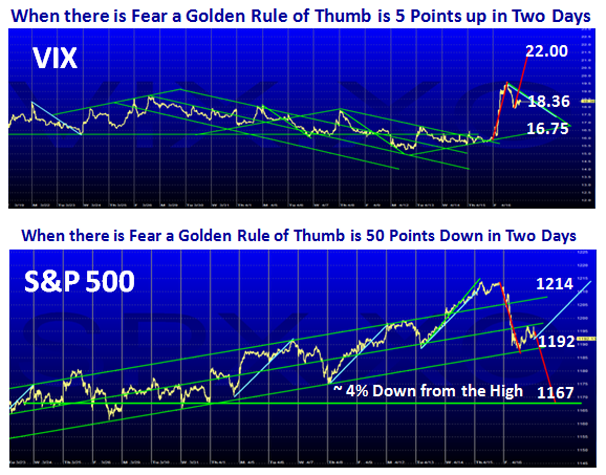
Well Hsin:  Scenario #1 worked today so no need to look further after all that anticipation.  But at least we knew we were close to the top, which again was pretty obvious, so no cigar!  Since it is also Options Expiration day, we should be patient and see where they close this beast. The cigar comes with what happens next? 

Either the VIX drives up another 3 points to 22ish and the S&P 500 goes down another 25 points (as I gave you GOLDEN Rules previously) and the party is over, or the Bulls come charging in to buy, buy, buy.  With something as serious as GS Fraud charges, I suspect it will be the former.  The floodgates open up below 1165 on the S&P 500, and will have wiped out the last 20 days gains.

vix

In any event you now have the tools to tell you which way the wind is blowing…JIRM (an acronym named after four people at the seminar) is blood red today with all stocks negative at -2.37% down as I write.

jirm 

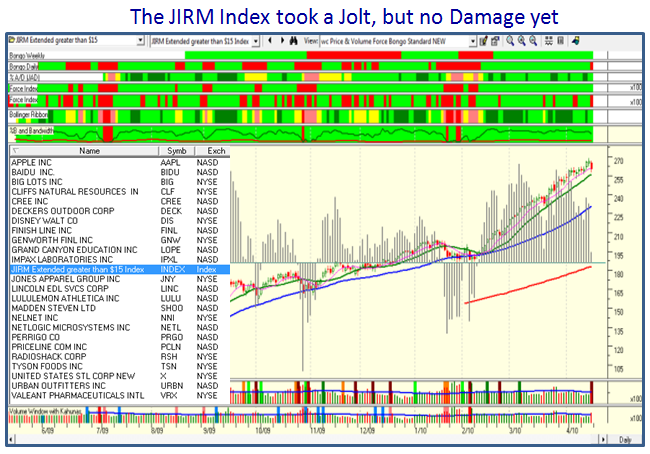
Six stocks are already under water since we made the list, and another day like today will net another five or six to zero or negative gain.  That spells half the leaders if that were to happen.  That’s all you need to look for…period.  Then the cigar comes with what happens after that.  I will wait on your thesis!

Best Regards, Ian.

Stock Market: How High is Higher?

Tuesday, April 6th, 2010

When things get “Peaky”, turn to the High Jump Tool I have taught you to use time and time again.  Just type in “High Jump” in the Search window of this blog and you will see how I have used it previously with success.

       moon

I just gave you two snapshots in my last blog of the Rainbow Charts using the High Jump parameters from 2003 as a guide.  Here they are to refresh your memory:

s and p

nasdaq

You will note that in the last week, we have now risen above the 1187 target on the S&P 500 and  reaching for the 2458 Target on the Nasdaq.  So now is the time to refine the Targets.  So to cap it off, here is a simple rule of thumb to use for a quick estimate for how high is higher:

Use 8% above the 50-dma and you have a good feel for what is the next level.

 If you don’t believe me, use the “7a High Jump Individual Lines” View in the HGSI Charting Module Software and you are there:

high

The premise is that this Market is headed into a Climax Run and 8% is the next logical level.  Let’s get past 8% before we think of Supreme Greed setting in at 10%, but for your convenience here are both numbers:

% above 50-dma     8%     10%       Today 4/6/2010

S&P 500                 1212    1234              1189.44

Nasdaq                   2463    2509              2436.81

DOW                     11287   11496            10969.99    

The Bottom Line Message is that one or two more 1% to 2% up days and the Market will have met these Targets.  Also, the VIX is now down to 16.50 or so, and it won’t be long before it seeks 15ish if the market keeps rising.  Options Expiration is on Friday the 16th. of April, and Earnings Reports will begin in full force the following week for three weeks.  Sooner or later expect the fireworks to start.  To be forewarned is forearmed, but nothing has cracked yet.

Enjoy…Ian.

Stock Market Key Upside & Downside Targets

Tuesday, March 30th, 2010

I am sure you all know by now that we had a very fruitful HGS Seminar and a good time was had by all.  The overall mood was Happy Days are Here Again, but stay light on your feet as things are getting Peaky!

christina

To kill two birds with one stone this note will summarize the presentation I made in 12 slides and hopefully give some sollace to those who did not attend of what they missed.  Also for my newbie blog friends I show the power of the product in slicing and dicing the market in several ways and urge them to try the HGSI Software with a free sixty day trial, which they can register for on the top right hand corner of this blog site.

The single most effective slide that shows the power of the product’s strength is its proprietary Indicators as shown in this next slide.  Now that we have a year’s worth of this booming rally, a picture is worth a thousand words to show that power:

hog

Many moons ago I gave you a winky-winky that the Black Swan we had in late 2008 would produce a White Swan opportunity in that there was a Volume Vacuum in coming back on the return path as shown below:

swan

The good news is that we are almost there…the bad news is that we now begin to hit Overhead Supply.

The Camp Sunshine High Road Scenario suggests that IF the Rally is to continue we should expect to reach 1225 & 2450 say on the S&P 500 and the Nasdaq, respectively, before these Indexes are extremely extended.  The next two charts show the rationale by using both the Rainbow and High Jump Extension to guide us:

sandp

nasdaq

At the October Seminar and on this blog I showed you how the Rainbow Chart must first give us a tight Rope and then Flare out to demonstrate extension, as shown below:

rope

That extension happened these past three months as shown in the next chart and now helps us to establish two scenarios from here:

1.  Do we suffer a Minor Correction of 8 to 10% or

2.  Do we have an Intermediate Correction with the strong possiblity of a Black Cross as shown in the  next chart:

extension

The Trusty Saw Tooth Plan gives the Longer Term Type 3 & 4 guidelines of the Lines in the Sand for an 8% and a 10% Correction and also shows that anything below 1040 would bring into serious question of whether the Party is over for now.

saw

Those who regularly follow my prognostications on the VIX will immediately recognize this chart and understand that the next Target for the Bulls is 15, and for the Bears is back to 30. It is currently at 17.26:

vix

Now let’s turn to the Gloom and Doom Camp…they have had mighty slim pickings of late but are waiting patiently for their day to come, after many false alarms where they have been so bitten that they are not showing their true fangs AS YET!  In this next chart which uses an excellent depiction at the dshort.com website (they do give permission to use their charts provided we give them credit which I am doing), we can immediately see that they expect another big fall based on past models of Mega-Bear Markets:

mega

HGS Seminar Attendees always get my usual reminder that the second year of a Presidential Cycle is the Worst Year for Bear Markets, so to be forewarned is to be forearmed:

prez

Last but not least here are the familiar happy and glum faces for you to enjoy on the Upside and Downside Targets for the immediate future:

upside

downside

As always, there was one MAJOR Nugget that attendees got at the Seminar which was worth the second million they are about to send me since they are well on the way to making it.  I gave Newsletter Users a glimpse of what they would see and I will leave the attendees to say whether it was worth it all.   As they walked out the door, I was glad that they all felt Ron and I had raised the bar one more time.  This time they have a Golden Nugget for both the Upside and the Downside Scenarios when the “Moon is in the Seventh House and Jupiter aligns with Mars using Bullseye along with Eureka, Phoenix and the Kahunas.” This time they went away with a lock on the Fifth Dimensions song of 1969…time flies when you are having fun.

jupiter

Best Regards, Ian.

Stock Market – Bears are Hungry and Prowling

Sunday, February 21st, 2010

This last couple of weeks has been a “turn-up for the books” in that the Bears had the Stock Market in its teeth when the Greek Economy situation blew up in the Euro’s face and the Dollar has been gushing forth in no uncertain terms.  Likewise the Fed raised the discount rate to everybody’s surprise but the Stock Market brushed that aside, and we have recovered 61% of the drop we had a few weeks ago.  Net-net, we have a Fledgling, albeit shaky White Swan but make no mistake the Bears are Hungry and Prowling.

prowling

The net result is that we have had a little over a -9% Correction in the S&P 500, but have recovered to the 1109 mark and is now sitting with a Head and Shoulders pattern.  The Saw Tooth Game Plan which has served us royally for these past 11 months is back in full swing so the bottom line is that we either drive back up to the high at 1150 or fall back to re-test the low at 1040 for a double bottom to start with.

saw

Continuing the theme of the VIX vs the S&P 500 which you seem to enjoy, the Bears had driven the fear factor back up to its customary 30 level with a 10 point swing up in two days for two separate occasions, but could not drive the nail in the coffin of the rally when it was on the ropes.  The Bulls have trundled back in a tepid sort of way, but when all is said and done the Market seems to have weathered the storm for now and they are intent on driving back to the recent high at 1150.  We shall see what transpires in the coming weeks.

vix

We came within a hair’s breadth of a Bingo signal…Oh! so you have forgotten about the Bingo!  A Bingo is an RSI 19 with a reading of 33.50 on the NYSE, which can signify one of two conditions:

1. It either signifies that we have reached an oversold situation in the course of a correction particularly if it is followed by the ever faithful Eureka which says the Bulls are buying with some exuberance, and better yet when we have two Eurekas within a week which says “Loud Cheers, we have irrational exuberance to the upside”, or

2.  It signifies the first of many more Bingo signals and therefore corrections to come which kills the rally, and drives the Market into a deeper Intermediate Correction; certainly at least to retest the recent low for a double bottom, or worse yet to finish up with a sizable correction of 12% or more.

bingo

You will note that the 200-dma is conveniently providing support at 1029 on the S&P 500 at this time so should there be more trouble to come, that is the last vestige of support for the Bulls before the rot sets in.  You can also see that the current reading of the RSI-19 Period is at 53.30 so we have a cushion with ample warning before we hit a Bingo at 33.50.

As I mentioned earlier the problems with the so-called PIIGS Economies (Portugal, Ireland, Italy, Greece and Spain) threw a monkey wrench into the equation and as you can see the Dollar which had been weak for so long throughout the Stock Market rally, bottomed, and took off these last several weeks as shown below:

dollar

Meanwhile back at the Ranch, the bulk of the earnings reports are out and despite the decent Quarterly Gains in most of the stocks, the likes of the Technolgies and the Big Banks were hit severely.  I gave you a worthwhile Surrogate for the market a few blogs ago with the five old Silverbacks of AAPL, AMZN, BIDU, GOOG and RIMM, and the five Big Banks of BAC, GS, JPM, MS, and WFC, and I show below the composite picture of these ten stocks which like the stock market have done nothing since mid-September.

silver

Looking at the ugliness of that chart pattern would scare the pants off any Bull, but take heart, beauty is in the eyes of the beholder.  It is essential for me to give a balanced view so there are two obvious scenarios if you stare at the chart:

1.  The Index has retraced 61% back up and will turn down again to re-test its lows yet again.  The disappointment is that there has not been sufficient strength shown by way of the so-called Follow Through Day (FTD).  It is at the Upper Bollinger Band and must hold there or it is vulnerable to breaking down through the 50-dma one more time, therefore killing any of the promising fledgling rally.

2.  The Chart shows that this Index has Double Bottomed, the 4-dma is up through the 9, the 17 and 50-dma showing strength; more importantly, the 9-dma is up through the 17-dma and the Index itself is above the 50-dma.  Also note that all of this has happened because of the recent Eureka which fired four days ago.  It is poised at the down-trend-line from its highs, aka the famous 405 Freeway, and with one more Eureka it could drive up at least to reach the old high.  As my good friend Dave Baratto has reminded me recently, we need to think of the basics we learned so well in the Days of Wine and Roses, and this paragraph and picture says it all.  But then again, as my other good friend Aloha Mike Scott also attests to the Saturday Meeting findings where we concluded that there was mighty slim pickings of decent stocks, other than “Junk off the Bottom” (JOB) with great last two quarter earnings credentials, and beaten down recent warriors echoing the likes of the senior beasts I show you above.  You might take a leaf out of the White Goose’s book and watch AFLAC!  Good credentials.

So it is a puzzlement and we shall see what we shall see this coming week.  In any event, the Long Term Buy and Hold Type 4 Investors can take comfort from the fact that the Long-Term chart has held and turned up from the support area that I have preached should be watched intently:

type 4

Last but by no means least, the one internal that was hanging on by a thread was the % of stocks above the 200-dma which had fallen below 70%, but has recently risen back to a respectable 80%.

200

These are difficult times to invest with the INTRA-DAY skittishness that abounds with all the indexes.  Keep your powder dry and come to the seminar in 5 weeks time where you learn a whole new set of good stuff to keep you on the right side of the market, both short and long term!

Best regards, Ian.

The Greek Gods are Smiling on the Bulls!

Tuesday, February 9th, 2010

Just when the Bears had the Bulls on the ropes, up pop the Greek Gods to smile down on the Bulls and stop the rot that could have set in.  That does not mean that the danger of a further drop has evaporated, but until the problems with the various Eureopean Economies are settled including Portugal, Italy, Ireland, Greece and Spain there will be unsettled markets across the globe.

     picture

The Bull and Bear fight for turf can be summarized as follows:

1.  After a downturn from the high of close to 8%, the Market bounced for two days with a very tepid dead-cat bounce as I described in my last blog.

2.  This gave the Bears confidence that the 11 month rally had stalled and it was time to look to the short side and nibble at the QID, SDS, and other similar ETF’s.

3.  Having shot the VIX upto the famous 30 mark where we reached recent crossroads, low and behold the Euro/Dollar situation turned around with rumors that the Germans would bailout or at any rate assist the Greek Government with its Economic woes. 

4.  This led to a strong bounce today at the onset, with a precipitous drop in the dollar and resulted in a new relief rally for the Bulls who were literally on the ropes.

5.  As I show in the attached chart, the Bears still have the upper hand and we must wait to see what transpires these next three days with the long weekend ahead of us. 

vix

6.  Despite the decent rebound today, the Bulls must show courage to drive the S&P 500 Index to at least the 1100 mark, and that is only the beginning in trying to recover the internals of the Market which are now badly oversold on most fronts.

7.  The gauge of the Fear Factor would seem to be that the VIX must subside to below 23 before there would be short covering by the Bears, who have the ball at present. 

8.  The QID has risen from the ashes and is stirring slowly; it had a set back today:

qid

I trust you are all using the wc chart to spy the rotation that is taking place and what better way to see it than to look at the QID (and SDS, which have identical patterns):

hgsi

If the market continues to go down, the winky winky is not to forget to watch out for a Bingo to see some form of Capitulation.  In a Market Rally with a Minor Correction you will watch for a single Bingo followed very quickly by an Eureka (or the more the merrier) for a renewal of the rally.  However, in an Intermediate or Major Correction, expect several Bingos and Phoenix before there is exhaustion to the downside.  We came within a hair’s breadth of a Bingo yesterday on the NYSE, until the RSI 19 was driven back to over 40.5 today…so no cigar. 

Remember that the -8% mark is at 1058 & -10% is at 1040 for the S&P 500. 

Now you all know what to look for until I write the Newsletter this weekend!

Best Regards, Ian.

Copyright © 2007-2010 Ian Woodward
Disclaimer: Commentaries on this Blog are not to be construed as recommendations to buy or sell the market and/or specific securites. The consumer of the information is responsible for their own investment decisions.