Ian Woodward's Investing Blog

Archive for the ‘Market Analysis’ Category

Bears Opened the VIX Floodgates above 25

Thursday, February 4th, 2010

It had to happen sooner or later – the Bears had a field day today and clobbered the Market Indexes.  This could well be the end of the 11 month rally, but we will have to see what tomorrow brings. 

   cat

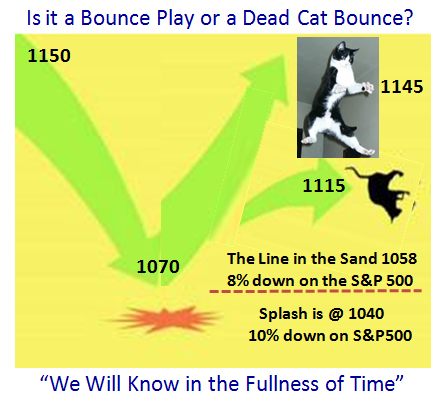
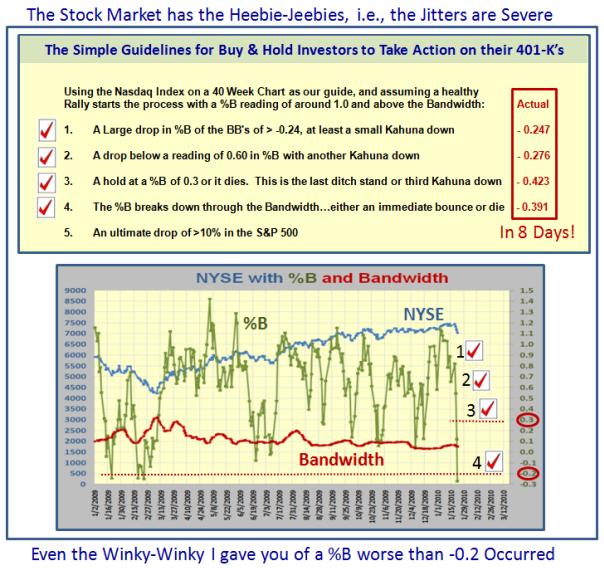
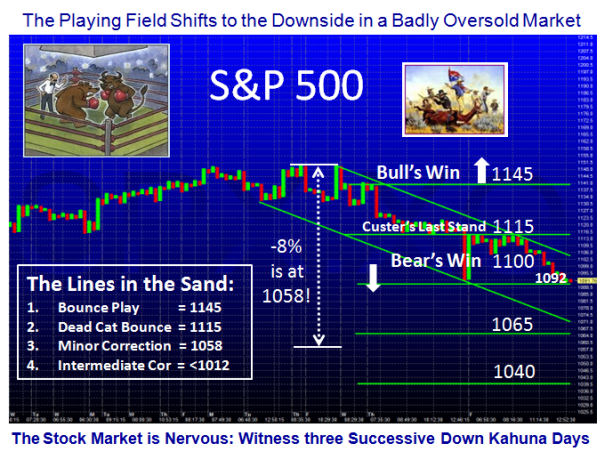
 The S&P 500 finished at 1063.11 and is only a meager 5 points away from an 8% Correction.  Assuming we drop below that tomorrow, the next target is 10% which would take us down to 1040.  A decent clean out has been expected for months, and the Bears have waited patiently for the true signs that they have the upper hand. 

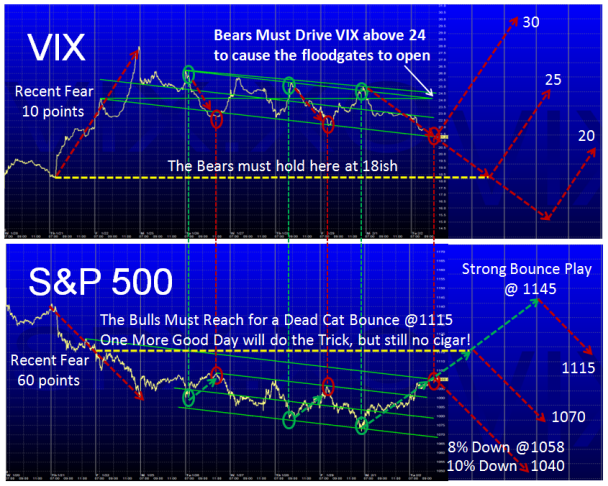
We have gained a lot of useful information regarding the behavior of the VIX and the S&P 500.  A simple rule of thumb is a “VIX Fear” factor of 5 points up/day, with 30 points down/Day on the S&P 500…between friends.  Here is the follow-up picture to the one I posted yesterday, and those yardsticks were confirmed again today:

chart 

It goes without saying that with the expectation of a poor jobs report tomorrow that the market should drop even further, and tomorrow’s action could speak volumes of what to expect in the immediate future. 

1.  The Bulls hold the line at somewhere between 1040 and 1058, or

2.  There is a rout by the Bears to drive the floodgates to a deluge of 30 or so on the VIX

In which case we can expect a further 30 point drop if these benchmarks are to confirm their value. This would imply that both lines in the sand shown above are broken for the weekend and next week’s action will prove crucial for the Stock Market. 

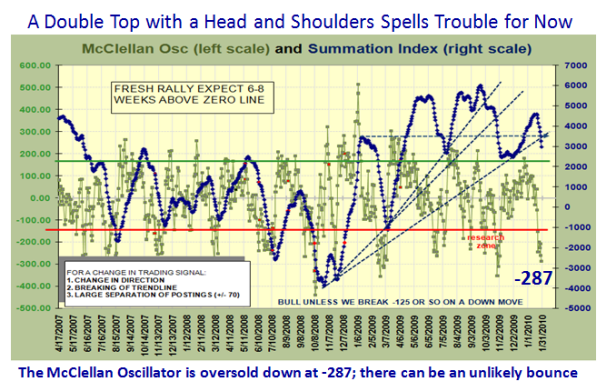
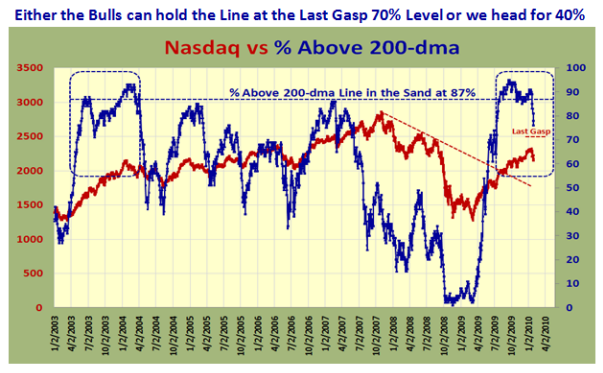
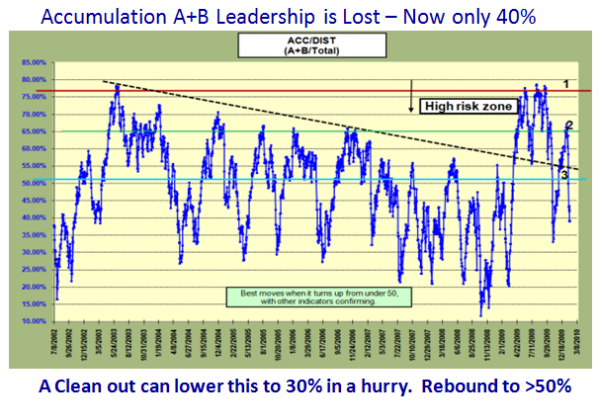
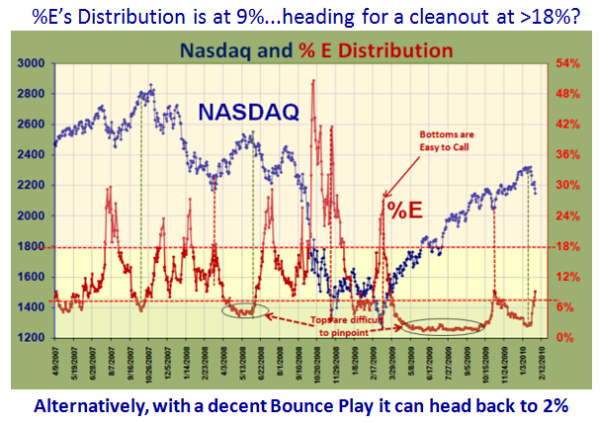
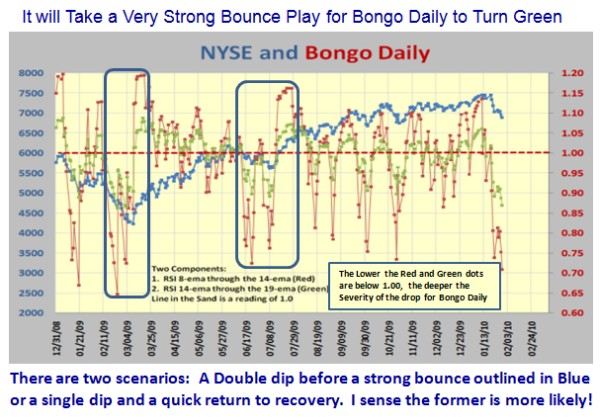
Shorts have at it with much fun, and Longs wait patiently to see how deep the carnage is or whether this was a decent clean out and a revival of the rally.  All the measuring rods will be out in full force this weekend by the various gurus of Elliott Wave, Fibonacci, etc, but keep your powder dry until the dust settles.  I feel sure the internals of the Market which I faithfully give you are all broken, so take your cue from that fact as there will be much repair needed after today’s numbers are digested.  Just look back a few blog notes to refresh your memory, and you will see the warning signs I gave you.

Best Regards, Ian.

Bounce Play or Dead Cat Bounce?

Tuesday, February 2nd, 2010

Here is a sequel to the last blog where I discussed Bounce Plays.  The thought struck me that I should show you the relationship of the VIX to the S&P 500 over the last ten days or so.  My new good friend Billy from Belgium planted the idea in my mind with his recent work, and I felt I might build on that to harness the near term parameters for defining a Dead Cat Bounce vs. a fully fledged Bounce Play.  As my other good friend Dave Steckler said “we will know in the fullness of time”, but I hope you will enjoy this short note, with no offense intended for Cat Lovers:

                      cat 

 The next chart needs no explanation, but as you can see there is tremendous symmetry in the relationship between the VIX and the S&P 500, so it seems to me that it is an easy call to make on the demarcation of where the Bulls and Bears are winning the tug-o-war.  We are sitting at around 1103 at the moment and with any luck another 12 points are on the cards to get to that stubborn line @1115. 

chart 

I suspect that given the general mood and bias to the downside that a Dead-Cat Bounce will peter out at 1115 and produces no Cigar!  The Bears are itching to short, but waiting patiently for the first sign of weakness after this two day rally. 

The Bull’s Challenge:

1.  Drive the short-term rally as far as they can towards 1145, and anything short of close to that will be the signal for the Bears to have at it.

2.  On the downside they must hold 1070…the recent low, or we will see the famous 8% down where 77% of all S&P 500 corrections turn back, or we head on down to 1040 which is 10% down.  After that it is anyone’s guess.

The Bear’s Challenge:

1.  Hold the fort at above 18 on the VIX and I would be surprised if it will get much below 20 even with a move to S&P 500 of 1115.

2.  Drive with “Bear fear” of 5 or more points per day on the VIX and break above 24ish for the real floodgates to open. That could take the VIX to 30 which is where most recent moves are turned back unless the floodgates turn into a deluge.

So now you have the simple game plan for the foreseeable future.  The March Seminar is now less than eight weeks away and it is time you signed up to get a seat.  We will be back at the Library, so as usual we can take 55 people with first come first served. 

Best Regards, Ian.

Bounce Play or Plunge into the Abyss?

Sunday, January 31st, 2010

As my good friend Mike Scott said to me;  “Let you know in a couple of days or a few weeks”.  The supposed bounce this past week never materialized, despite the good news of a 5% growth in GDP, and the relatively good Earnings Reports including the Tech Stocks which took a beating.

fool

The Sandstorm blew last week in favor of the Bears and the tepid bounce was hardly even a Dead Cat Bounce.  So you will notice that I have lowered the target for a deadcat bounce to 1100.  Note that drops of 15 points per day on the S&P 500 have taken us down to 1074 and we are but another 16 points away from the Big Line in the Sand of 8% down, i.e., 1058.  So we could see that this coming week.

sandbox

More importantly the mood is now somber all around.  I’m not telling you anything you don’t know already, but it will take a major turnaround of events to instill some life back into this rally.  We have only to look at the key internals we watch to see that a lot of damage has been done since the S&P 500 reached its peak of 1150 just 9 trading days ago.  The next four slides are well known to you so here they are in quick succession:

mc

200

a

e

Now I come to a new beast, which my good friend Bill Roberts and I are working on.  The challenge was to see if we could give insight into how red was red and how green was green on Bongo Daily and Bongo Weekly.  This is work in progress but it might open your eyes that we are onto something. 

I will show you a snapshot of Bongo Daily to whet your appetite.  As you well know we use RSI 8, 14 and 19 ema as the basic crossovers to establish a trigger of Bongo Up or Down, and we struck on the idea of looking at the actual components of 8 up or down through the 14, and 14 up or down through the 19.  These are depicted by red and green, respectively in the chart below.  The demarcation line is “1.00” as shown by the dotted horizontal red line.  The higher the two lines are up from the dotted line at 1.00, the stronger is Bongo Daily and vice versa.  So we are in the dumpster at the moment!

bongo

So I summarize again by saying there are two scenarios:  A Double Dip before a strong bounce outlined in Blue or a single dip and a quick return to recovery.  I sense the former is more likely!  I don’t think I am mistaken that there is a change in psychology that has taken place these last couple of weeks as good news is being ignored and negative news carries more weight.

Best Regards, Ian.

The New Buzz Word – Populist

Sunday, January 24th, 2010

Last week was a bad week for the Stock Market – it has the Heebie-Jeebies, i.e, the Jitters are very apparent and of 2008 proportions with a 500 point drop in the DOW.   This week can add fuel to the demise of the 10 month rally we have enjoyed since March 2009 or give us a renewed boost to the rally.  It stands to reason that Politics more so than Earnings will be front and center as we look forward to the vote on the Fed Chairman, Ben Bernanke, and the State of the Union Address by President Obama on Wednesday.  The REACTION by Wall Street to both may seal the fate of the rally and bring about the Intermediate Correction that so many have touted for so long, or find a fresh move to the upside to continue the rally and keep the Golden Cross alive.

pic

The Internet seemed to enjoy the Custer’s Last Stand blog note last week as I laid out the simple process steps that would cause Long Term Buy and Hold Investors pause for concern.  Sad to say the resulting action happened inside three days flat with successive %B 1-Day Down Kahunas driving it down through the Bandwidth to finish with a negative reading of – 0.27, a number not seen since the Gloom and Doom days of 2008 and early 2009.  Here is the updated chart:

nyse

As a result, the Playing Field for the Ball Game next week has shifted heavily in the Bear’s favor.  The chart below shows the various Lines in the Sand for either a reasonable Bounce Play back above Custer’s Last Stand and beyond, a Dead Cat Bounce to the obvious resistance at 1115; this would then lead to a Bear Feast of a Minor Correction of -8%, or something deeper that would end in an Intermediate Correction of -10% or worse.

field

It hardly seems that six months have gone by since I first discussed the Golden Cross in the July 19th 2009 Blog Note, but I felt it worth showing you the progress that the Stock Market Rally has made since then to cheer you up!  You will note that the results have been every bit to the High Side relative to past history, and projecting its progress for the next six months to mid-2010 would put the S&P 500 at around 1250.  The alternative is a downside swing which could lead to a Black Cross where the 50-dma crosses down once again through the 200-dma at an estimate of about 1025. Here are the results:

            ss

cross

Next week should be an interesting week one way or another.

Best Regards, Ian.

Stock Market – Custer’s Last Stand

Thursday, January 21st, 2010

I gave you a Game Plan for Type 3 Swing Traders in my last blog, and that seems to have shown you the correct Playing Field as we ying-yanged back and forth between the upper boundaries I showed.

roadmap

Sad to say that as I write this we are now down to Custer’s last Stand, so the Swing Traders know exactly what to do.

last 

The Optimistic View:  Now we come to the Type 4 Buy and Hold Types who want to stay a while longer if only this market doesn’t run out of steam.  Having reached 1150ish on the S&P 500 and 2326 for the Nasdaq, the upper boundary next targets are 1200 and 2400, respectively:

opto

We come now to the present and here is the Chart that alll Type 4’s are following:

buy

Since the 2009 rally has had an uncanny similarity to that of 2003, we can emulate a possible correction where I have “stuck” the next six months on the Right Hand Side to emulate 2004 in 2010 as one possible scenario:

2010

Now we come to the Game Plan for all who value what they have in their 401-K:

steps

…And here is the current status, with three legs done and two to go.

nyse

I’ll give you one last winky-winky…If %B comes down to -0.20 or greater, run for the hills!

Best Regards, Ian.

Copyright © 2007-2010 Ian Woodward
Disclaimer: Commentaries on this Blog are not to be construed as recommendations to buy or sell the market and/or specific securites. The consumer of the information is responsible for their own investment decisions.