Ian Woodward's Investing Blog

Archive for the ‘Market Analysis’ Category

Late Breaking News…Read All About It!

Monday, August 17th, 2009

When I was a young man still in College in Jolly Old London, I used to pass a
Newspaper Man selling his three Newspapers standing at the corner of Holborn
Tube Station and shouting out “News, Star or Standard…read all about it!”

           roller

Since this is an Educational Blog to help you Protect the Money you make and
hopefully learn to Make More Money (MMM), I felt it important to give you a
heads up before the News got stale and to show you the value of this trick.
Always Watch the Leaders to give you the earliest clue of the possible direction
of the Market.  They are fat with profits and are the first to get hit hard.  Today
was such a day.   If you do not have this list of stocks in your Users Group in the
HGSI Software, you are flying blind.  Take the time to enter the symbols into a
Users Group and watch the Index every day.

I show you two quick examples, one from two years ago at the Top of the Market,
which I used in the October 2007 Seminar, and the other fresh off the press which
is today’s “Read All About It!” The markets were down around 2.0% to 2.84%,
while the leaders dropped a hefty 4.39%.  Of course that is just one day, and can
only be considered a shot across the bow at this point in time, but watch their
behavior and see if the first chink in the armor turns into a massive tear:

hgs 701

leaders

A Picture is worth a thousand words, so here is what all the fuss is about:

wc

To be fore-warned is to be fore-armed.  The Leaders Index is at a critical juncture. It must bounce back fast or the rally is over for now.

Best Regards, Ian.

Three Camps, Three Road Scenarios

Saturday, August 15th, 2009

I have always taught that it is imperative to have three scenarios identified and to then let the Market lead you to which one to be on.  Wishing for your pet scenario seldom works in the stock market and those who constantly can anticipate being on the right side are gifted as there are few of them.

I was struck by an excellent article written by Jay Kaeppel of Optionetics.com who thinks in a similar vein and I felt I would take a leaf out of his book as I liked the  way he described the “Three Camps” that people can be pigeonholed in as to their investment sentiments.  He sugested “Camp Sunshine”, “Camp Just You Wait” and “Camp Go with the Flow”.  I took his first one, but changed the other two to suit what I have taught you before now, and here it is:

camps

In scouring the web, I found an excellent site called dshort.com where I found the following two charts to describe the first two camps of Camp Sunshine and Camp Gloom and Doom.  They are self explanatory, so I need say no more than show them:

sunshine

gloom

The third camp of Stay Light on Your Feet, is the one I suggest you stay on and I cover
the rationale in the next two charts below.  Always watch the Gorilla Leaders:

light

warehouse

It is important to review what has transpired this past month in the continued rally of 17% since the last minor correction which ended in early July:

1.  We are now over 50% up from Low to High on Most Market Indexes
2.  The Golden Cross is now behind us whether you are in the dma or ema camp
3.  But now we are once again at the crossroads, since the Golden Cross can either stay solid or melt down into a Lead Cross.

golden

For it to continue upwards, three items must remain solid, otherwise it’s curtains:

a. %B of the Bollinger Bands stays above the Bandwidth, and preferably above 0.7
b. The Di+ must stay above the Di- of the Directional Movement Indicator
c. The Accumulation %A/D must stay above “0” and preferable above 20%

There is little point in my covering chapter and verse on the upside since the targets are obvious…breakout again above 1018 on the S&P 500 and head for the 50% retracement level of 1119, as shown in a previous blog.  Remember, this is feasible given the Volume Vacuum the Black Swan afforded us on the way down in October, which now presents us with an opportunity.

I have updated the  Downside Targets I gave you in an earlier blog.  Please don’t  misunderstand my intent as the glum and happy faces are there to make a point. They show how far away we are from meeting the target, but also with a rotten scorecard as this, the contrarian opinion would suggest that good times are coming soon.  It reflects the degree of extension by the current rally.  It also suggests that until most of these are met, it is HIGHLY UNLIKELY we will suffer more than another Minor Correction.  The Targets therefore represent a complete swing from Bullish to Bearish, which after all is a Gloom and Doom Scenario:

targets

Best Regards and Stay Light on Your Feet.  Ian.

What Goes Up, Must Come Down…But Not This Time!

Saturday, August 8th, 2009

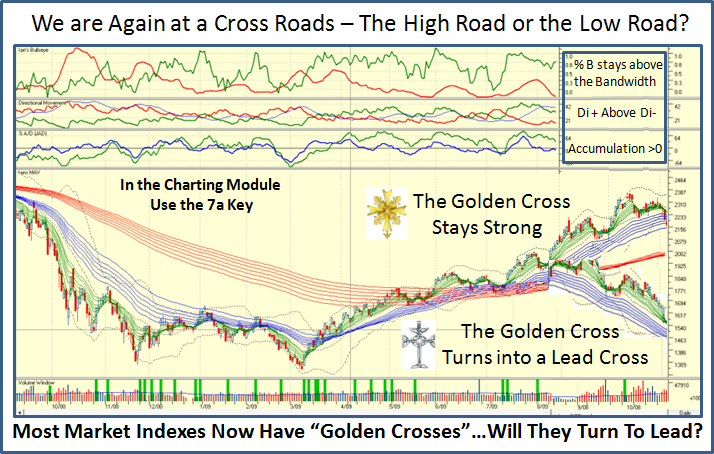
My good friend Ron Brown puts it so well in his Weekly Free Movie…”Some of the major market indexes are out to new yearly highs, but the NASDAQ, the former leader is beginning to lag.  Can the markets keep up this torrid pace?  It’s doubtful without a pullback to digest the recent gains.”

    picture

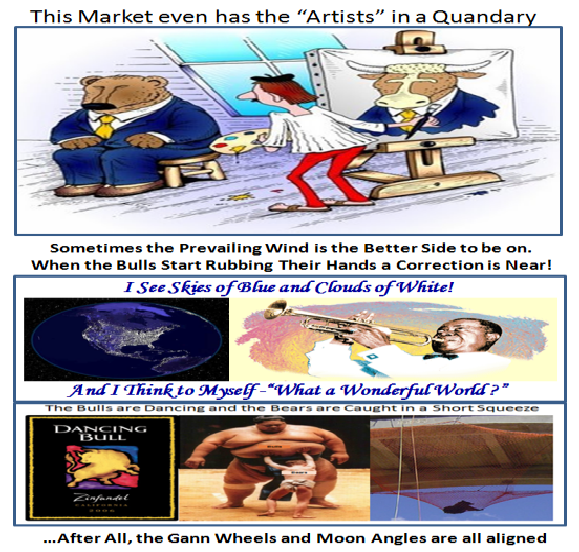
I had a Picture ready to go, but my friend, “Paxen”Mike Scott sent me a better one that describes the mood very well, so you will forgive me for showing both together as they both tell a story.  If you are a Type 1 and 2 trader, you can switch from Bear to Bull in a wink, a trifle disappointed but seldom hurt too much. 

Type 3 Swing Traders scratch their heads and realize they were fooled and should have stayed on the long side, or keep rubbing their hands which is always fatal.  If only the herd can find the right balance between Fear and Greed.  However, the rally was saved by the Jobs Report, the Bears had to cover their shorts as they found they were in a short squeeze ONCE AGAIN. 

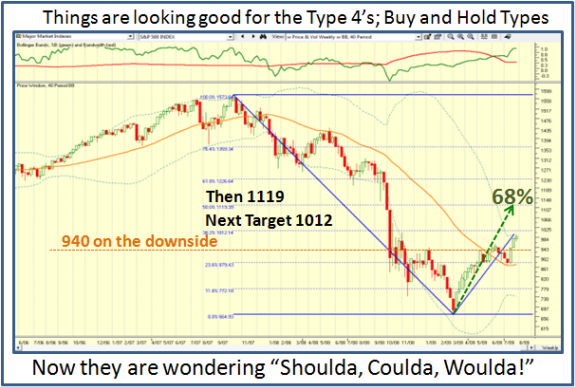
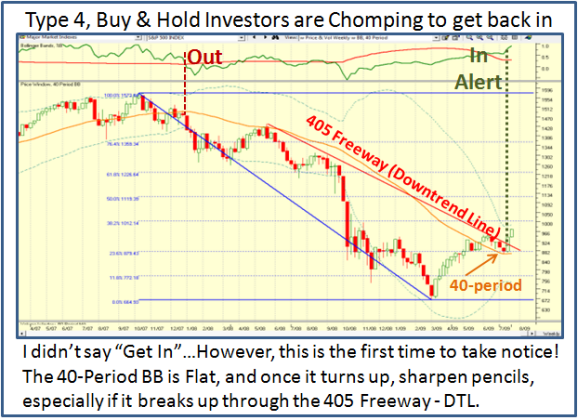
Type 4’s, Long Term Buy and Hold now see that they have all the required longer term criteria in place, and wondering why they shoulda, coulda, and woulda earlier. However, at this stage they are playing with fire and would be prudent to wait for a pullback before they go for it.

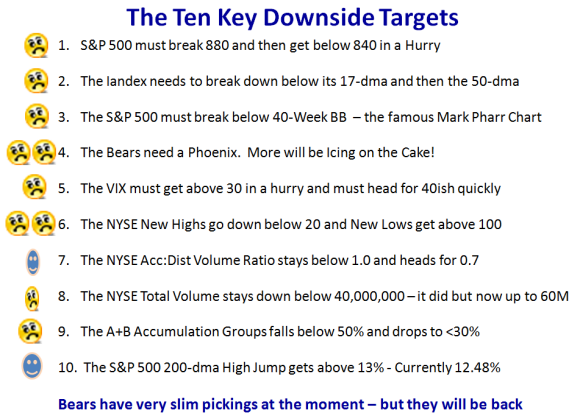
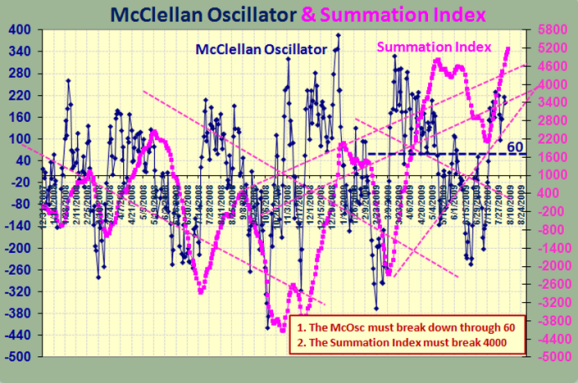
I am again indebted to my friend Ron Brown for keeping my head on straight in this seldom encountered type of rally.  I have long been a believer in the McClellan Osc and Summation Index which my other friend, Aloha Mike Scott has made me focus on for the past twenty years, so I had already seen the phenomenon.  I digress, but here is the late breaking news which Ron sent me from Sherman McClellan himself in two recent notes, which give the Technical and Fundamental Reasons as to why:

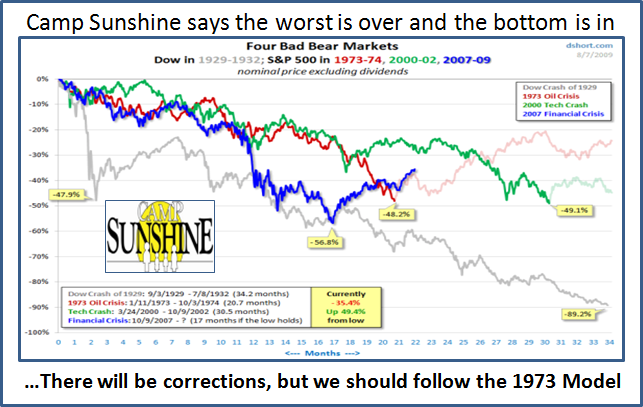
“…Bear Market rallies do not display the sustained power that is showing now with the higher Summation posting.  When the Summation tops out in this move that may lead people to think that the bear market rally has been completed, but it would be very unusual for the price move down to be anything other than a consolidation of this initiation thrust.”  Type 3 and 4 Investors should take good heed of this point.

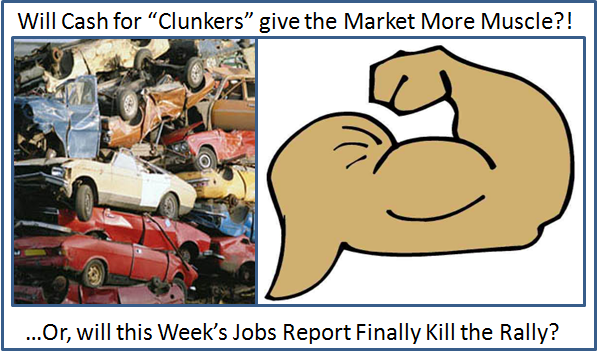
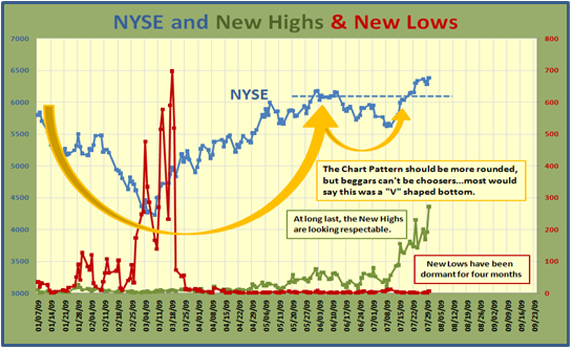
“…It only takes a look at the data from the St. Louis Fed to see that the past year has given us unprecedented money flows, economic outfall and FED creativity.  The US Government has dispensed exorbitant amounts in Clunkers rebates, TARPs and TAFTs and twisted CEOs arms and other body parts to ameliorate societal discomfort.  Fortunately the Summations do behave differently in Bull and Bear markets.  It is that difference that I was trying to point out.  While the economy and its operatives may be in an outlier situation, the Summations are telling their story using the same pictures they have always used to identify bear to bull trend reversal.  Sufficient liquidity does produce results.”  Here are the Results he refers to:

     mc osc

     volume

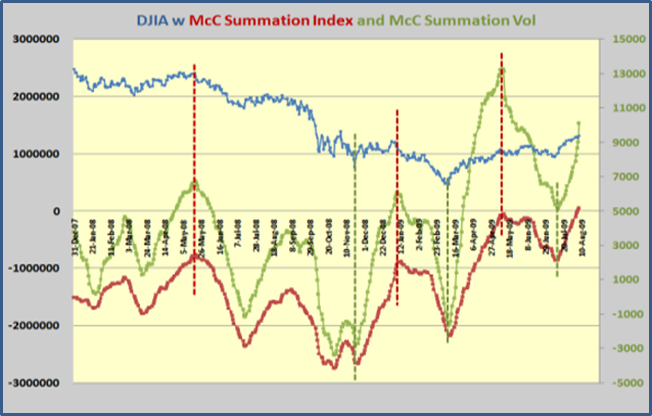
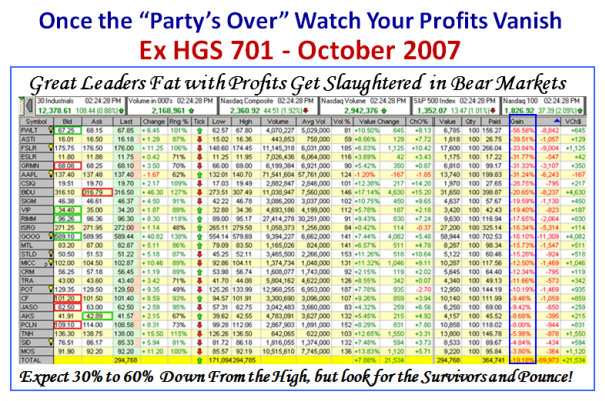
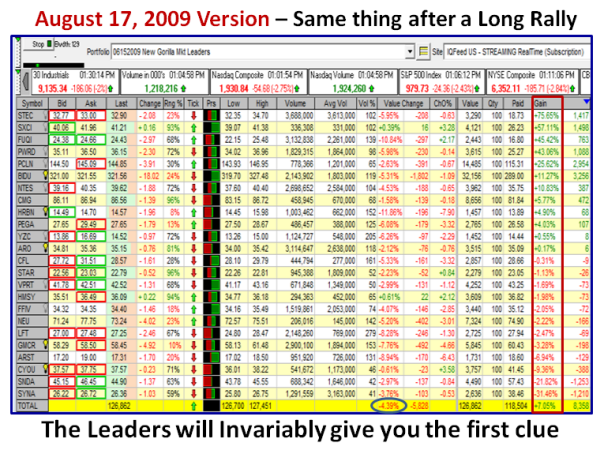
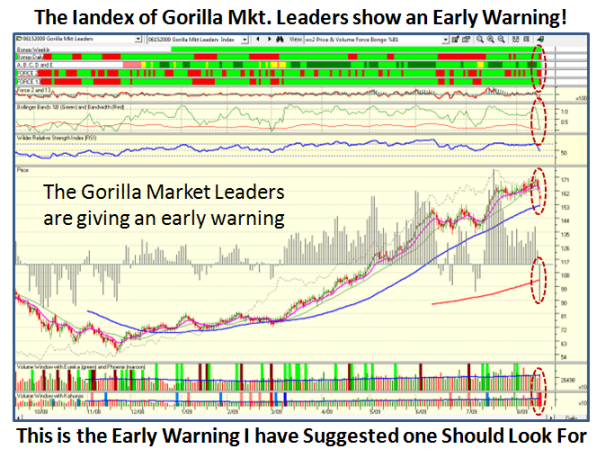
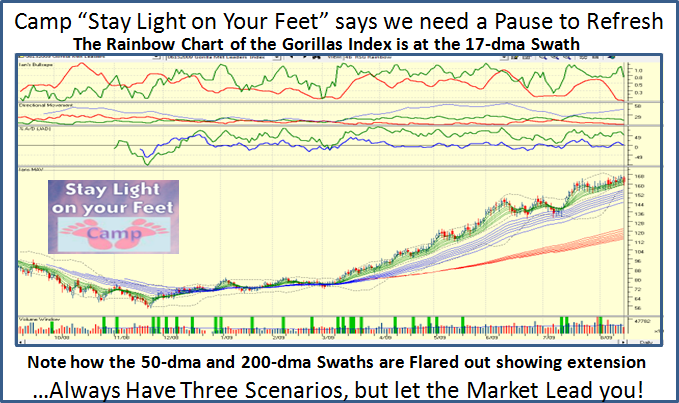
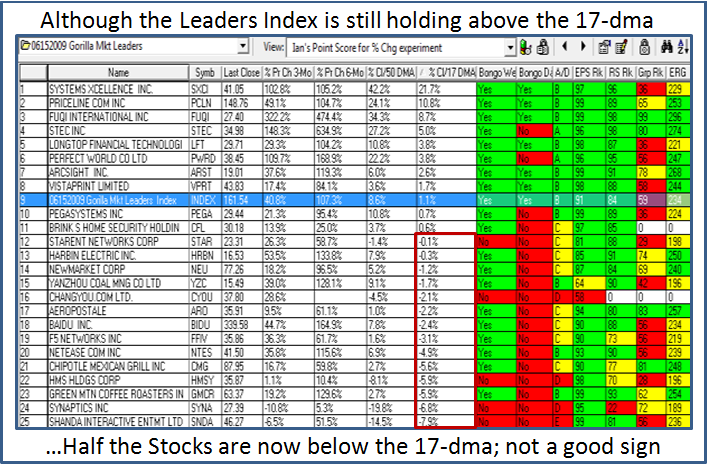
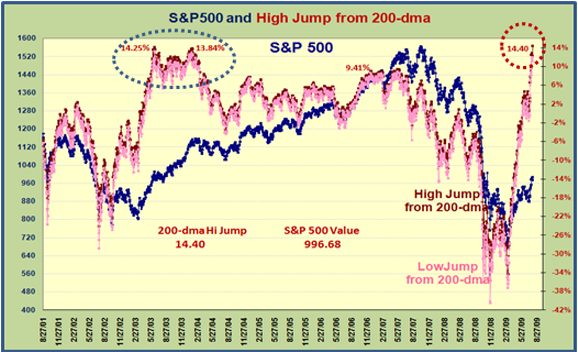
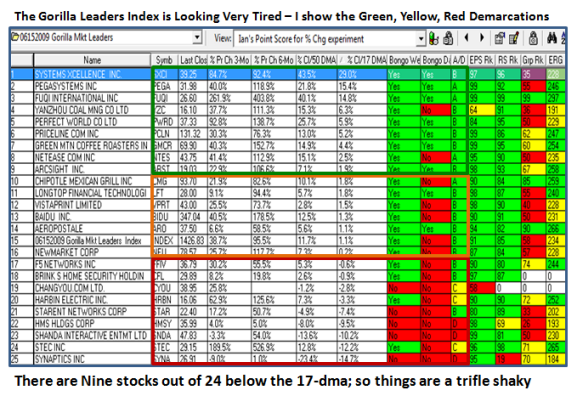
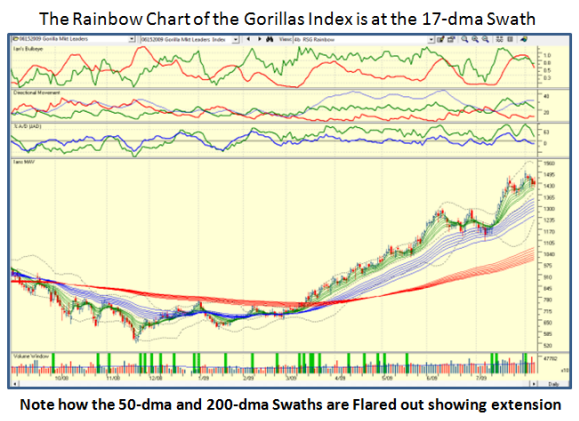
Given the above, I strongly suggest that those who look for comparables that you do your research with 1996, 2003 and 2009 to look for similarities in the force of this Index.  Now to take care of my High Growth Readers – there is no better old faithful than the Gorilla Index I have posted several times before on this blog.  I show two pictures, one of the numbers and the other of the chart.  Don’t quarrel with me as to where I placed the lines of demarcation. The only message that matters which we can all agree on is the Index is looking very tired.  Since these stocks are FAT with profits they will get hammered as many have already.  However, look at the % Pr Ch 6-Month column to see the great gains for these stocks, despite those they have already given up.

     warehouse

     chart

I will save the rest for the HGS Investor Newsletter that is due next weekend, but I have another piece for you called “A Case Study in Learning Your ABCDE’s” and Ron and I will unfold additional factors to look for as to when you should feel the Rally is confirmed to be broken.  Then we will look for new upside clues to start the process all over again. 

Meanwhile, pay attention to the above and don’t let the pundits sway you with what the Market should do.  It’s far better to let the market tell you what it is doing, and make your decisions accordingly.  Powerful corrections and rallies such as those we have endured the past year will invariably overswing the pendulum beyond that reasonably expected, so don’t count your chickens before they have fully hatched.

Best Regards, Ian.

More Stock Market Muscle from Cash for Clunkers?

Saturday, August 1st, 2009

The Bulls are enjoying the ride and seemingly this Market can do no wrong.  The
psychology has changed from gloom and doom to the Bottom is in and the
Recession is behind us.  How long the euphoria will last is another matter, but
with the chitter-chatter of “Cash for Clunkers” this weekend, it must surely spill
over to the Auto stocks if not the whole Stock Market on Monday.  But watch out
for the looming Jobs Report this coming week which if poor can turn the Market
sour; but if good can send the S&P 500 through 1000 and on its way to the next
target of 1012.

picture

I gave you the Targets for the Bulls and Bears in the last blog and have updated the
Status for you below.  As you can see things have matured and now it is a question
of whether the Bulls can hold the line or we pause to refresh yet one more time.

targets

This Rally is now five months old and we have not had a 10% correction…the worst
we have suffered is 9% on the S&P 500.  You will recall that all of 4 Months ago I gave you the Saw Tooth Plan as a way of staying on top of your Money Management and
running for the hills to save your 401-K if things got tough.  The chart below was on
the April 3rd Blog, and we have certainly come a long way.

old

The Bottom Line Message is that Higher Highs and Higher Lows with no more than an 8% correction is all you have to watch.  Then raise the Lines in the Sand when the
Cushion gets more comfortable which I have done in this updated chart as we have
got long in the tooth.

new saw

At the March HGS Investor Seminar, I told you that we would not fully recover from
this dreadful Black Swan swoon until we saw New NYSE Highs >100 and New Lows less than 25.  I am happy to report that we are there and this is yet another sign that the Market internals are strenthening for Type 4 Buy and Hold Investors to begin to dip their  toe in the water.  If you are not already in, then it would pay to be ready after the next correction provided it is not disastrous.  The next two charts show the status:

new highs

ss

The NYSE Total Volume has improved and now sits just below 60 M shares.  I expect
if it stays at this level there should not be any further concern of insufficient volume.

total vol

The only item on the Targets that is a little sluggish is the 50-dma of Adv:Decl Volume Ratio, but as I show the 17-dma of this item is very healthy @ 1.55, and given that the market went sideways for two months, the 50-dma will take time to return above 1.2.

up down

The Type 4 Buy and Hold Investors should stiffen up their backbones and begin to feel that the market has repaired sufficiently to dip their toe in the water.  Obviously, you need to watch the market and choose your spots carefully:

mark

Lastly, let me finish with a caution on the High Jump which is screaming “extended”
when compared to what transpired back in 2003.  Of course it can go higher, but we
are due for a correction as shown by the dotted oval line back then.

high jump

Good Luck and Best Regards, Ian.

The Stock Market is Still Celebrating the Moon Landing

Thursday, July 23rd, 2009

moon

At long last we have a decision on which way this market will move given today’s
substantial rally, which pushed through the bugaboo level of 956 and plagued
this Market for the past two months plus.  We had a 9% correction from the top,
and now we are headed for the next target of 1000. 

The Golden Cross which I discussed in the previous blog has done its duty and
produced the best one month gain in 20 previous such occasions with a Gain
of 9.07% to close today at 976.29.  Please note that from History the next month is flat, so don’t be too excited if it performs according to the past.  It seldom happens, but is always good enough of a target for gov’t work.

gc

At long last the Saw Tooth Game Plan is again looking healthy, and as you can see
we are again on the high road with an even bigger cushion than before of being
able to tolerate a 10% correction before we again hit the magic number of 880 to
the downside.

saw

The Monthly Coppock is still up, but the Weekly has corrected over the past six weeks and is now finding a bottom and hopefully will turn up, but not there yet:

coppock

I gave you two sets of Targets on the last blog for the Bulls and Bears respectively, and we will look at the status with happy and sad faces.  The three most important
items are:

1.  The Acc/Dist Vol. Ratio was weak and should return to 1.2 – Currently @ 1.0
2.  The 40-period BB was flat and needs to turn up before Long Term Buy and Hold Investors should at least feel the Market has turned the corner for them.
3.  The High Jump for the 200-dma to the Index is peaking – Currently 12.48%

Here in quick order are the three charts that present the situation:

acc

mark

high

The Update on the Ten Upside and Downside Targets for the Bulls & Bears follows:

upside

downside

As my boss once said to me “Stick with me and you will be wearing Diamonds for
Suits…Nothing Else!”:  Still waiting for the Diamonds.   This market is event driven, and Earnings are currently at the forefront.  Three things still loom:  The deficit, the bail-outs, and health care are other big items.   Markets can turn on a dime.  Take it a day at a time.

Best Regards, Ian.

Copyright © 2007-2010 Ian Woodward
Disclaimer: Commentaries on this Blog are not to be construed as recommendations to buy or sell the market and/or specific securites. The consumer of the information is responsible for their own investment decisions.