Ian Woodward's Investing Blog

Archive for the ‘Market Analysis’ Category

Technology is on the Move Again
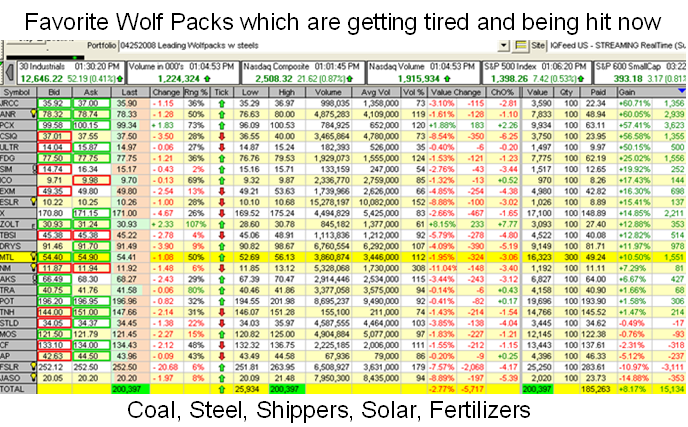
Sunday, June 1st, 2008

With Oil sputtering and hot Wolf Packs tiring, Technology Stocks have begun to awaken for a potential move up after losing 25% since November of 2007.

tech 

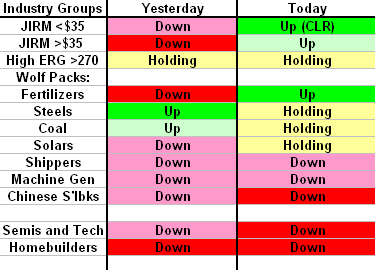
  • As my good friend and partner, Ron Brown, explained in his movie this weekend the Technology Sector was hot last week and the Nasdaq 100 along with the Nasdaq were strong.  In retrospect both Google and Apple reported revenues of 42% and 43%, respectively, higher than a year ago.  Mergers and Acquisitions are also picking up in the Technology Sector.  Also, the Russell 2000 which has been generally weak has come on these past few weeks.   
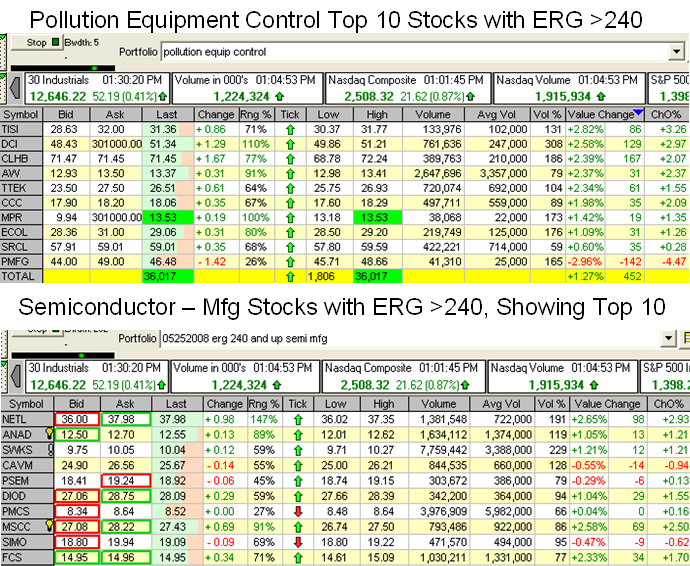
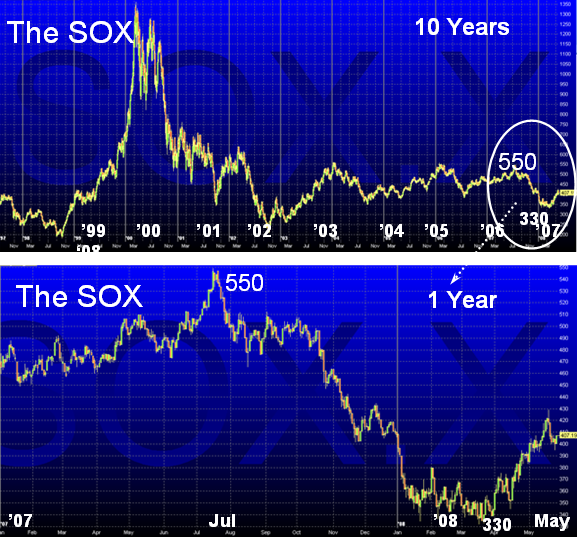
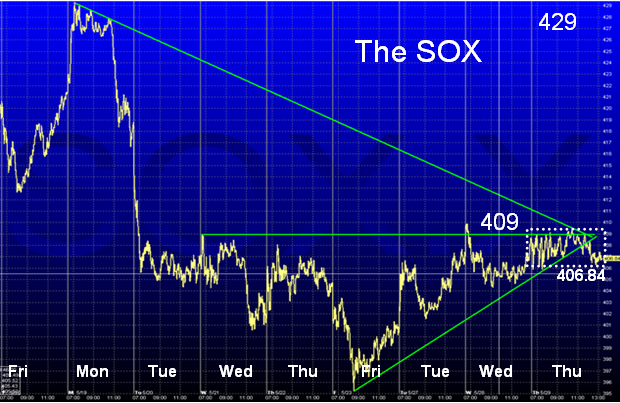
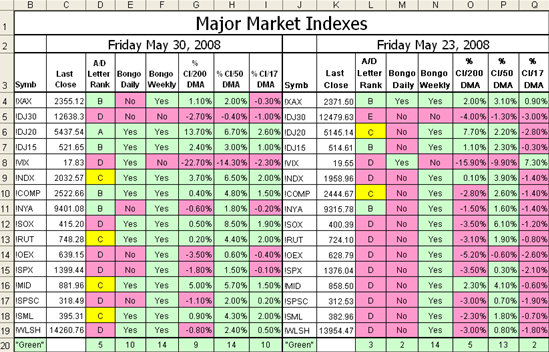
  • Last week I gave you an early indication with a long discussion of the Semiconductors (SOX) Index, showing that it was gearing up for a move that occurred on Friday…granted that it was a tepid breakout above 409.  That is all the more reason to sit up and take note of where the opportunities lie.  In the following charts I show you the change in the Market Indexes from the horrendous week we had over a week ago and the recovery this past week. I show the major change in some of the key Technology Groups that have moved this past week and then an updated view of the Semiconductor Mfg Group based on last week’s performance. 
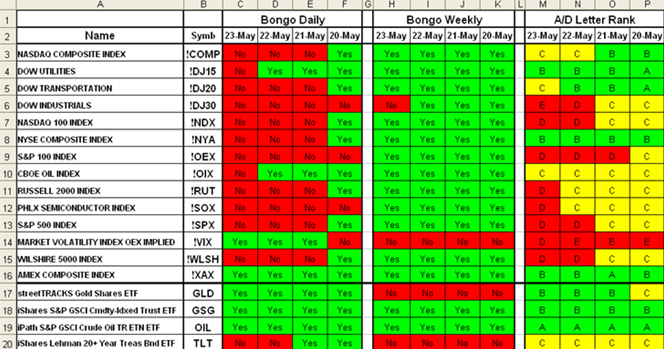
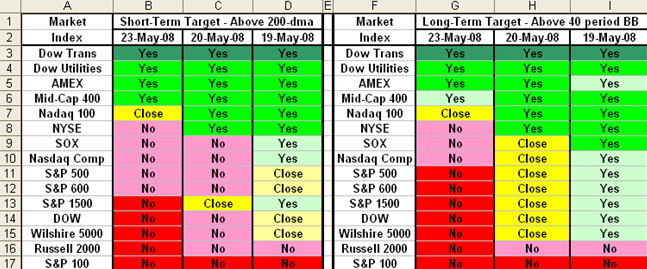
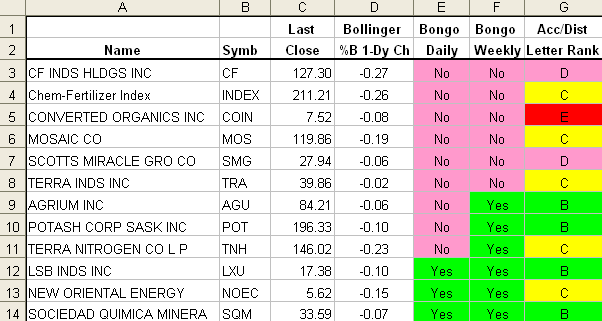
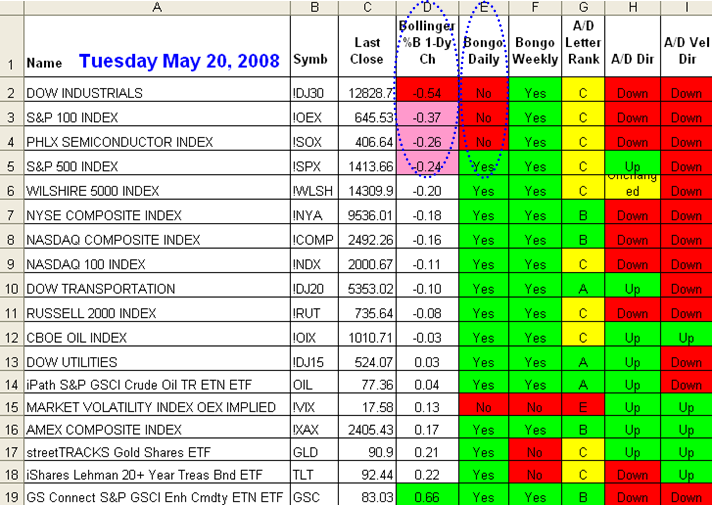
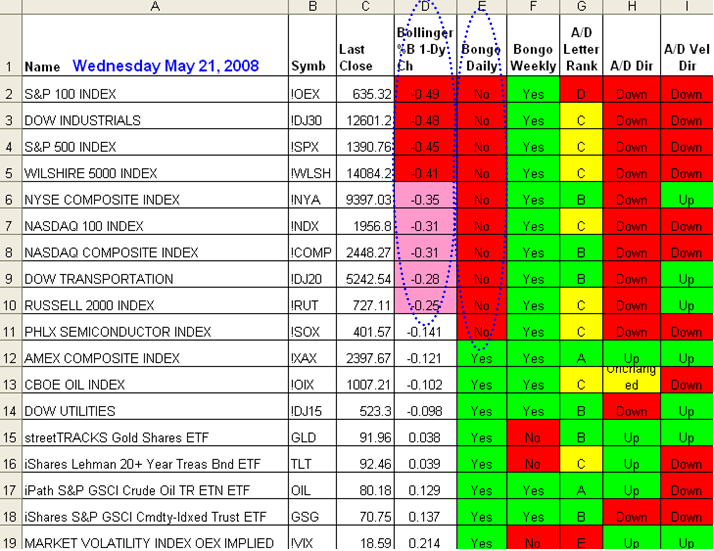
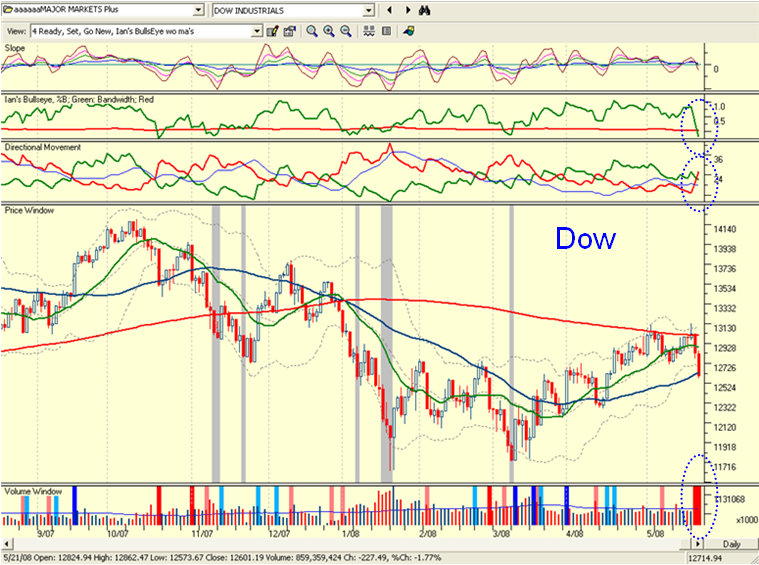
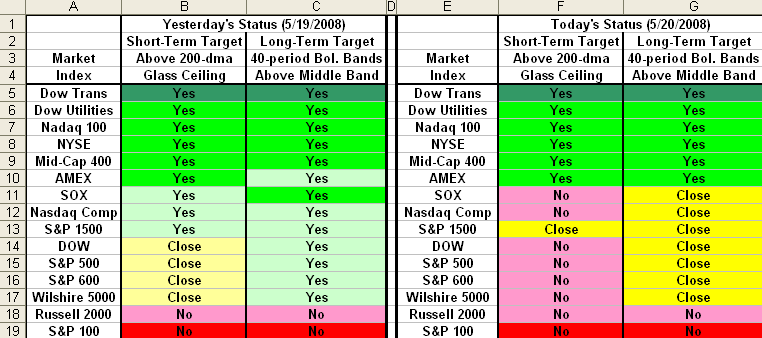
  • You will recall in the last two blogs that I had been bemoaning that we were so close but yet so far for all Market Indexes from clearing the key short-term hurdle of the 200-dma, but I am happy to show you that things have improved substantially this past week.  Note that Bongo Weekly signals have remained strong, but there is a marked improvement in the Bongo Daily which has jumped up to ten from two the previous week.  Also the Acc/Dist picture has improved as shown in the diagram below:

 markets

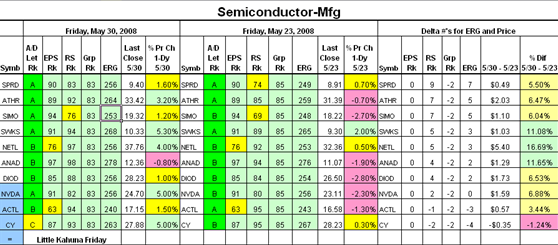
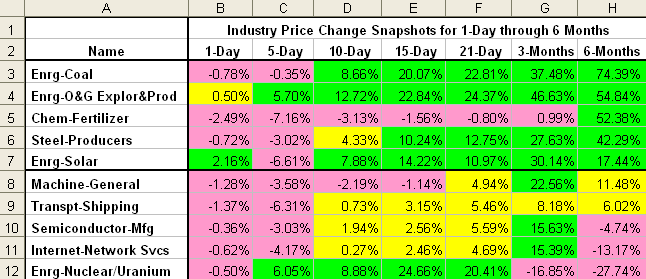
Many moons ago, I coined the terms Delta ERG and Group Speed and the chart below shows exactly what I mean.  Note how the Computer – Enterprise group jumped 24 points from a low Group Rank of 35 to 59 in a week, while Delta ERG shows the total improvement.  The left side of the chart shows this Friday’s data, and the right hand side shows the INFORMATION to help you see the changes from the past week:

groups

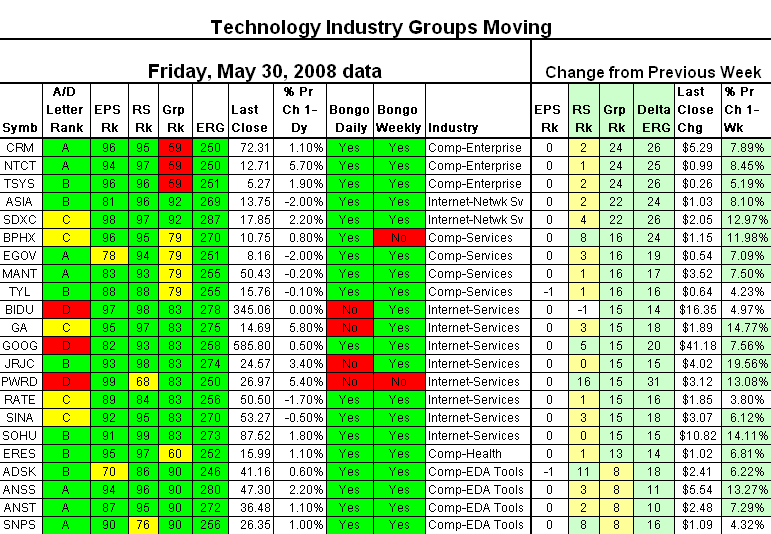
This next chart updates the information of the previous week on the Semiconductor – Mfg stocks to watch.  Note I show that three stocks had Kahunas last Friday, implying they had strong momentum and should be watched this coming week, despite their negative changes in ERG.

s2Best regards, Ian

Where O Where Have the Wolf Packs Gone?

Thursday, May 29th, 2008

Continuing the theme of my last Blog where the question was whether the Stock Market was in a Rotation, a Correction or in the Fertilizer, suggesting three scenarios of up, sideways or down, the question is “Where O Where have the Wolf Packs Gone?”

wolf

The favorite Wolf Packs that have been stalwart for many moons took another hit today, exacerbated by a statement from Bloomberg that Merrill Lynch recommends investors to sell Sun Power Corp (SPWR) and Evergreen Solar Inc (ESLR) companies. Merrill says Germany – world’s largest solar market – may cut subsidies by as much as 25%, greater than the 16% reduction analysts had expected, Bloomberg reports.  This brought all the Solar Stocks down heavily today as shown in the picture below, along with all the other favorite Wolf Packs:

favorites 

  • It goes without saying that whenever these favorite Industry Groups and Stocks get hit they come bounding back, but it seems this time many of these groups and stocks are looking a trifle tired.  Anyway, the question is whether there are other potential Groups that produce an opportunity if Rotation is indeed underway? 

  • This is a choppy market and after getting a whacking last week as I showed in the last blog, most investors and speculators are concerned that we are now due for a further leg down to test the old lows.  However, as my good friend Maynard reminds us there is always a market somewhere on the long side, and I take a leaf out of his book to suggest that Pollution Equipment Control certainly had a reasonable day today.  In addition, I have been watching the Technology groups and selected the Semiconductor –Mfg Group as one potential Wolf Pack in that Sector.  The SOX was hammered for the past 10 months and may be stirring again.  Here is a selection of ten stocks from each Industry Group with strong ERG credentials of 240 and up:

new wolf packs

 I had hoped that the Semiconductor SOX Index might be able to break out of a base today as it tried all day to move up through 409, but fell back towards the end of the day.  Here are two snapshots to give you the perspective of what I see, one long term over the past ten years and the other this past year.

ten years

Then below, I zoom in to today’s action to show you what I mean of the SOX trying to break out above 409.  Note that it has broken the short-term uptrend line and may continue to falter.  If on the other hand it can find enough muster to regroup and break through the 409 resistance, we may have opportunities in the Technology Sector and specifically the Semiconductor Mfg area, where there are over 20 stocks with ERG >240 of which I show you the top ten based on their behavior during the past week.

today

Rather than holding this blog over till the weekend, I felt you would like some fodder to research and see what happens tomorrow, but realize that we are at month’s end and it is Friday so anything can happen, especially as many are expecting a down move again sooner rather than later.   Best Regards, Ian.

Stock Market Rotation, Correction or Fertilizer?!

Saturday, May 24th, 2008

It may be a coincidence but every Tom, Dick and Harry is looking to short the Chemical – Specialty Fertilizer Stocks such as POT, MOS, CF and TRA, while others are wondering if the correction is over and it might be a good time to do a bottom fish on these stocks.  Some see Head and Shoulders formations for shorting and others see support at their moving averages. Beauty is in the eye of the beholder.  What ever they see, there has been a fair amount of damage done in the Market Indexes, the leading Industry Groups (Wolf Packs) and the Leading Stocks this week, as this note will quickly demonstrate.

corn

  • This time last week I warned not to count our chickens before they are hatched, but we were certainly looking very comfortable relative to the two key Targets I set for Long Term Buy and Hold Type 4 investors, while Types 1, 2, and 3 were making hay while the sun shines.  Types 2 and 3 have closed out most of their long positions, while Type 1 and some 2’s have turned on a dime and are short – many playing Ultra ETF’s where they double their money with the likes of the QID and FXP. 

  • It is amazing how times have changed, but as I have said before, you need to be a Jack of all trades and at least a master of two to make big money these days by playing the long and the short side.  Otherwise, be patient, prudent and pounce if and when the market corrects and we are off on a new Bear Market Rally again.

  • Another underlying theme for this note is that HGS Investors can see the beauty ebb and flow with changes in the market, the industry groups, the scenarios and the stocks and are not caught in the mire but can be ahead of the game.  I will take you through the layers with Tops-Down Investing with a few simple pictures showing you the Change in the Market in just one week flat!

Let’s start with the Market Indexes and demonstrate how they have gone from being most promising and Mostly Green to Blinking Red this week:

markets 

  • A picture is worth a thousand words and High Growth Stock Investor gives us the tools to create the picture.  It is the CHANGE in the panorama of snapshots that matters not the still photographs.  That is the difference between Information and Data. 
  •  Inside a week, we see how the deterioration has set in as we see the market Indexes go from a reasonable Mostly Green on May 20th to a Murky Red by May 23rd on the Bongo Daily, Bongo Weekly and the Accumulation/Distribution Signals.
  • That picture tells one to garner profits, take cover, and suggests switching from Bullish to Bearish.

Now let’s look at the two Critical Targets that will eventually turn us from a Bear Market Rally to a Full Blown Market Rally as I have covered copiously in the High Growth Stock Newsletter as well as on this blog.  The picture below shows that while both targets were in our grasp last weekend, they are now looking “Proper Poorly” to quote an Uncle of mine from the past: 

  1. Short-Term Target: The glass ceiling of getting past the 200-dma is uppermost on our minds.
  2. Long-Term Target: The 40-period Bollinger Band Chart must see the Indexes above the orange line of the middle BB.  That is the true test of whether all Indexes are fully on the mend.

targets


Next, I have selected nine Wolf Packs which we have followed for the past several months and one which has just poked its head up in the last few weeks – Energy – Nuclear/Uranium.  Thanks to Lou Powers for segmenting the vast Energy Group and to the HGSI Software Developers for incorporating this in the recent improvements to the IM Industries Groups.

industries 

  • It doesn’t take two minutes to see that the leading Industry Groups all got hit this week

  • Energy Coal and Explor&Prod are still strong but the former took a slight hit this week

  • Chemical Fertilizer has been tired for some time and Steel Producers are losing ground

  • Energy Solars took a hit this week but came back yesterday from the pullback

  • Machine General, Shipping, Semi’s and Internet Net Svcs are all struggling

  • The new glamour kid on the block is Energy –Nuclear/Uranium for obvious reasons

  • Don’t get too excited unless you like tiddlers of <$6.00; the only big stock to watch is CCJ 

Finally,  let us burrow down on the Chem – Fertilizer Group which is looking weak:

fertz

Enjoy the long weekend and I have given you plenty to chew on, so keep your powder dry and good luck next week.  Understand that it is the CHANGE in the numbers that matter to see the panoramic pictures I have put together for you to turn data into information.  I trust that gives you the pulse of the Market, the Targets I set for us, and the Industry Groups we follow at this critical time.

Best Regards, Ian.          

 HGS Logo
Try a 60-day free trial subscription – no credit card required for sign-up.


Kahunas Volleyed and Thundered!

Wednesday, May 21st, 2008

picture

Yesterday, I warned that we had a shot across the bow, and today the shots are at the bow as Kahunas volleyed and thundered!  I have captured yesterday’s view below that shows that there was just one big Kahuna on the DOW and three Little Kahunas.  Also we had three Bongo “No” signals suggesting that these were weak Indexes.

may 20 

Now look how the picture has deteriorated one day later with four big and five little Kahunas today and the Bongo signals have expanded to ten “No”.  In addition, note that we had two Big Kahunas in a row on the DJ30, which suggests it is time to take defensive action sooner rather than later. 

21 

It goes without saying that all the favorite Wolf Packs got hit today with heavy profit taking and we will have to watch whether the continued rise in the price of a Barrel of Oil to over $133 today is now showing signs of a climax run or just a minor bubble before the big run up finally bursts that bubble.  So that you have a feel for the value of seeing the Kahunas in action, here is the chart of the Dow showing the two Big Kahunas in a row at the bottom right of the chart.  Also note that the Directional Movement and the Bull’s Eye with the %B coming down through the Bandwidth confirms that this is probably not a storm in a tea cup, until we see a quick reversal upwards.

dow Best Regards, Ian.

Critical Short and Long Term Targets for Indexes

Tuesday, May 20th, 2008

In my Overview of the newsletter, I stated two hurdles that the Market Indexes must jump, one short term and the other long term, as follows:

Since the Ides of March when we found a bottom on March 17, we have now bounced on a decent Bear Market Rally to the tune of 11% to 15% depending on the Market Index.  We have weathered the storm for now from back then and are at a critical juncture yet again:

  1. The glass ceiling of getting past the 200-dma is uppermost on our minds.

  2. The 40-period Bollinger Band Chart must see the Indexes above the orange line of the middle BB.  That is the true test of whether all Indexes are fully on the mend.

Here at a glance are the results comparing the status yesterday versus today, with color coding to show which Indexes are well above, barely above, very close or not there yet as shown in Dark Green to Dark Red, respectively: 

comparisons

  • The results were encouraging as of yesterday, but today’s big drop in many Indexes now leaves a lot more work to do before these two hurdles are jumped.  We were so close but yet so far, so never count your chickens before they are hatched!

  • Note how the picture has changed overnight from Mostly Green to a Blinking Red.

  • The Transports lead the pack, the Nasdaq 100 is strong, but the S&P 100 and Russell 2000 are weakest.

  • Yesterday’s market action was promising to begin with and then fizzled at the end, so today we had our second shot across the bow that we are pausing to refresh at least, or a modest pull back…hopefully at worst. 

  • The VIX has not signaled a Little Kahuna but came very close (+0.23), and now we must see if there is a follow through Kahuna.  This will be the next shot across the bow and time to take heed of the potential correction that might ensue…run for temporary cover, and watch for further developments.

  • The Report Card for the favorite leading Wolf Packs is favorable…no signs of major Rotation yet, despite a heavy down day on the DOW.  Beaten Down Groups coming out of the ashes such as Semis, Technology and Home-Builders were all hit yesterday and today. 

  • Worth Watching if market holds – LDK, EME, MEA and CAM  

    Here is the picture on the Industry Groups:

         industries        Best Regards, Ian

Copyright © 2007-2010 Ian Woodward
Disclaimer: Commentaries on this Blog are not to be construed as recommendations to buy or sell the market and/or specific securites. The consumer of the information is responsible for their own investment decisions.