Ian Woodward's Investing Blog

Archive for the ‘Market Analysis’ Category

A Ray of Hope for a Bull Run in a Bear Market

Saturday, April 5th, 2008

Don’t get too excited, but the HGS Investor Seminars invariably lead to a bull run, and it seems that this one just finished last weekend is no exception.  One week does not a Bull Run make, but there are distinct signs that the Market sloughed off the bad news of the rotten jobs report and for the time being we seem to have all Market Indexes flashing “Green”.

bull run

  1. At this stage of events it has to be wishful thinking, but at least there is some encouragement if we are to judge this past week’s progress in the JIRM Index which we developed last weekend for Stocks above $35 which we are using as a yardstick to measure the health of the market.  I featured this in my last blog and you will be pleased to know that it has delivered 6.17% vs the S&P 500 of 4.15% based on equal dollar weighting.  More importantly every single one of the 18 stocks selected is positive.  That suggests that the types of stocks we favor are in the sweet spot.

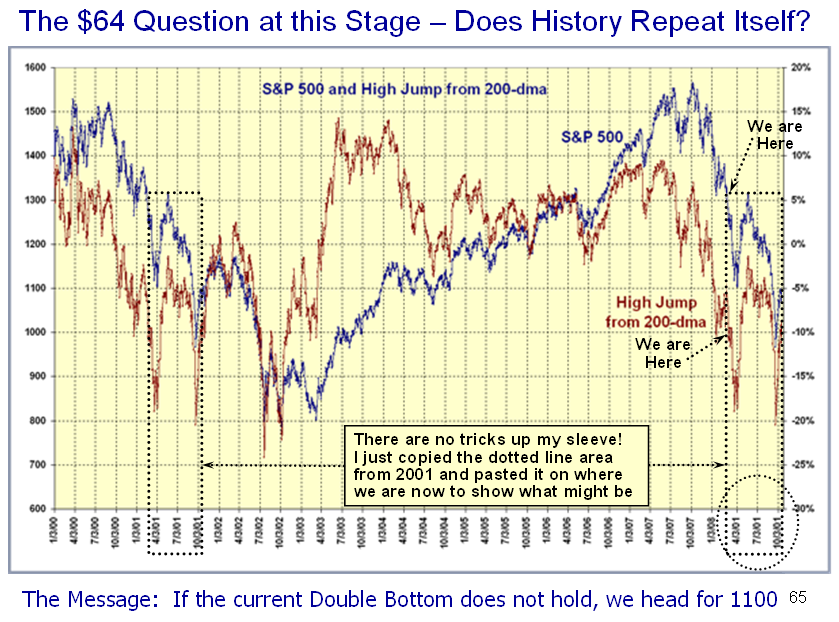
  2. Please understand that a flood of Earnings Reports will be out in another three weeks and that will set the tone for whether we slouch back into a bear condition or that we see some renewed enthusiasm on that front.  As I discussed at length at the seminar, the Earnings are falling from under us at every month’s new surprises such as GM and Sears both taking hits to take the S&P 500 earnings estimates down.  I showed you chapter and verse as to why the S&P 500 touched 1270 and why it could quickly drop to 1150 if we do not quickly see a repair on this front. 

  3. But enough of that, and although Type 1 and 2 traders are already making hay while the sun shines, Type 3 Intermediate term swing traders are wondering if they dare put their toes in the water.  Type 4 Investors are still waiting for more signs of confidence that things are firming and so they should.  A winky-winky is not to neglect those HGS Boxes stocks greater than 0 (and especially Box 7) that timhiggit gave you last week.  Just take an EPS Rank and Grp Rank of 80:80, a A/D greater than or equal to C, Bongo Daily signals that have fired in the last 15 days, and above all a %E/P TTM of >3, and a % Dem/Sup of 0.9 and you have the cream of the crop.  You see newbies…it is not difficult to concoct a potentially winning scenario on the fly using HGSI software.

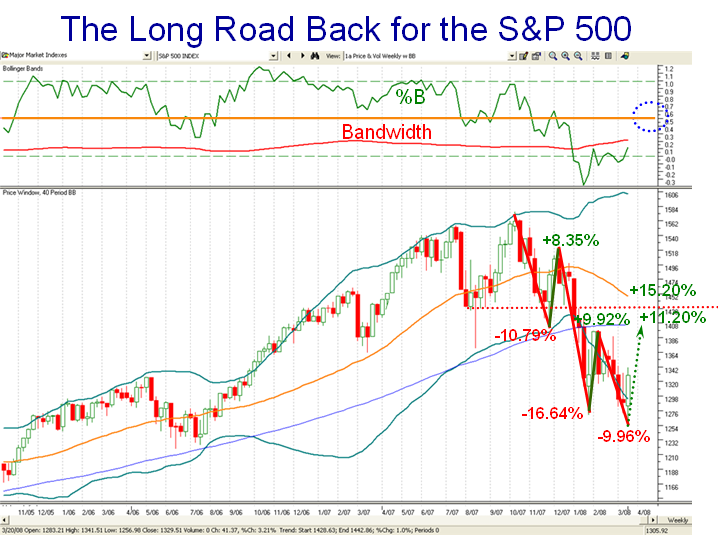
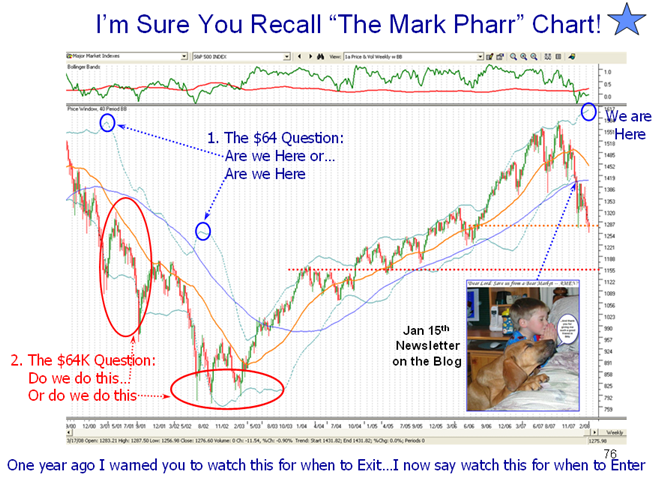
  4. Now let’s move on to a more important matter.  How does one get a handle as to whether this past week was just a flash in the pan or that there is indeed a fresh Bull Run in a Bear Market or whether the ride will fizzle out in a matter of days? In which case we will be back to the same old scenario of three steps forward and two steps back or worse yet the other way around as it has been for several weeks.   I offer you two weapons and three charts for this immediate week to come and they should tell us the story of whether the Bulls or the Bears have the upper hand.  One is the 40 period Bollinger Band Weekly Chart I showed in an earlier blog and also covered with a five point plan in the Newsletter and the Seminar…the famous Mark Pharr Chart.  The other is the jolly old VIX, which has worked well for the short term traders switching from long to short routinely for the last eight months, and has been a dead give away until NOW! 

  5. Given that we had yet another Eureka last week which almost went un-noticed, that Bongos have fired on all Major Indexes, that Industry groups are perking up, and that the New Highs are improving but not very strong as yet…you get the idea, we might have a changing of the guard from the grip of the past several months.  That grip is better seen in the second chart, but more on that in a moment.

sandp 500  If you look on the left hand side of the chart, you can see that one can have a decent bull rally in a Bear Market, which gets turned back at the “orange line of 40 periods.  In the 2000-03 bear market we had 21.8% and 23.8% up legs as shown…so the hope is that we might be on one of those legs.  We will know if it gets turned back if %B gets no higher than about 0.5 say.  In which case, after a decent move we fall back into a bear market mode again as show heading down.  The other scenario is that we are already at the bottom and the momentum picks up to drive %B up to over 0.7 or more in which case we are at the bottom of the Bear market and on a new Bull Run…the wishful thinking scenario.  All of that is shown by the green dotted ovals for you to compare and hopefully agree with my scenario. The message from this chart is that the first item of the five point plan I gave you is already behind us and we have to see if the %B coming up through the bandwidth continues upwards. This next chart shows how you can time your moves to either go long or go short and has worked well for short tern traders for the past eight months.  It has worked like clockwork.vix

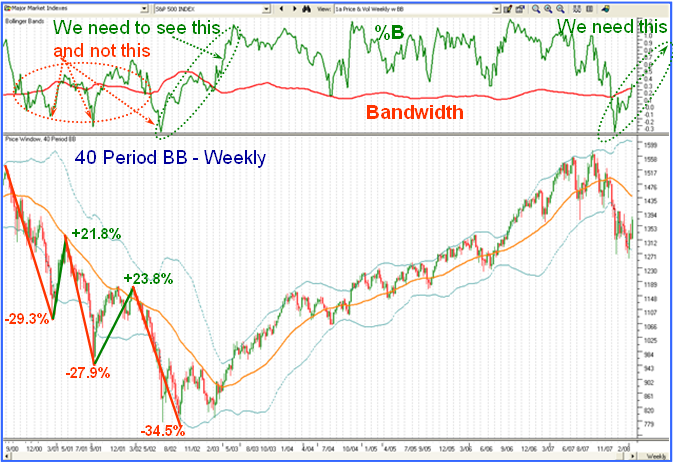
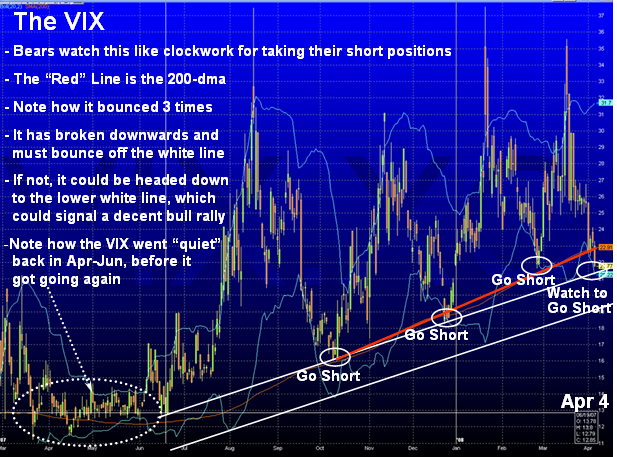
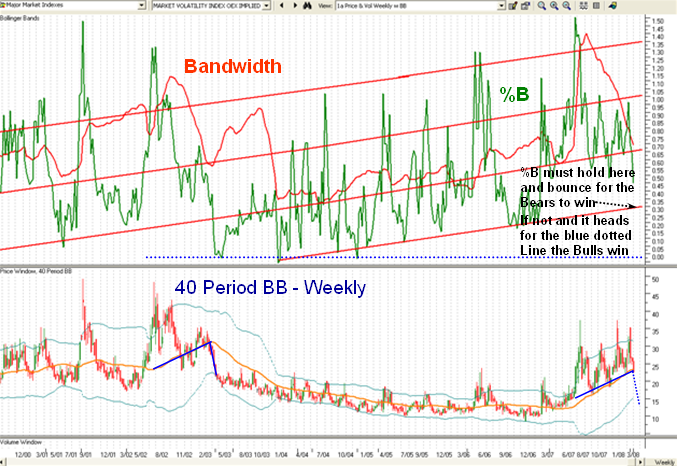
The words on the chart says it all, but if the VIX breaks down badly and heads for the second white line, this may well be a change in sentiment and we could look forward to a decent rally.  Watch for either a bounce in which case the bears are in control again or for a drop in which case there may be a good rally.  Now the way to get a better handle on whether it is one or the other is to look at the VIX compared to the Bollinger Bands, %B and Bandwidth as shown below:

bbs vix The bottom line is to keep a beady eye on the right hand side of the chart and see if what I say on the chart occurs.  Now you have a watertight plan! Best regards, Ian.


Happy Easter Wishes

Sunday, March 23rd, 2008

easter

After a phenomenal week of back and forth last week where we went to and fro 300 to 400 points every day, with all sorts of intervention to try and prop this Market up, let’s hope the Easter Bunny brings us some gifts this week to stabilize the situation.  What can one say when the Market goes down when it should go up and vice-versa…it’s called an unplayable lie while I watch golf on a lazy Sunday afternoon and nothing is falling for Tiger.  It looks like Ogilvy is back after his U.S. Open win.  Well enough of golf, let’s get back to the Mark Pharr Chart, my buddy that I will be seeing this next weekend.

mark Last week I showed you the predicament we had in the Long Road Back for the S&P 500, and here it is in terms of the first and most important hurdle for the Index to get back to some semblance of strength.  As we can see from the percentages down and up from the top, we have not managed to get double digit figures for the Bounce Plays so far.  The first hurdle is to get back up above the 100 Week Average…the blue line, which implies an 11.2% retracement.  The more important hurdle is to get this beast back to the middle Bollinger Band shown with a Blue dotted oval, and that target implies a 15.2% move.  History suggests that is a rare occurrence especially when we are in a bear market which as I showed before resembles what we saw back in the 2000 to 2003 timeframe.   

At any rate, we should learn a lot about the psychology of the Market this coming week.  We should learn whether the medicine the Fed and the Administration doled out last week has turned the corner for the Stock Market or as before we get a small reaction only to fall back into the doldrums.  Please understand that the line in the sand is the Orange Line – the Middle Bollinger Band, i.e., %B at 0.5.  Incidentally, those who are watching Daily and Weekly Bongo should find that most if not all Market Indexes will show “Green” if that happens!  Here are the steps to watch in the coming weeks if we are to see some sort of recovery:

  1. The %B (green line in the Upper Window) must first get above the Bandwidth (red line)
  2. We badly need a Big Kahuna right now, a 0.4% one day change in %B indicating a strong follow through.  At least it should be a Little Kahuna of 0.24.  Don’t tell me you have forgotten all that good stuff I taught you back in 2005.  Better yet, you know that two Kahunas in a row is the ticket for a strong move up.
  3. A minimum of 13% up to get us to the natural resistance of the chart pattern as shown by the dotted red line. 
  4. Anything less than that will suggest to me that the psychology of the Market has not changed and that this is a natural bounce play which then suggests another fall back.
  5. Please understand that Fundamental and Technical Analysts alike have now homed in on two levels to the downside, and I will prove this to you at the seminar.  They are 1260 and 1150 on the downside.  If the Fed has Technical Analysts sharpening their pencils, you can rest assured they told Helicopter Ben to act early last week if they were to salvage this market and stop the bleeding at 1260, period.

I come back to the two important questions I posed in the last blog: 

  1. Are we just starting our way down the long, long road to a severe drop of 30% (Say), or
  2. Are we already finding a bottom as we did back in 2002, and will trundle back and forth for several months before the dust clears and we head back up around the next seminar in October?! 

I gave you five points to look for on the way down on the Mark Pharr chart and now I give you five points to watch on the way back up.  If we break 1257 on the downside all bets are off and we revisit the situation at a lower level.  Don’t forget along the way, you want to see 150 New Highs before you have any assurance that this is not a flash in the pan bounce play. Those of you who understand my process should by now see that Benchmarking using Stakes in the Ground and Measuring Rods provide meaningful targets both for the upside and downside targets and PREVENT you from falling in love with any one scenario by letting the market tell you where it is headed.  By doing it that way with tests-of-reasonableness along the way, you eliminate the inner bias of wishing a scenario rather than letting the Market tell you where it is headed.  Unfortunately, all of us just shake our heads at the experience of last week so it goes without saying “This market is not for the faint of heart”. Best Regards, Ian.


Where Are We? What Do We Do?

Tuesday, March 18th, 2008

where

  1. Those of you who attended the HGS Investor Seminar a year ago will recall the Mark Pharr Chart.  Why did I label it that?  He is a loyal supporter and is a long term buy-and-hold type of the Type 4 variety.  His point to me was “Ian, tell me when to buy and when to sell…I am not a jack in the box type.”  I gave him five steps to watch from the Top of the Bollinger Band and told him that when the S&P 500 Index hit the lower band and %B had gone down through the Bandwidth (in the top window with the green line coming down through the red line), it was TOO LATE. 
  2. Fast forward nine months and in my January 15th newsletter on this blog, the one with the picture shown where the little boy and the dog are praying there won’t be a Bear Market, I mentioned the Mark Pharr Chart as my winky-winky that you all should be doing the same. 
  3. After today’s Fed action and the reaction by the Market to produce 4% up days on the Nasdaq and the S&P 500 and 3.5% on the DOW with a gain of 420 points, obviously the Bears had to scurry to cover their short positions one more time, and wondering what do they have to do to get more than their pound of flesh from the Bulls?  Let’s answer the two questions I posed in the heading of this note:  
  4. Where Are We Now? – This Mark Pharr Chart which is of the S&P 500 with 40 week Bollinger Bands clearly shows that we are at the identical spot (between friends) of where the Upper Bollinger Band is now compared to where it was seven years ago when the Bubble had already burst and the Index was headed down  (shown by the two blue rings at the top of the chart). 
  5. The $64 question is from a bottoming standpoint are we really at the top or half way down the ladder as shown by the blue ring half way down the chart as shown.
  6. The $64,000 Question is do we have one or more legs to go down or are we finding a bottom and will oscillate back and forth going sideways as we did in late 2002 and early 2003, before the start of the long bull rally from 2003 to 2007? (Shown by the two red ellipses)
  7. Only time will tell, but as you see by the Orange and Red dotted lines they correspond to the 1270 mark or the 1150 mark, respectively. 
  8. Where Do We Go From Here? – The answer is easy…You know the routine:  
  9.  Types 1&2 day and moment traders, enjoy the rally as usual but be quick to play the nimble card when the rally peters out.  Since VISA is the biggest IPO we have had in a long while if not ever, and it comes out tomorrow, I should expect the rally to continue at least into Friday when the usual profit taking should set in. (Editor’s Note! Friday is a holiday!  I’m sorry about that, so we have tomorrow to enjoy and watch your step on Thursday.)  Tonight should be yet another humongous Eureka Day, and we have come to understand that these are being manufactured by the irrational exuberance due to the Fed’s actions, whenever they inject some money into the system…the Helicopter Ben syndrome.   
  10.  My good friend Maynard Burstein says the “Wolf Packs are in the following ETF’s: XBD, XLF, IYG, IYF’ XHB, and KBE; all the financials, Brokers, Fin Services, Banks, and even the Home Builders…for a day or two!”  Likewise all the stale and tired 10142007 RonIandex had every stock of 20 up for a gain of 5.1%.  The early bird catches the worm, but watch out for the hawk above. 
  11. Types 3 and 4 sit on your hands and wait for a follow through day and hopefully some signs of the New Highs vs New Lows coming out of the doldrums and driving to at least 70 higher between the two and hopefully 150 New Highs with New Lows less than 50 soon thereafter.   
  12. The longer term depends on what happens to this picture as I also showed in the one I put up the other day on the High Jump picture comparison. 

Best Regards, Ian.

Helicopter Ben is Down, Up and Away Again

Tuesday, March 11th, 2008

ben

  1. U.S. stocks rallied at Tuesday’s start, reversing course after three days of declines, as investors cheered the Federal Reserve’s move to loan as much as $200 billion in securities in a bid to boost liquidity in the financial system.  Can the Fed break the Log Jam and get the banks lending again?  Is there any way to speed up the process of getting a huge amount of Liquidity into the Credit and Mortgage Markets?  The Fed recognizes it has a mess in the Credit Markets.  In another global show of financial force, the Federal Reserve and four other central banks announced significantly expanded loans of cash and securities to banks and securities dealers in an effort to alleviate growing strains in the credit markets. Along with this oversold condition, the Fed and Central Bankers initiated $200 billion injection in cash through loans in order to try and resolve the liquidity crisis this morning.  For the Fed, the steps are yet another attempt to address the credit crisis through means other than steep cuts in short-term interest rates.  But one of the consequences is that its own balance sheet is looking riskier as its composition shifts from super safe Treasury’s to less safe loans, mortgage-backed securities and the like.  This was “perfect timing” that added “high octane fuel” under a historically oversold level. 
  2. Recent market moves have faced “selling into the short term buying” and pit traders will be watching carefully to see if the same reaction will be happening on today’s up move.  They want to see that it can hold, so they are cautiously optimistic.  However, there has to be a screaming follow through and not just for a few days for the sentiment in this market to turn around for a new Bull Rally.  It can turn out to trot up for a few days and then fizzle again for another Bear Trap.  One has only to look at the beaten down FXP…the Chinese reverse ETF, which was down over 17% today to see that they were buying back the same beaten down stocks for a quick pop. 
  3. Too much damage has been done for this to turn into a “V” bottom, but time will tell.  Please recognize that we had a paltry 7 New Highs yesterday, and 26 today, so that is certainly not much to write home about.  I may be watching the wrong Barn Door, but I need to see some re-assurance that the Bulls are in earnest and show their irrational exuberance for more than a couple of days.  Anyway, the Bulls can’t look at a Gift Horse in the mouth, and at least there is some respite from what seemed to be an inevitable spiral downwards.    As usual, the timing couldn’t have been better and the Bears must be scratching their heads as to what they have to do other than to scurry to cover their short positions every now and then when Uncle Ben comes by in his Helicopter dropping his leaflets.  At least it seems they are now thinking out of the box and have begun to realize that the age old tactics of reducing Interest rates is like a wet squib that has done little but slaughter the dollar and exacerbate the inflation problems.  Type 1&2 traders enjoy the respite, but Type 3&4 Longer Term Investors still need to keep their powder dry.

Best Regards, Ian

Where Are We Headed #2?

Sunday, March 9th, 2008

U.S. stocks were hammered Friday, pushing the Dow industrials to their lowest close since Oct. 11, 2006, after February’s unemployment report cemented thinking of a recession and central bank moves to stem the credit crunch failed to offset the damage. 

 captain         

  • “Folks, based on today’s employment report, if we are not in a recession, it is a darned good imitation of one; we are in an unprecedented real estate and credit crisis that is whipping its way through the U.S. economy,” said Kevin Giddis, managing director, fixed income trading, Morgan Keegan & Co. Dow Jones Industrial Average declined 146.70 points to 11,893.69, giving it a weekly loss of 3%. Since the year began, the blue-chip index has lost more than 1,370 points, declining 10% in value. We are close to a Bear Market with a -18.05% drop from the High on 10/31/2007 to the recent low.  My last blog suggested that if we do not hold at 2203 on the Nasdaq we would trundle down to -30% at 2010, and next week is the final chance for the Bulls to hold the goal-line.   
  • At times like these, I revert to my most trusted tool which I call the High Jump, or in this case since the Index is BELOW the 200-dma I refer to it as the Limbo Bar.  It is the % from the 200-dma to the High of the Index, which as you will see from the snapshot below we are currently down -10% and at a critical point based on past history for the S&P 500 looking back to the Major Bear Market from 2000 to 2002.  In staring at the chart below, I couldn’t help but ask if what I see is a coincidence or another case of History does repeat itself in different but similar ways.


    high jump

  • With that said, I overlaid the next three months of the 2001 dip down to -20% on the Limbo Bar on top of where we are currently and this is what the picture looks like.  It is uncanny to my mind, and although I am not for one moment wishing this on us, it is a wake up call that if the Bulls do not hold here at the current Double Bottom, we are headed down to 1100 before we might see a proper Bounce Play:       

    high 2   

  • For those of you who are not too familiar with the Value of the High Jump or Limbo Bar, I refer you to the Blog “HGS Investing Principles – The 405 Freeway” written on December 2, 2007, where I discuss this valuable tool when the market is headed for extremes, either Tops or Bottoms.

Best Regards, Ian.

Copyright © 2007-2010 Ian Woodward
Disclaimer: Commentaries on this Blog are not to be construed as recommendations to buy or sell the market and/or specific securites. The consumer of the information is responsible for their own investment decisions.