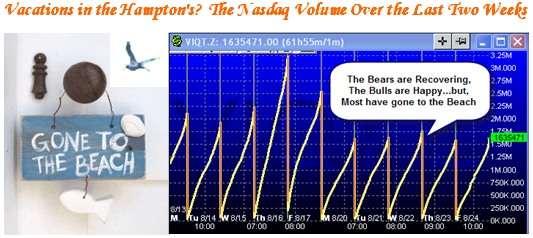
We are in the peak vacation period and much of that is evident in the volume traded this week.
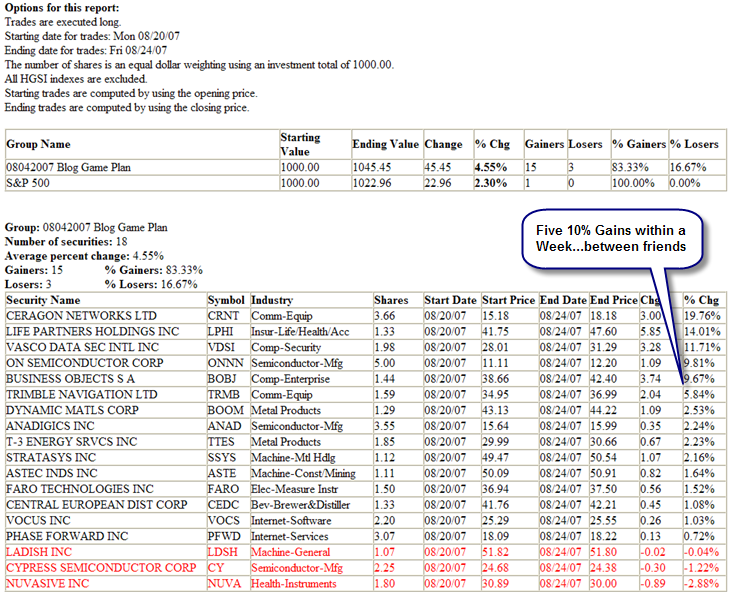
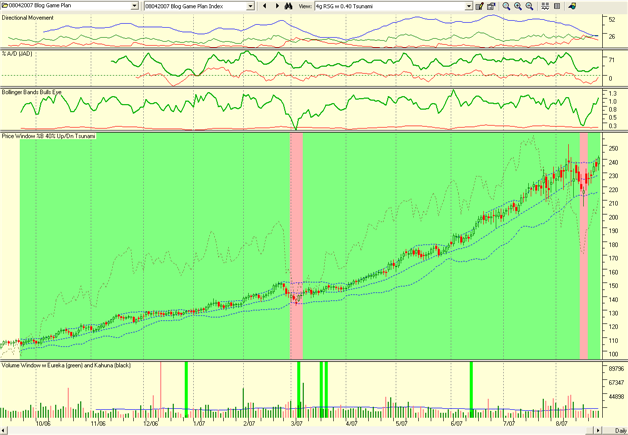
A week ago last Thursday, we had a roller coaster ride in the Stock Market and then on Friday we got a respite from an even bigger drop when the FED lowered the Discount Rate at the Window! This week the markets calmed down with a decent bounce but on light volume. The picture above shows how the NASDAQ volume fell off these past five days compared to last week. Much of the early volume was short covering, but I must say that the surprising aspect to me is the recovery of the stronger stocks as exemplified by the Game Plan 18 stocks I gave you over two weeks ago to watch. These are pedigreed stocks and they have shown their resilience in this see-saw market:
The bottom line from this past week is that round one goes to the FED in settling the Market jitters. But what do we see for the immediate future… I’m sure you ask? It’s not difficult to present both sides of the coin to make a judgment call as to what to expect. But first, we need a recap:
- As I warned last week the tom-toms are beating that a Recession is now the major concern.
- The odds of two consecutive qtrs. of negative real GDP growth is 7% in 2007 and 32% in ’08
- The pressure is on for the FED to lower the Fed Funds Rate.
- The FED will hold their annual retreat in Jackson Hole next weekend…key subject, Housing.
- I say again that the market is in the process of baking in a cut in rates.
- Labor Day is just a week away, and the odds are the DJIA will be up next week by about 0.5%
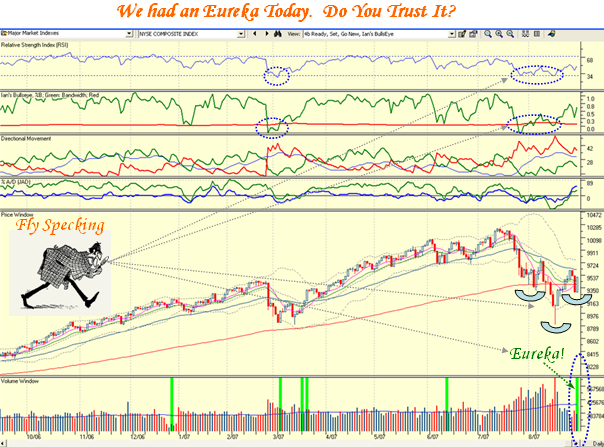
- The Bounce Play has been reasonable so far compared to the targets I set last week
- Index Criteria Low Target Actual % Up
- The S&P 500 above the 50-dma 1371 1485 1479 7.9%
- The NYSE back to 8812 9750 9607 9.0%
- The NASDAQ must get back to 2387 2575 2577 8.0%
- The DOW needs to get back to 13209 13400 13379 1.3%
9. With the heavy pounding the Market took the week before this past week, do not expect any major change in the number of New Highs in the NYSE next week. We need to see around 100 New Highs to 50 New Lows for a 2:1 ratio, before we begin to see repair on this score. Although the New Lows have arrested at about 50/day, the new Highs are around 25/day, so we have a 2:1 ratio in the opposite direction at present.
The bottom line is the results are close enough for Government Work that the intent of a decent bounce was met. I would feel more comfortable with a 10% cushion on the first three Indexes, as this would give us a reasonable chance that the retest under NORMAL circumstances, (meaning no more adverse surprises of a Loans fiasco) will hold at or above the current lows.
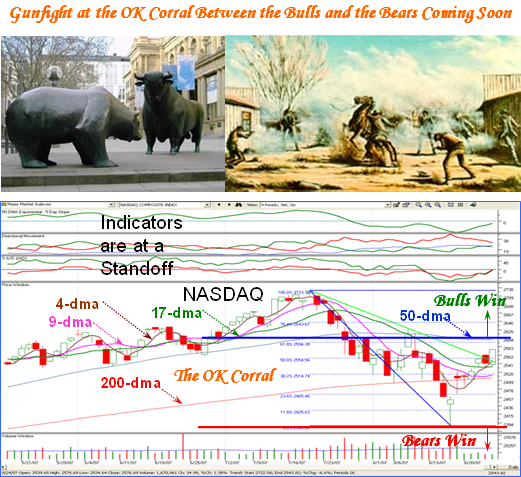
The Case for the Bulls:
-
The FED has sent a strong signal to the Market it will defend against illiquidity and market chaos. It should act at the next FOMC meeting to reduce the Fed Interest Rate.
-
Corporate Earnings remain strong (even Ketchup is selling well…a good Heinz EPS report)
-
Mergers and Acquisitions are still active, but not hot as it was a few weeks ago…liquidity?
-
Corporations are buying back their shares, so they feel they are cheap.
-
There seems to be a baton pass from the Financials to Technology, Telecom and HealthCare.
-
With %B of the Bollinger Bands mostly above 0.7 (70%), these Indexes are healthier now.
-
Unless there is a catastrophic negative surprise and down day, that %B gives a cushion to act.
-
U.S. Job’s growth is still positive, and GDP will continue to grow on average at around 2.5%
-
The inflation (CPI) is not expected to rise above 3.25% by the 4th qtr. and then decline in 2008
-
The S&P 500 P-E is at a reasonable value below 16, which is not the 32 we had in 2000.
The Case for the Bears:
-
V bottoms are very rare and so we can expect a retrace to test the lows.
-
Where’s the Beef – the volume has been relatively low and primarily short covering this week
-
Given the Fed’s intervention, this has been a tepid bounce and it is time to see a retrace soon.
-
Most Indexes have only just got back to around their 50-dma and this provides resistance.
-
The other shoe has to drop by way of another surprise on Hedge Funds, Mortgages, Carry Trades, Illiquidity, etc. etc. We haven’t seen a bottom in Housing yet.
-
The Shanghai Composite is an accident waiting to happen and has a steeper rise to 5000 than the NASDAQ did back in 2000. That could cause a perturbation in Global Markets.
-
The low volume this past week shows there is no conviction by the Bulls and there is more on the downside, with several stocks at head and shoulders tops at the 50-dma or at double tops.
-
General David Patreaus is due back on Capitol Hill with his report on Iraq and that may cause a flurry of discussion between both parties in Congress and stir up the pot in affecting the Markets.
With regard to the low Volume: Do not be too quick to brush aside the low volume this past week. It is all relative to the times. After all, just look back to this time last year and you will:
-
See a similar seasonal fall off in volume on the NASDAQ
-
Recognize that this week’s volume is actually higher than the same week a year ago, i.e., 8.7 billion shares traded compared to 8.2 billion.
-
Not get too hung up on volume; last year for this coming week the volume was only 6.5 billion.
-
Find the Avg. Daily Volume these days is automatically expected to be >2.3 Billion due in part to the sell off in the Market. Last year we were happy with 1.8 Billion for a strong volume day.
As my caption says they are all on vacation at the beach in the Hampton’s. Watch the market action to see if the Indexes can repair above their 50-dma and above their Upper Bollinger Band and if they can, the re-test to come will in all probability not take out the current lows. The only caveat is a negative surprise, which can always throw a spanner in the works at any time. I say again, I am pleasantly surprised to see the Game Plan Index still strong. Likewise, there are many 10% winners each week in the SmartGroups and StockPicker Groups. Do your homework. Best Regards, Ian
 Ian Woodward's Investing Blog