Ian Woodward's Investing Blog

Stock Market: Sectors Starting to Droop

February 10th, 2013

It goes without saying that all of us are on our toes watching with our favorite methods of reading the tea leafs for any major sign of a rollover in the Market, but except for a wiggle here and a waggle there, the Market Indexes continue to make new highs albiet at a snail’s pace as I will show you.  We need a pogo stick big jump to the upside…hopeful thinking!

Pogo Picture

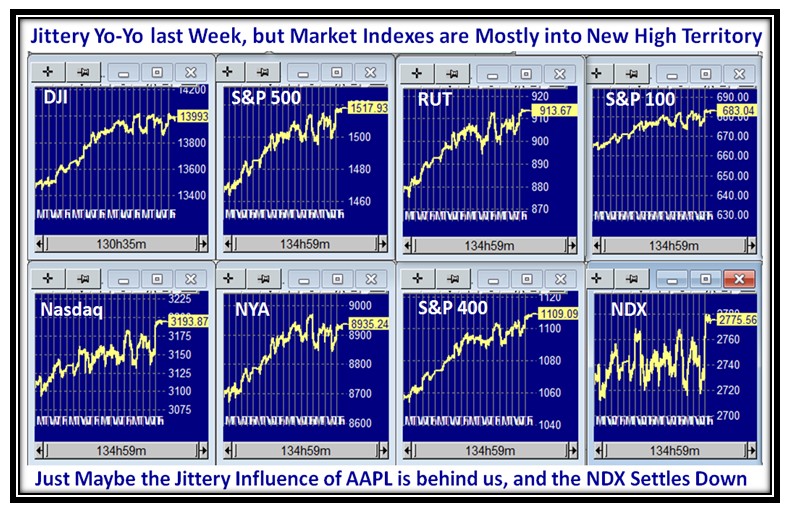
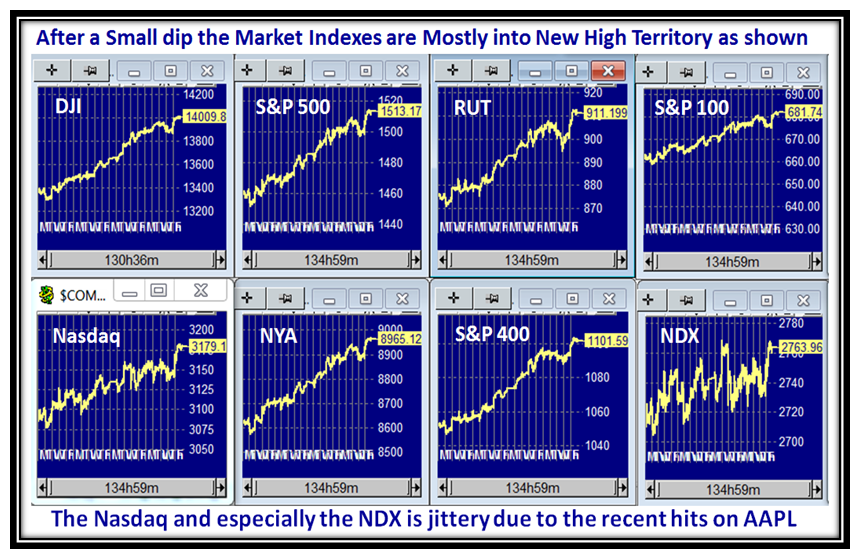
Still, the beat goes on and although the next slide of the Market Indexes shows the Yo-Yo we tolerated this past week , many of these Indexes finished into New High Territory over the past ten days (say).  With a glimmer of sunshine on the AAPL front, maybe the worst is behind on the NDX Big Caps Index which stands out as hopping around on a pogo stick:

Pogo Indexes

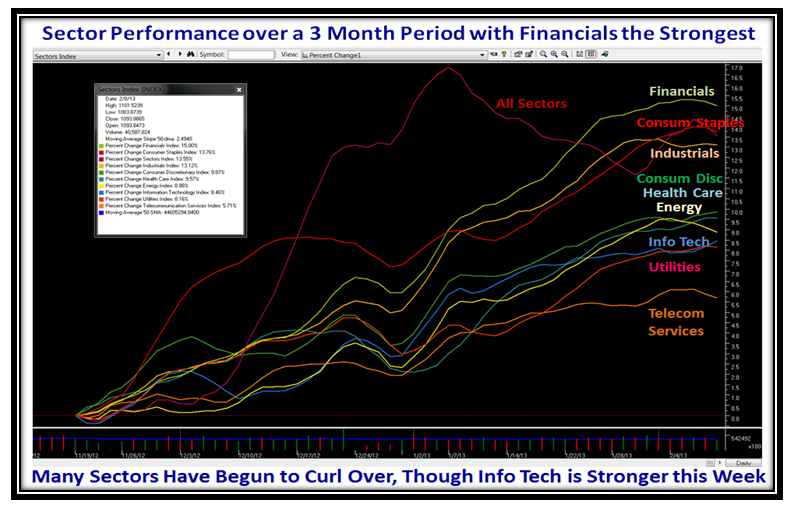
Earl reminded me a couple of weeks ago that the Financial Sector was moving very well, so I felt it was time to show off another powerful feature of the HGSI Software, which shows the % Price Change for the various Sectors below.  The picture shows the performance in the last three months, and true to form the Financials are the best.  If we want to be real picky, there are the first signs of turning down this past week, but that is not enough to call the top, especially as at least three of the Sectors are still turning upwards,  Information Technology, Health Care and Consumer Discretionary.

Pogo Sectors

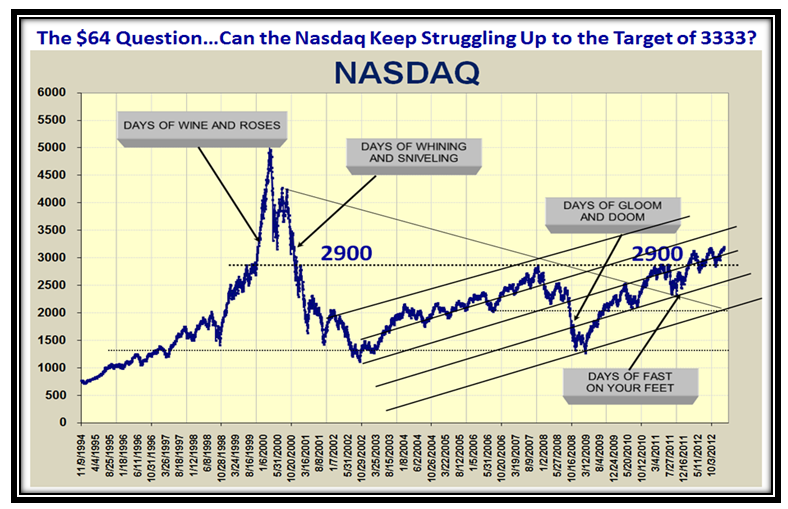
I am still rooting for a move on the Nasdaq to 3333 as I featured in the last two blog notes, and update this information again for your perusal a couple of slides later.  Meanwhile the NASDAQ inches up slowly as shown below thanks to my good friend Mike Scott, who has faitfully kept me up to date on his findings for the past 20 Years:

Pogo Nasdaq

We avidly follow Tom McClellan’s good work, and recently he had a snippet that caught my eye…”Before late 2007, the “9-month cycle had an average period of about 185 trading days.  Since then, it has been between 156 and 168 trading days (8 months).”  By the way, 185 Trading Days (9 months) equates to Feb 27, and that is mightly close to the next Big Cliff we are headed for relating to Sequestration on March 1, so if the Big Guns decide to prop this Market up until then, that is something to bear in mind.

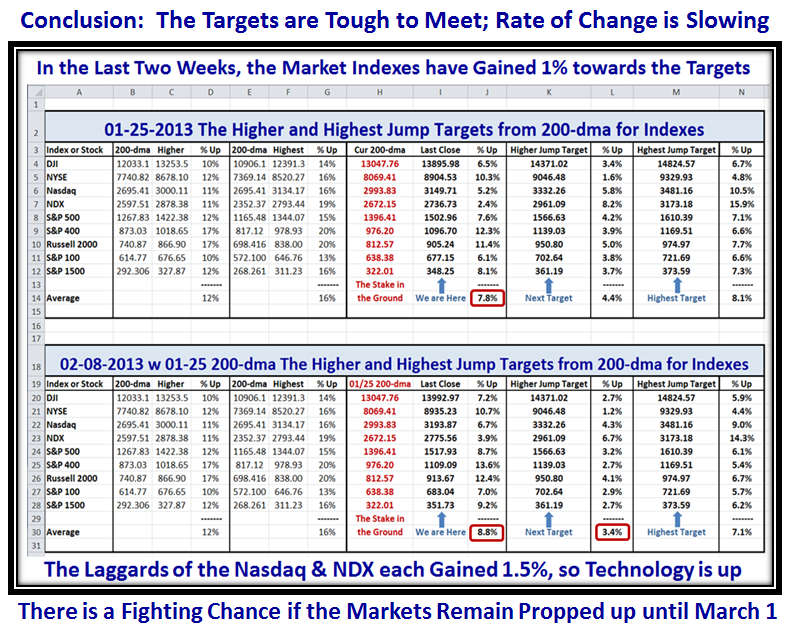
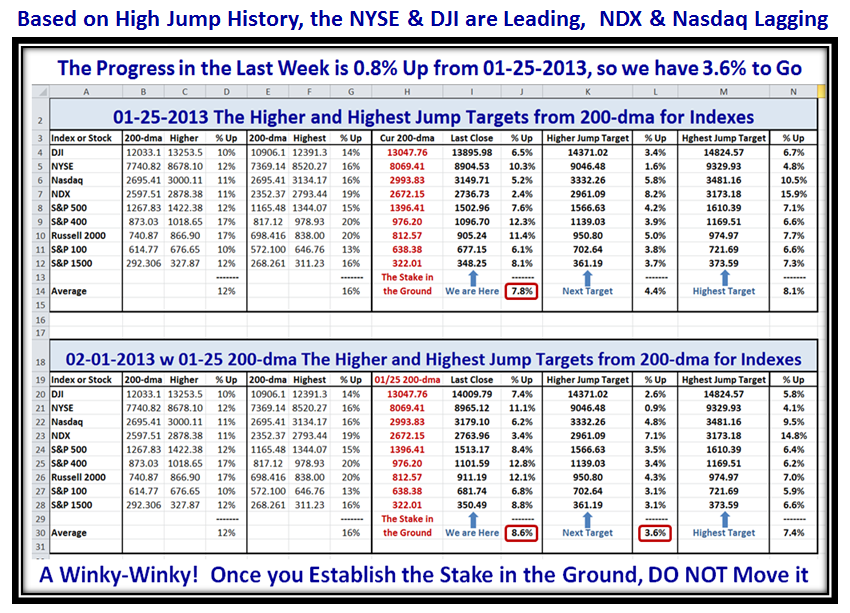
Now we come to the Targets I set on 1/25/2013, and the updated results since then.  We have inched up on the Targets to the tune of 1% over two weeks, with 0.8% up the previous week and only 0.2% this past week.   We are now only 3.4% away from the Targets for the Higher Jump, but we will need a pogo stick jump up in the Markets if we are to make them within the next three weeks.  I call this the High Road Scenario, and sometimes wonders never cease in these tricky times:

Pogo Targets

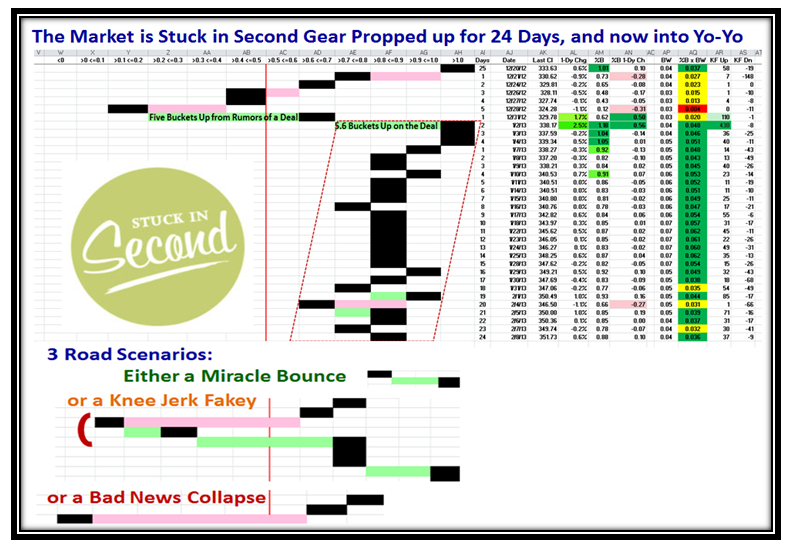
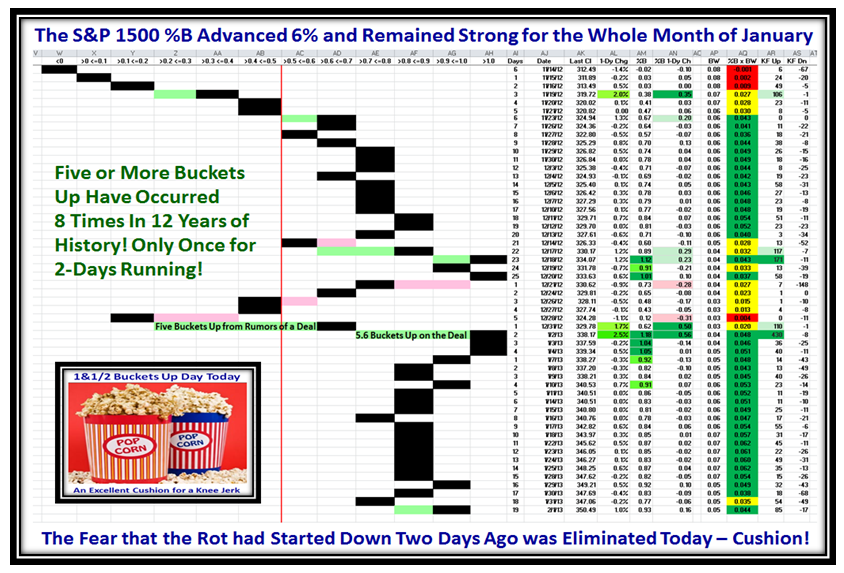
Let’s take a look at the Buckets and as we would expect, the Market is stuck in second gear and has been well propped up for the past 24 trading days which is now getting long in the tooth compared with previous big jumps as posted back at the start of this year as shown on the chart below.  So we wait patiently for one of the three main scenarios to evolve in the fullness of time as I show in this next chart:

Pogo Pat2

I hope that refines the basic concepts I have given you this past month to watch carefully for any signs of a disaster, which is not evident as yet, so keep playing and let the Market tell you which Road it is on!

Best Regards…only 6 weeks to the March Seminar so get cracking and sign up.

Ian.

Stock Market: Stay on Your Toes!

February 7th, 2013

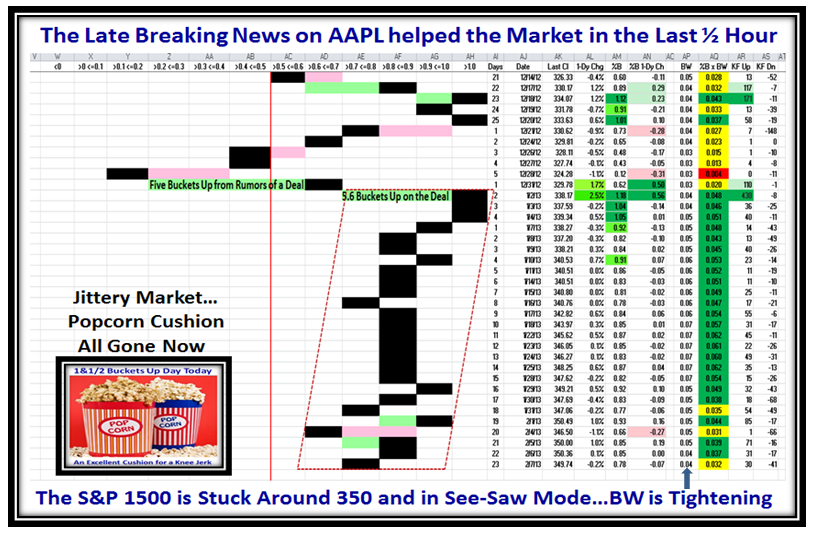
The See-Saw in the Market Indexes the last few days after a month of Price gains to New Highs suggests that unless we see another major push upwards, the path of least resistance is downwards.  However, the Big Guns are still propping this Market up, as witnessed by today’s action where AAPL shot up in the last 25 minutes of the day and pulled all Market Indexes up to a ho-hum day and just a few points down, when it could have been much worse.

Toes Picture

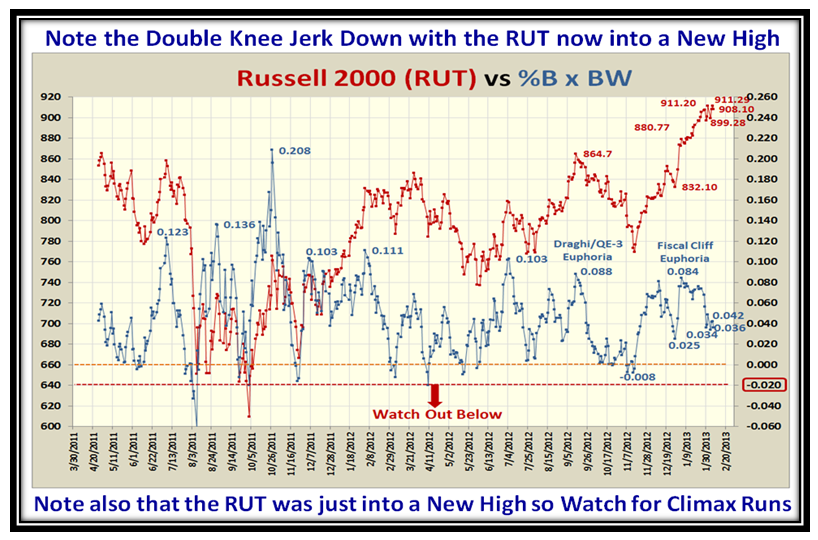
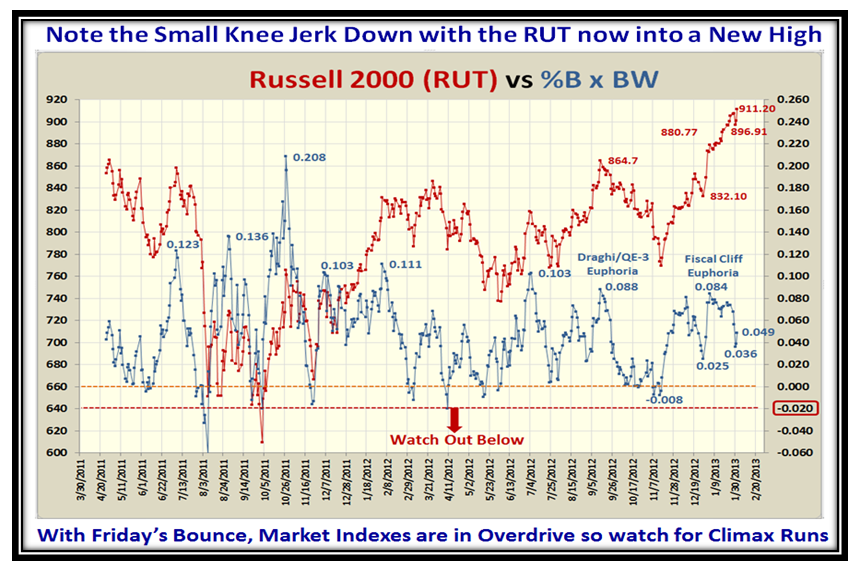
The Russell 2000 (RUT) has been one of the leading Market Indexes, and seems to be stalling at the 911 level.

Toes RUT

As you well know, the market has run up for the past month of trading days, but as you can see this past week or so we see the jittery nature and at this point we are at that vulnerable stage of getting a knee jerk down:

Toes Pat2

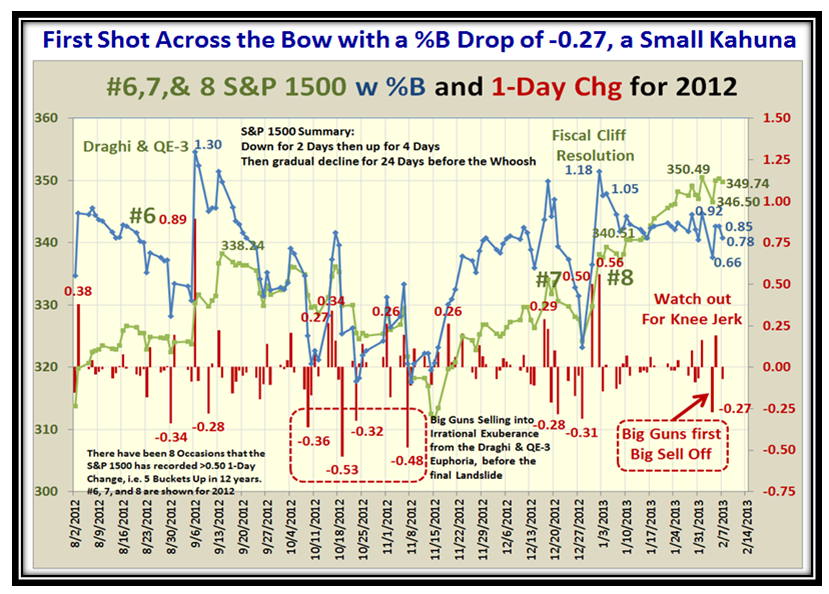
As I warned you to look for, we had our first shot across the bow with a small Kahuna+ down (-0.27), while the Market is still being propped up:

Toes #8

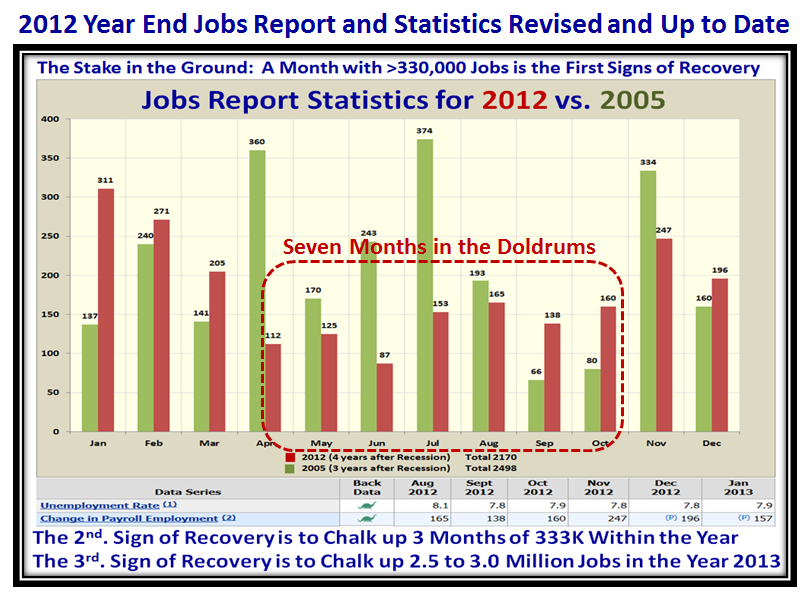
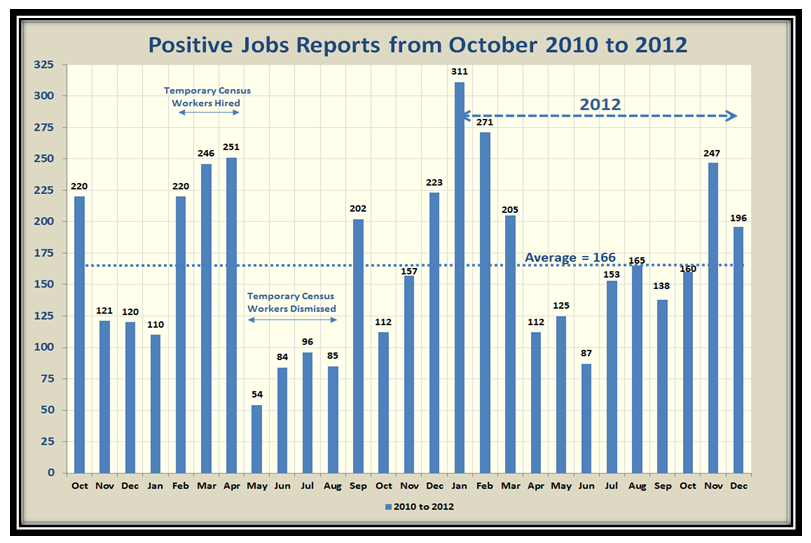
For the record the next two slides show the updated Jobs Report Numbers revised for the whole year.

Toes Jobs1

Toes Jobs2

Today’s news on Jobs indicate that “Jobless claims point to healing in labor market”…

(Reuters) – The number of Americans filing new claims for jobless benefits fell last week and a trend reading hit a near five-year low, signs a grinding recovery in the labor market remains on track.

Best Regards,

Ian.

Stock Market: Indexes are in Overdrive!

February 3rd, 2013

My good friend, Mike Scott used this very apt term to describe the current state of the Market, so that is my heading for today.

Overdrive Picture

We had a whiff of the Middle Road Scenario with a very small knee jerk last week, but that was all eradicated on Friday which took the DJI into 14,000 territory and most of the Market Indexes still heading up into new Highs:

Overdrive Indexes

…And here is the Russell 2000 (RUT) to show that small knee jerk, followed by the powerful move on Friday, kept the cushion intact for a possible big bucket down day.  Now the Bulls have their cake and can eat it too should the Big Guns start to unload:

Overdrive RUT

…Right on time, we got close to 2 Buckets up of pop-corn, so the previous two days downward action are negated:

Overdrive Pat2

So the beat goes on and we are now back on the High Road Scenario, where many were shaken out but we stood firm and tall:

Overdrive Scenarios

Nobody knows whether we will be on the High Road Scenario for a day, two days, a week or a month, but now the job is to measure from “whence we came” and where our next targets sit.  You’ve got it, ALWAYS turn to the High Jump at this stage.  We can see that we have progressed 0.8% of the 4% I said over a week ago for the Indexes to hit a 4% rise from 1/25/2013 for the High Road Scenario.  If you have become a believer in this approach, then my Winky-Winky for today is unlike the Super Bowl which will start in another hour and a half, DO NOT move the STAKE!  This following picture kills several birds with one stone.  It not only shows which Indexes are leading or lagging, but also what the progress has been since the last measurement and how much further to go to reach the next rung up the ladder.  If you keep moving the Stake each week, then you don’t have a feel for progress.  More importantly, since the 200-dma will also move up, the Targets move up somewhat with it, and therefore it’s in effect exagerating the catch up required from when you first took the measurement.

Overdrive High Jump

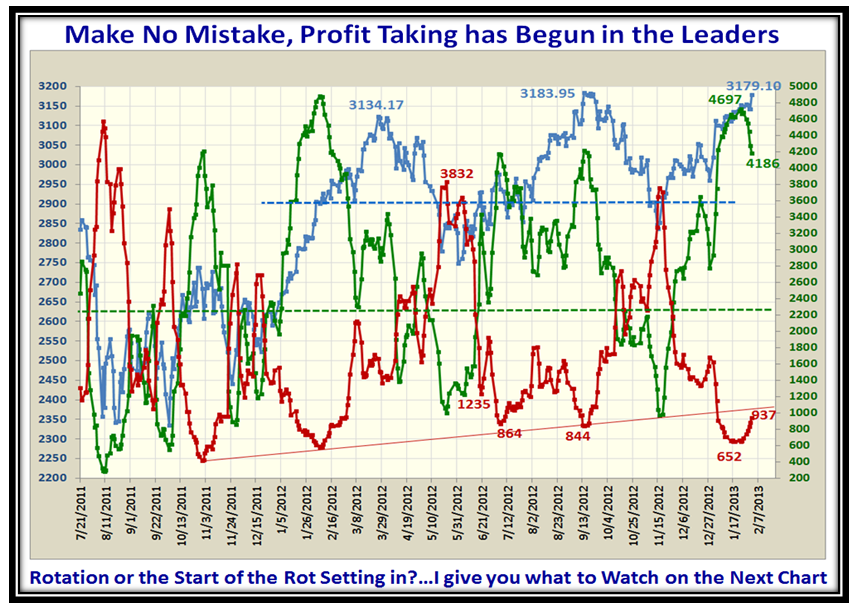
Your homework is not done.  We have only worked the positive side of the equation.  Now we must spot the divergencies.  The first one is to watch the Accumulation vs. Distribution situation and as one would begin to expect there are now the first signs of deterioration in the ratio.  The Accumulation has begun to turn down and naturally the Distribution has started to curl up:

Overdrive Acc

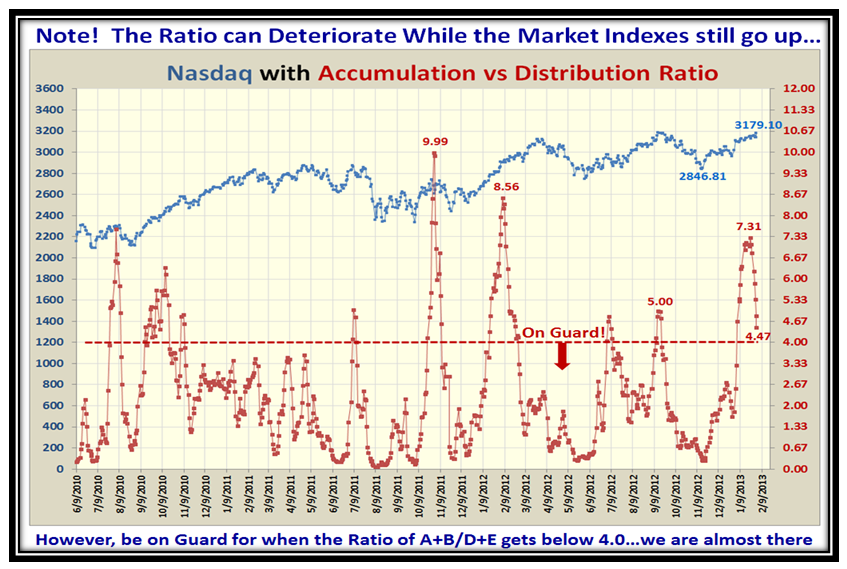
Now note the Ratio…Close to the On Guard Line, but this can still go down further before the Nasdaq corrects:

Overdrive Ratio

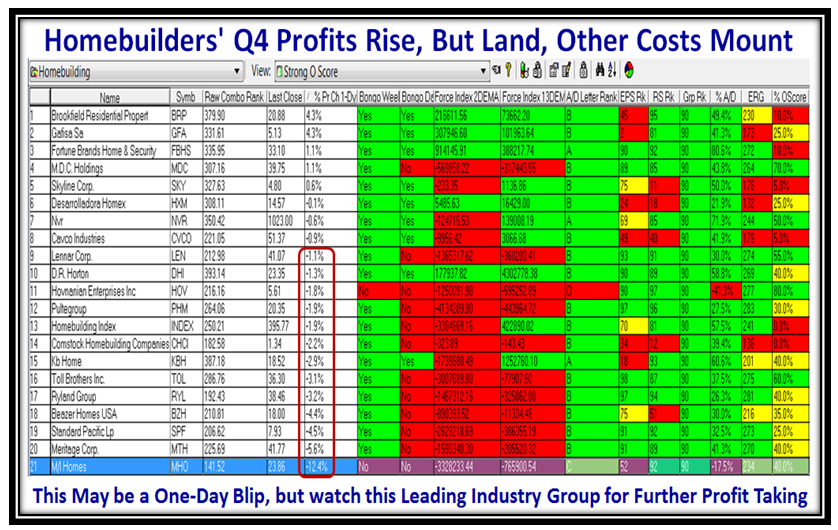
Now. let’s look for other possible deterioration, and bring the power of the HGSI Software into Play.  Friday was an unusual day for the Homebuilder Industry Group. The Industry Group was down 1.9%, the second worst on the day with Leisure Facilities at the bottom with -4.8%.  PulteGroup (PHM), Meritage Homes (MTH), MDC (MDC) and MI Homes (MHO) reported fourth-quarter earnings early, with Standard Pacific (SPF) out after the closing bell. All are benefiting from a gradually improving economy, low interest rates and a constrained supply of new homes.

Rising land prices, costs associated with buy-back reserves for bad loans from the housing boom and other costs pose a challenge.

Overdrive Homebuilders

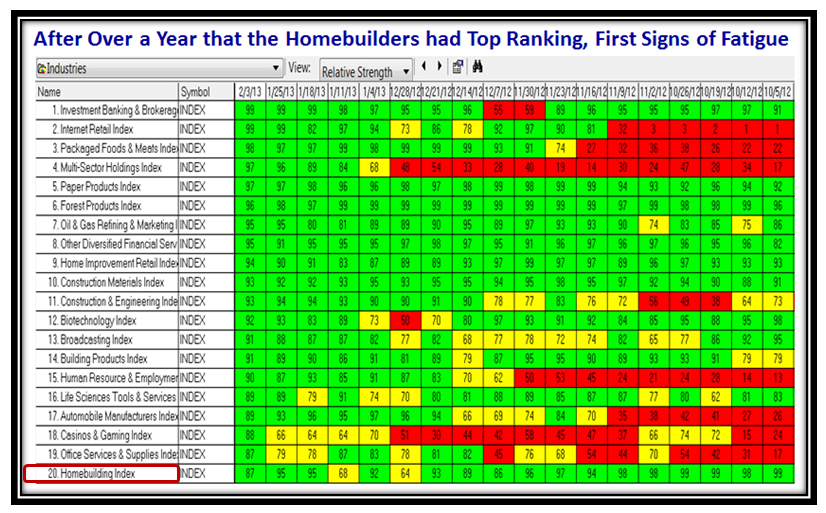
…And now let’s look at the Ranking Module and we begin to see some deterioration…it’s only natural as this Group has been top ranked for all of 13 months with colossal Price gains.  The question is whether this was a one day hiccup or rotation out to come?

Overdrive Homebuilders2

Now the homework is done and it’s time to settle back, put my feet up and enjoy the Super Bowl!

Best Regards,

Ian.

How High the Moon…Follow Up

January 27th, 2013

Thanks to those who gave me comments, including Charlie who is looking for a Winky Winky handed to him on a Platter.  Charlie Wrote:

Charlie Willey Says: January 27th, 2013 at 6:43 am   edit

Ian – Thanks for the multiple scenarios you send along with your discussions.  You provide much stimulus for thought on this end.  Still, you stay ahead of me.  But I know to look for the little ‘winky-winkies’ along the way and sooner or later I say, “There’s one, oh, and there’s another.”

– Charlie Willey

Charlie, I gave it right there for you to decipher, but the question for you is “Do you have the stomach to watch the Markets all trot down five buckets and you are prepared to sit and wait one more day?”  Now it’s a case of your stomach, and only you can know that.  Sad to say that you must wait one more day to know whether History Repeats itself for the 3rd. Year in a row or this time on the day after the Indexes all head down 5 buckets (say), it goes down further.  Don’t curse at me and say “Coulda, shoulda, woulda” old buddy.  So the choices are simple:

1.  If you have a weak stomach and want to preserve capital even if it is a Fakey, you take it OFF during that very bad day or

2. You say, no I will give it only one more morning to see if the markets bounce back that next day:

a. If they bounce up one bucket, you stay to watch the next day and with luck you breathe a sigh of relief and the market hops back up one bucket and then four buckets as it did in both 2011 and 2012 and you have not been faked out, or

b.  It continues to trot on down and you know this is no Fakey, and you better run for the hills or turn to shorting.

Now you are saying “Come on Ian, where on earth did you conjure up that Winky-Winky?” and I say sometimes I want you do some homework, because in this case we are talking about stomachs and NOT MARKETS and I have drummed it into your heads “Every stomach is different”…and that is what the Big Guns prey on!  Just stare at this chart and you will see the tea leaves tell you what I have just told you:

Moon Pat 2b

I’m sorry I didn’t paint the upper bounce green for the next day after the big 5 bucket drop in 2011, but you can see that in both cases they bounced UP one bucket and then a hefty 4 Buckets the following day.  Coincidence you say,  I say fine, but that is all I need for a clue.   It’s called Reading the Tea Leafs as well as enjoying the tea…the bigger picture related to Fear and Greed.

Now Charlie, I am still waiting for that 3rd. Million, and sad to say no one has sent me that yet!  They all say they are still working on that 2nd Million for their wife!

Best of luck,

Ian.

Stock Market: How High the Moon? Game Plan

January 26th, 2013

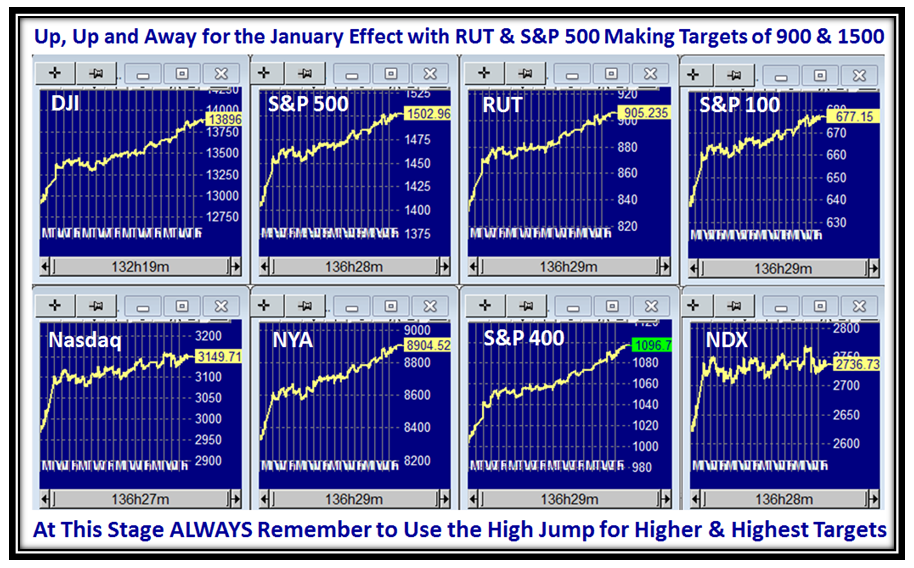
Having achieved the recent Targets of 1500 on the S&P 500 and 900 on the Russell 2000 (RUT), the question on all our minds is “Now What?”  I hope the picture below hits a chord with you as we try to make sense of where the Stock Market is headed:

Moon Picture

Here is the latest picture of how the Market Indexes keep heading up into new highs, week after week, slowly but surely:

Moon Indexes

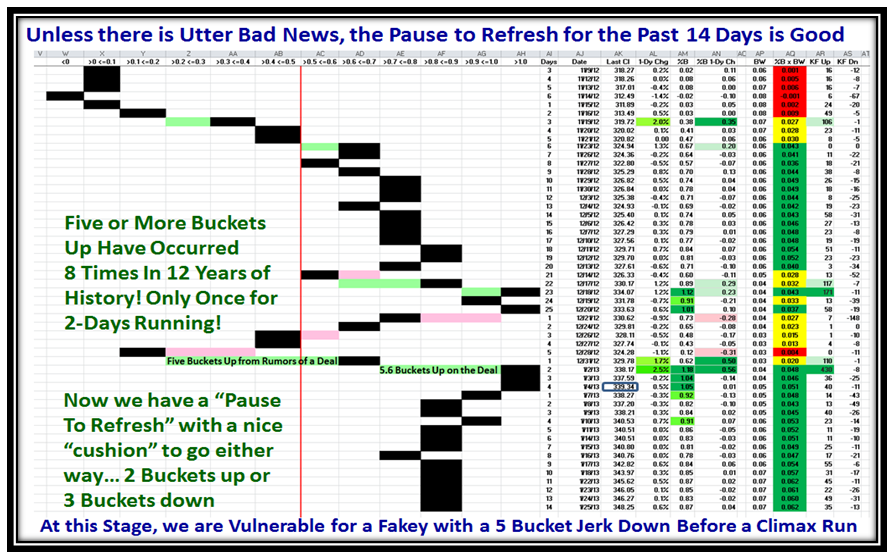
It is interesting that while the Indexes have inched up the %B is stuck in 2nd gear but healthy at between 0.8 to 0.9 for all of two weeks.  That gives us some comfort in that we have a cushion for even a five bucket knee jerk but still have room to trot up:

Moon Pat 2

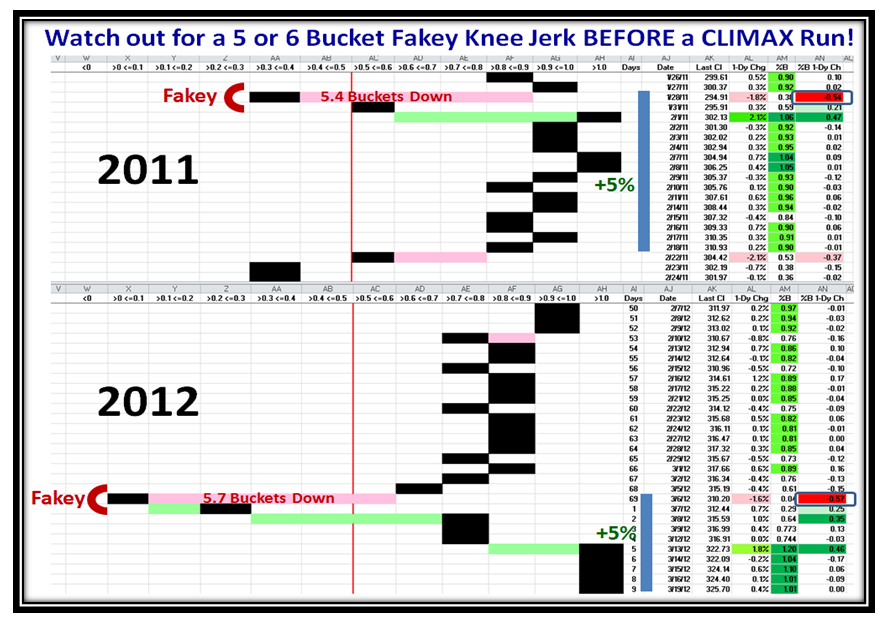
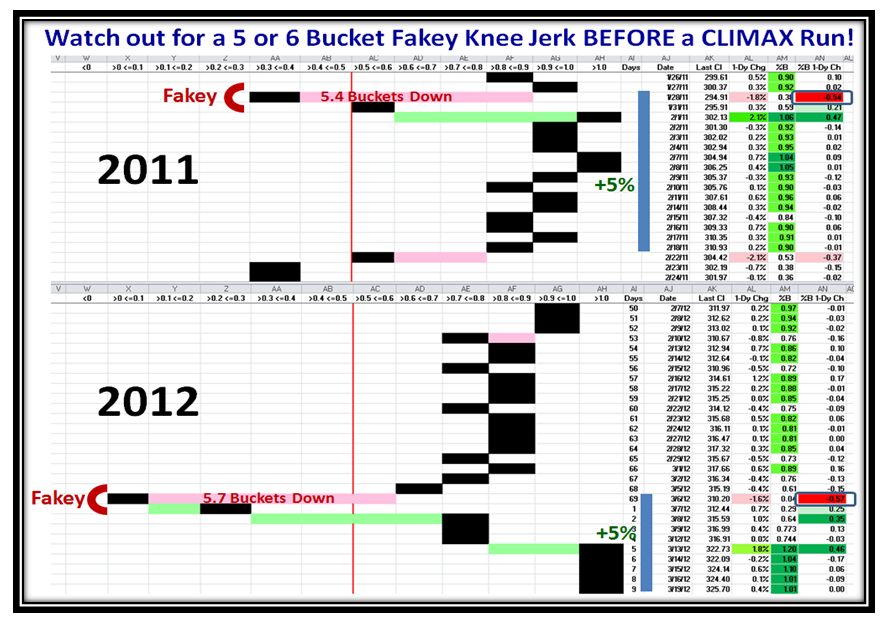
The unusual pattern these last two weeks led me to look back to 2011 and 2012 at around this time of the year, and I may have struck oil.  Not only did I find a similar pattern, but also noticed that on both occasions we had a Five Bucket Knee Jerk down that turned out to be a Fakey of just a day or two before the Market shot back up to go on to new highs!  I know the old swan song that History seldom repeats itself, but at least it has become one of the Three Road Scenarios I will leave you with and in my usual manner I borrow “snippets from the past” to put on the present to show you what might happen should this phenomenon occur  for the 3rd year in a row.  I am not suggesting it is the expected scenario, but my point is to not be too quick to count your chickens that the market is headed down.

Moon Pat 2b

Please also note the similarity of heading back up to the tune of a 5% Gain in the Index Price after the Fakey, which happens to be approximately what one would look for to reach the next level of targets which my work on the High Jump will show you.

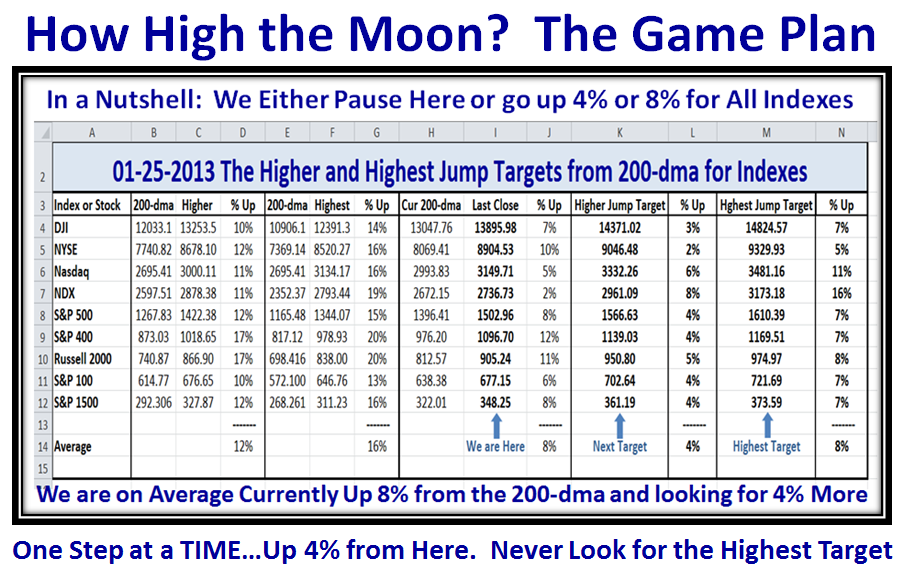
When things reach such peakiness, I ALWAYS turn to my trusty High Jump Tool to guide me of what are REASONABLE Targets, particularly for the Market Indexes.  In the following chart I have developed Past Higher and Highest results for the 200-dma to the price of the Indexes, and then applied these to the Current Last close as shown in the Middle Column to get the Higher and Highest Targets going forward.  Whether this unfolds this way is in the lap of the gods, but at least it sets reasonable goals of when enough is enough for you to think about running for the hills or shorting the Market:

Moon Game Plan

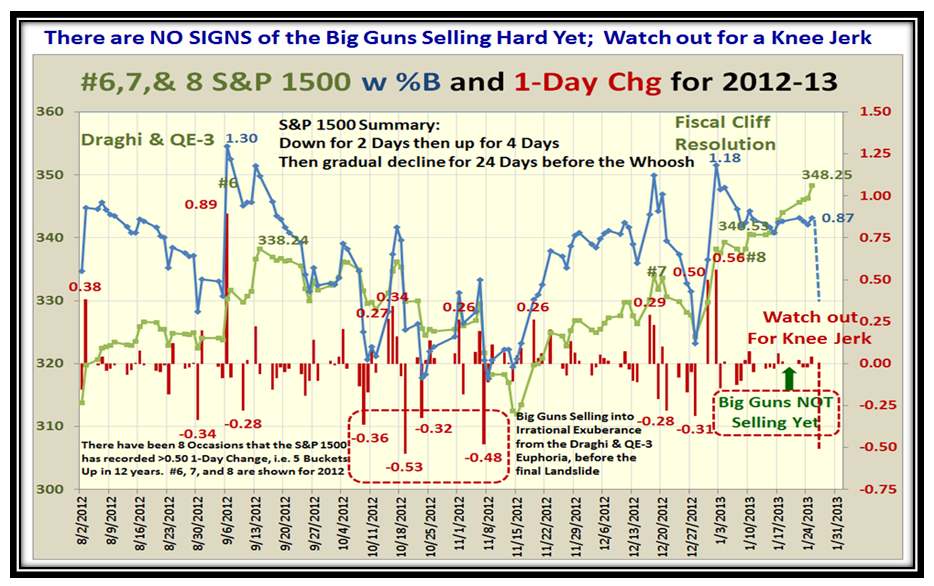
I hope by now with all the signals you have come to understand and enjoy about %B and 1-Day Change that you feel we have a warning system when unusual activity leads to big bucket skips.  Likewise, when things are calm that is a MAJOR clue that the Big Guns are not selling into this overbought rally with any fervour as yet.  Now that I have indicated the possibilty of a Knee Jerk look over to the right hand side of the next chart for what one should expect to see.  More importantly as I have hammered home previously, we need to see several Kahunas in quick succession before we know that the Wall Street Gurus have done their propping up while quietly selling into it and are now ready to bring down the hammer and open up the floodgates as the herd gets panicked into selling en masse.

Moon Big Guns

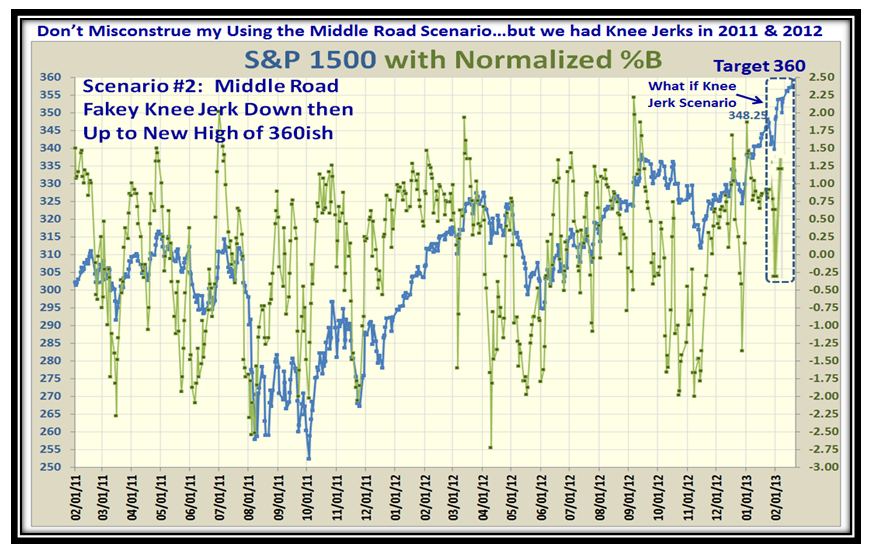
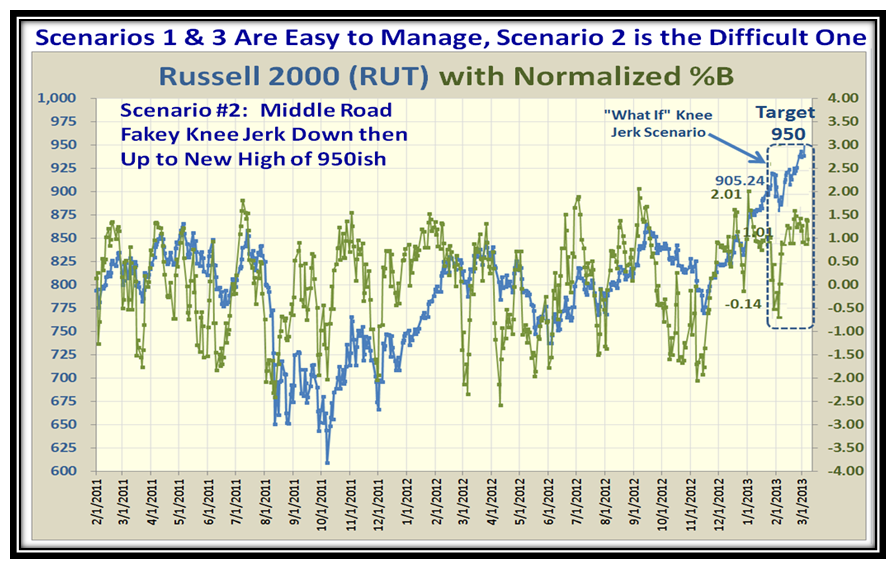
I wind up this blog with the three Road Scenarios, but before I do,  I have chosen to kill several birds with one stone by choosing what I have called the Middle Road Scenario to show what the results might look like with a Knee Jerk Fakey before either the S&P 1500 or Russell 2000 (RUT) recover to seek the higher range of targets I set forth earlier.  Enjoy:

Moon S&P 1500

Moon RUT

In my scheme of things, I always develop three scenarios so that I am not caught off guard.  I know many of you who have attended our HGSI seminars have incorporated that concept into their daily business in addition to their investing habits.  They have also learned to never fall in love with one scenario too far in advance, but to let the Market tell you which one it is on, so as a wind up to this review, here is that chart:

Moon roads

Thank you to those who took the time to give me some feedback and comments; it makes it all worthwhile to hear from you.  By the way, if you haven’t learnt the trick of clicking on any of these charts to make them bigger, shame on you.  Then you can use snagit to capture a copy for your files to review at your leisure.  I strongly suggest you do so with the High Jump Chart showing the targets and keep it by your elbow at your desk!

Best Regards,

Ian.

Copyright © 2007-2010 Ian Woodward
Disclaimer: Commentaries on this Blog are not to be construed as recommendations to buy or sell the market and/or specific securites. The consumer of the information is responsible for their own investment decisions.