Ian Woodward's Investing Blog
Stock Market: The Jobs Report Tomorrow is Key

February 6th, 2014

Those who know me well understand the respect I have for my good friend and neighbor John Bollinger for what I have gleaned from his Bollinger Bands over the years, and the fun I have had in using Bucketology, Grandma’s Pies and Kahunas Up and Down to keep you and me on the right side of the Market.

The last time I tipped my hat to him was on October 29, 2011 in these blog notes, so it’s time to do it again:

Bollinger Picture2

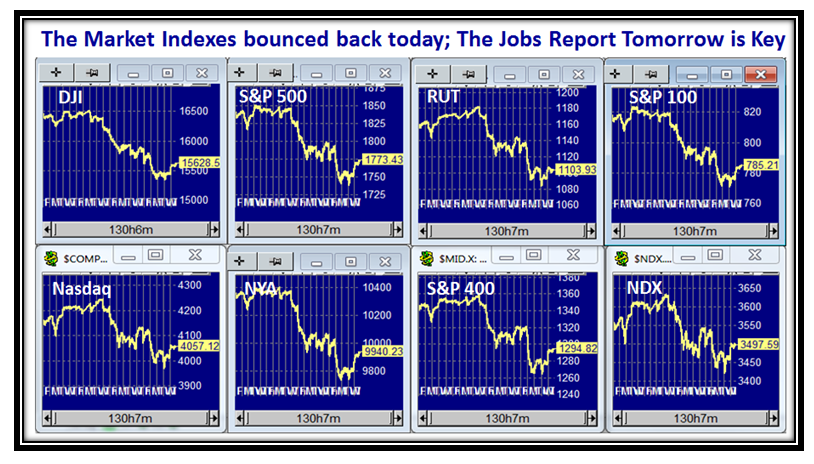
The Market Indexes all had a respectable 1% Bounce today.  The Jobs Report tomorrow will determine if the Bounce continues or we fall back into the abyss:

Bollinger Indexes

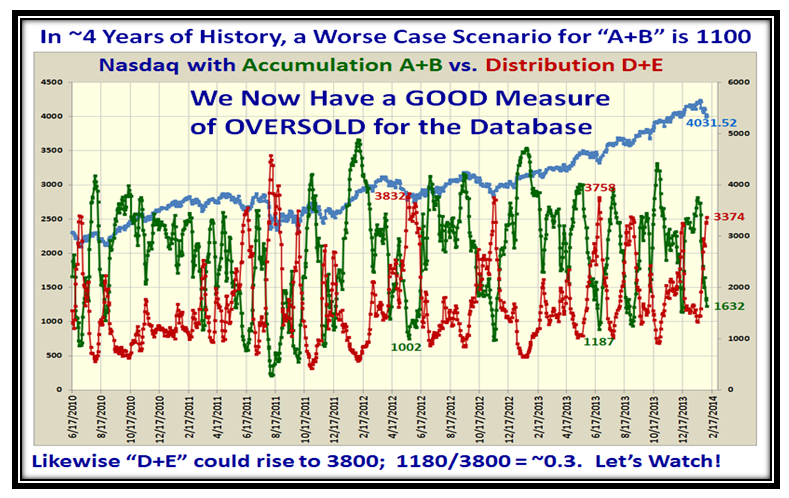
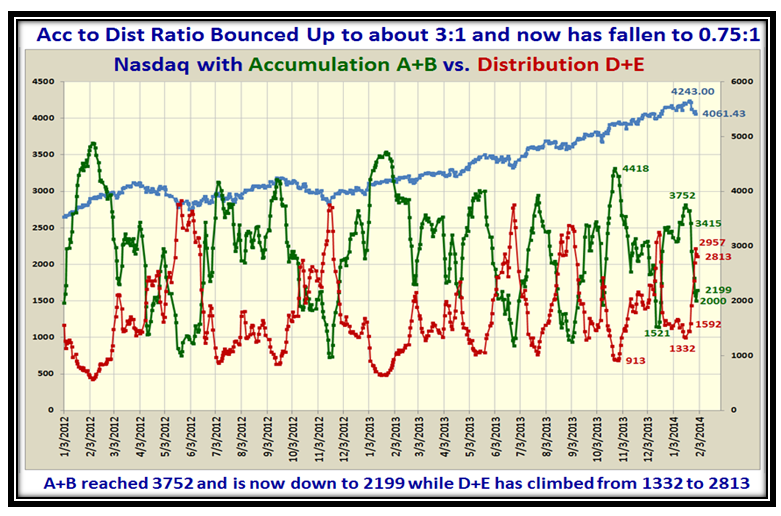
This next chart of accumulation vs. distribution shows that the Market is well oversold and gives us a measure of how much further it should go before there is a significant Rally:

Bollinger abcde

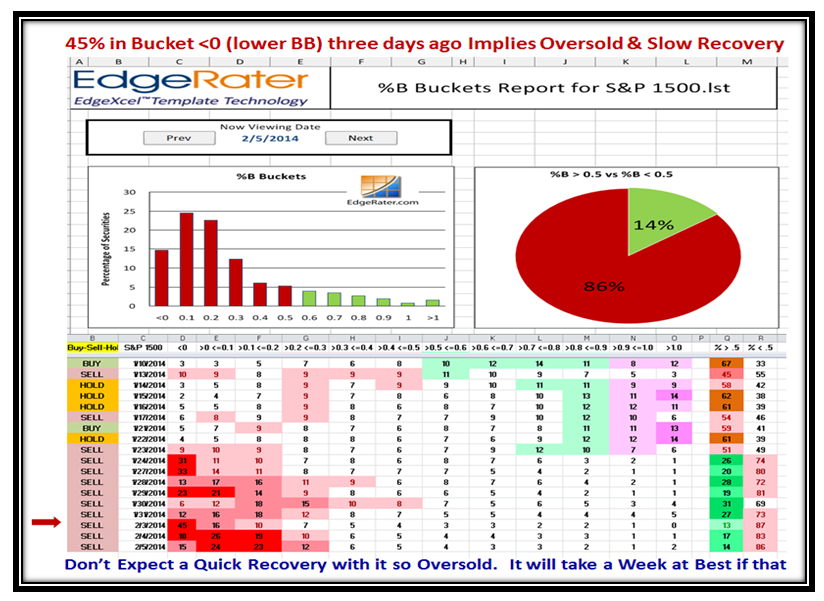
Here is the picture since we had that 45% of the S&P 1500 below the Lower BB on 2/3/2014:

Bollinger Pie

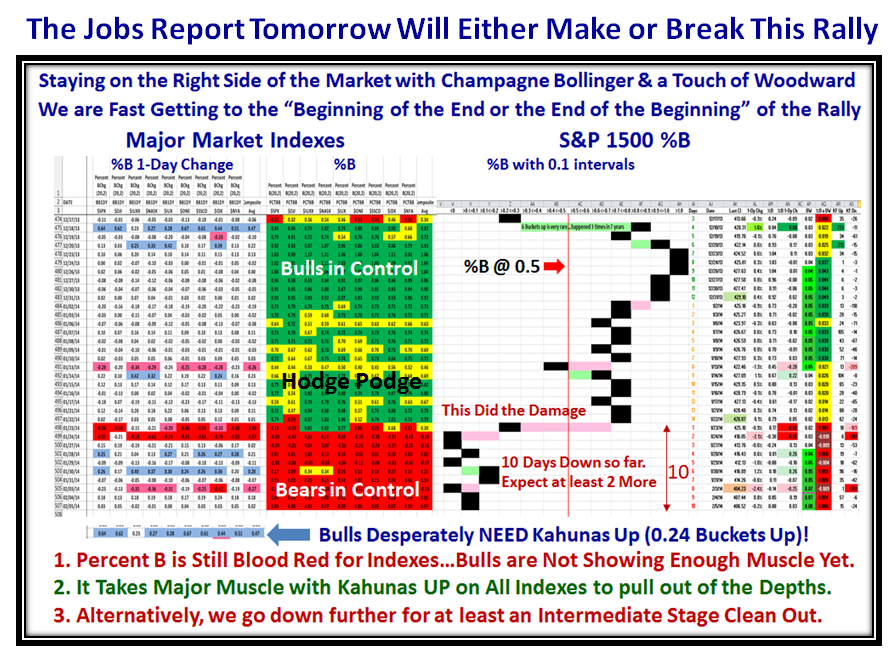
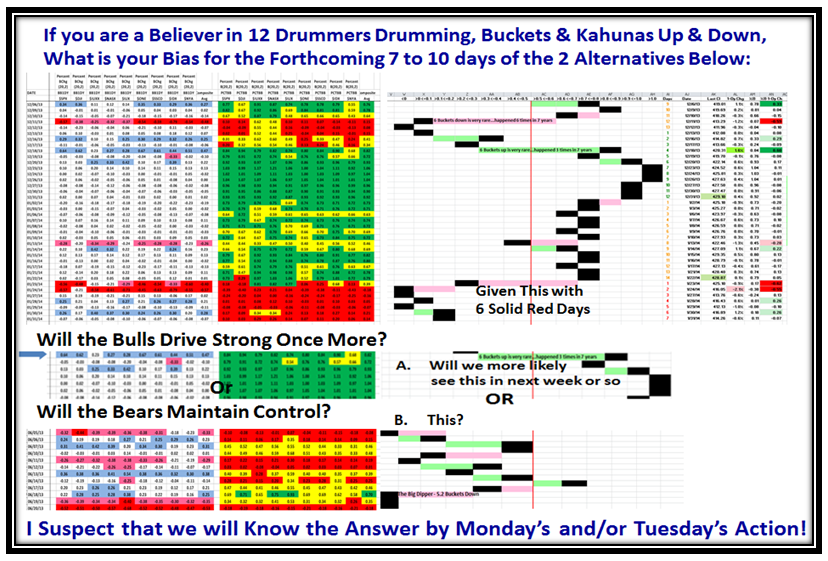
I know this next chart is a trifle busy, especially for newbies, but it sums up the current situation and tells you precisely what are the alternatives for the Bulls and the Bears going forward.  Net-net, the Jobs Report tomorrow had better be excellent to drive Kahunas up on all the Indexes as shown to get the Bulls to Rally and out of the control of the Bears:

Bollinger Pat

Good luck and good hunting,

Ian.

Stock Market: Garden Variety Pull Back or Worse to Come?

February 4th, 2014

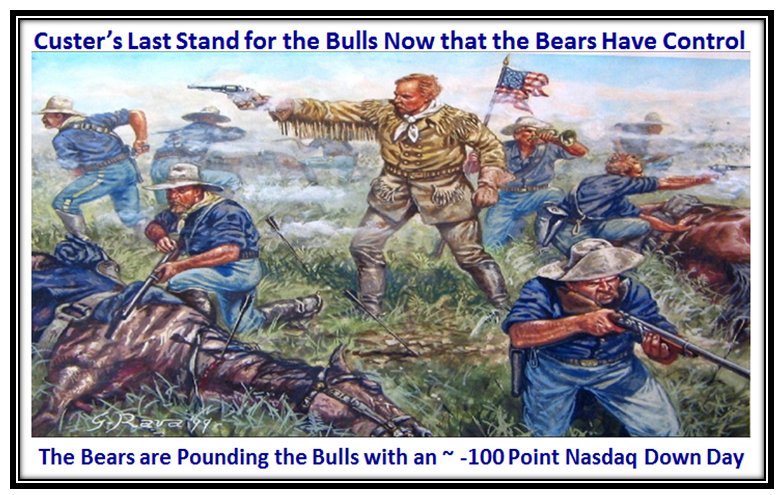
Some pundits rightly say that we have had a Garden Variety Pullback so far, with an approximate 6% down from the Market Index Highs, but the Bigger Question is “Will it end around here or is there more to come?”  Which leads me to my usual picture of Custer’s Last Stand at times like these:

Custer Picture

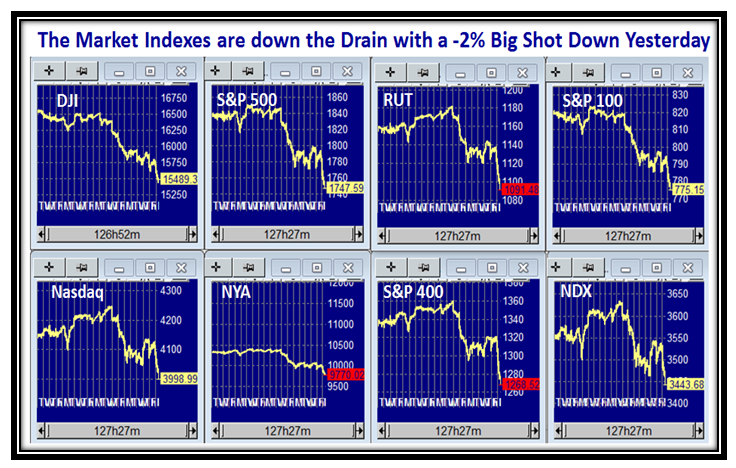
The following picture of the Market Indexes a couple of days ago shows the strong shot across the bow to give the Bears complete control at that stage:

Custer Indexes

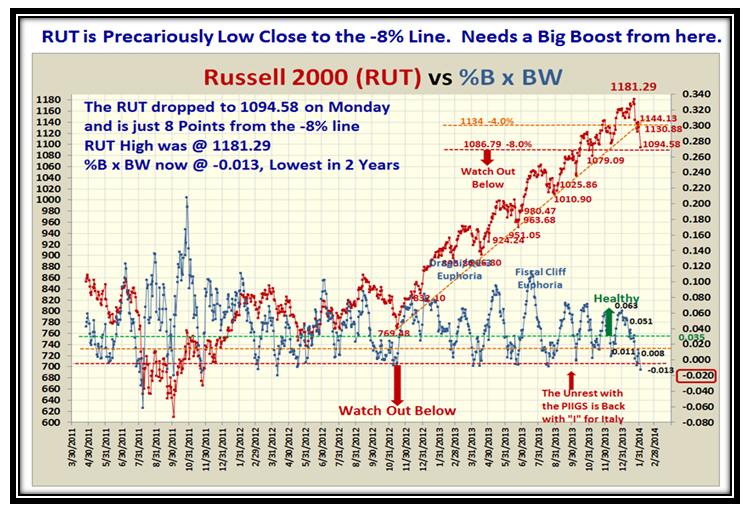
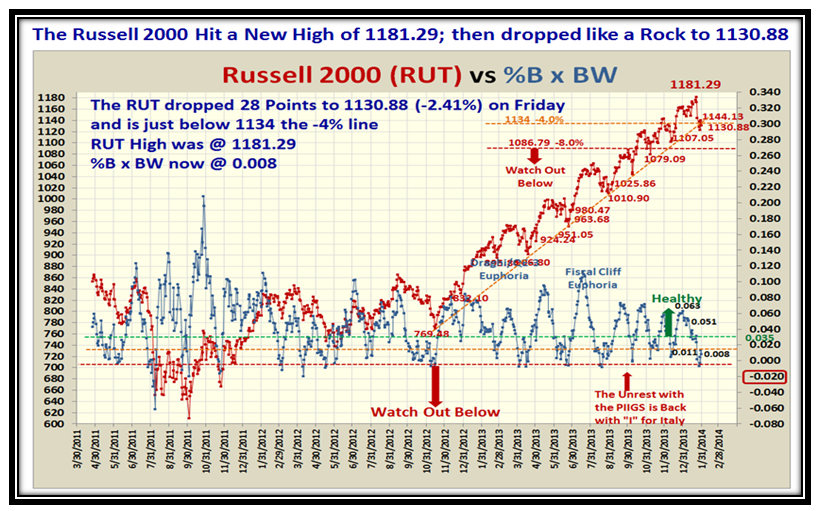
…And here is the damage done to the small caps Russell 2000 Stocks which has broken the sacred line:

Custer RUT

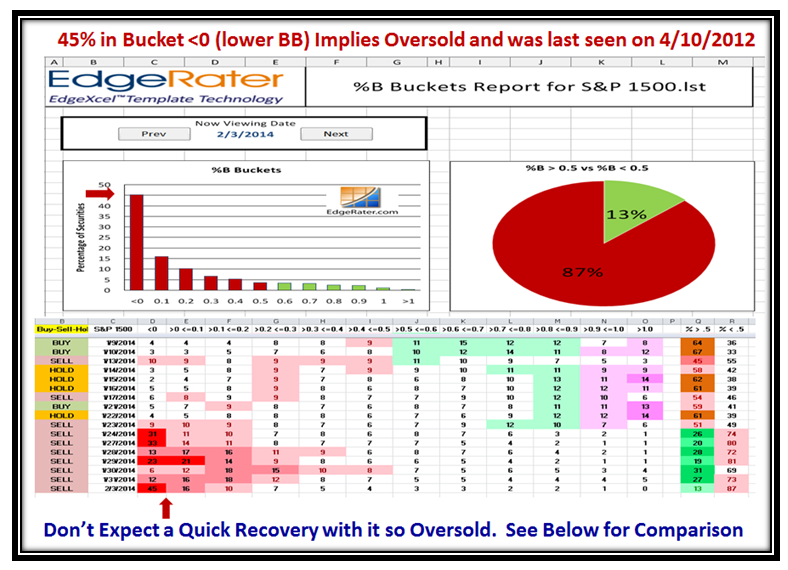
Here is a Measure of the Degree of Oversold in the S&P 1500 which has not been seen since April 2012!

Custer Pie

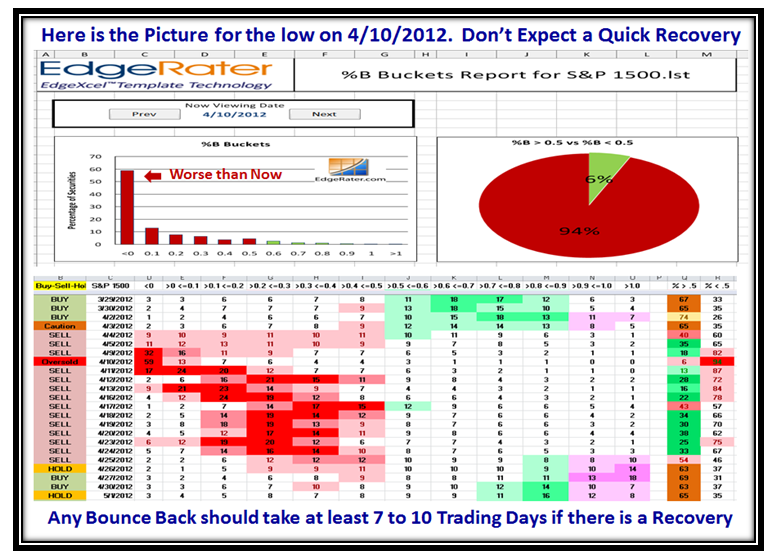
…And here is what it looked like around April 10 2012, which was one of the worst Oversold we have seen:

Custer Pie 2

The bottom line is that 12 Drummers Drumming, Grandma’s Pies, Bucketology, gives us ADVANCE clues of what to expect and the direction the wind is blowing:

Custer Nasdaq

Keep your powder dry and good luck,

Ian.

Stock Market: Gunfight at the OK Corral?

February 1st, 2014

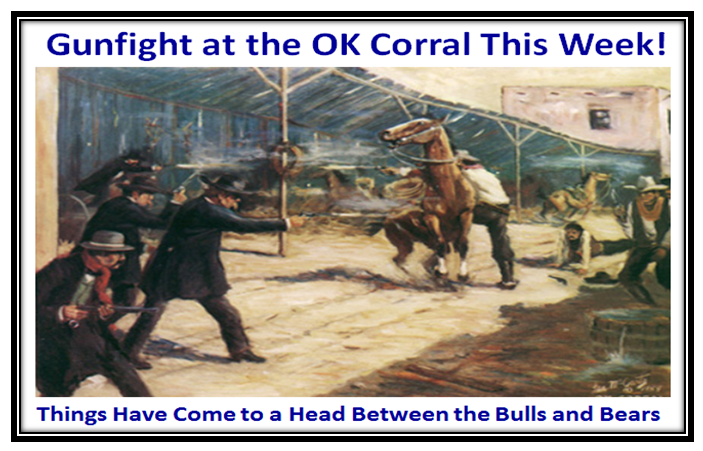
This past week we saw the chinks in the Bulls’ Armor, and with the Market Indexes all down ~ -4% from their highs, we are at the point now where things have come to a head between the Bulls and the Bears, and this blog note should show you the two Alternatives as to what is required for one or the other to win control:

Gunfight Picture

There have been signs of deterioration in the Rally this past few weeks as I have signaled in my recent blog notes and all Market Indexes dropped from the sky to sit below the Lower Bollinger Band for four of the last six trading days.

We are now oversold and can either muster a strong follow through to the bounce play we had on Thursday of this past week or we fall into the abyss and head down to the -8% level from the Market Indexes Highs. Sure, there are other alternatives, but the following charts will show you these two as the key alternatives:

Gunfight Indexes

…And here is the Russell 2000 (RUT) which is again threatening the Trend-line of the past year:

Gunfight RUT

Now let’s turn to the Internals of the Market with the Accumulation vs. Distribution picture, which again confirms that the overall bias is distribution:

Gunfight acc

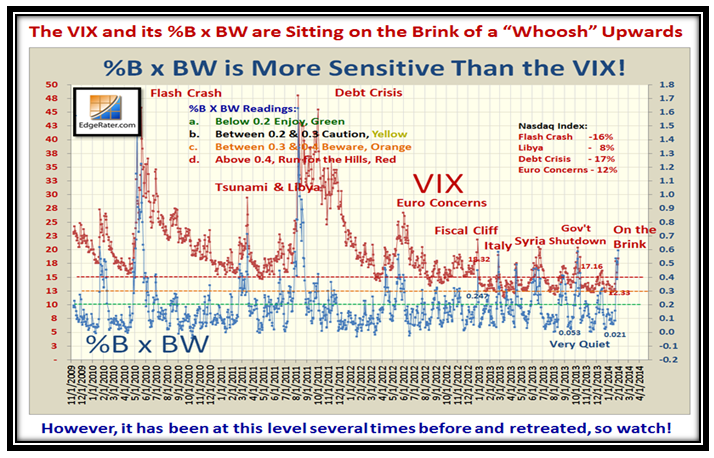
The VIX has shot up precariously in the last few days where it is now at a dangerous level for a possible Whoosh, though in the same breath you can see that on the last five occasions it has always retreated:

Gunfight VIX

So, with all of the above as the good fodder to whet your appetite, let’s see if we can put the clues together to arrive at the two core strategies  for the Bulls and the Bears for this coming week.  In the top portion of the chart you will see that there has been a splatter of “Red” at the bottom for all the Market Indexes, but more importantly four of the six days they were BELOW the Lower Bollinger Band.  That said, you also know that it is unusual for this to stay this way and with the move shown in Blue on the bottom left on Thursday we had the bounce from an oversold state, which took the Indexes back above the Lower BB.

For the Bulls to capitalize on Thursday’s move they need to drive early this week with another series of Blue Kahunas upwards on Monday or Tuesday at the Latest, which is shown in the middle of the chart.  On the other hand, if the Bears are to maintain control they need to drive a set of negative Kahunas as shown in the lowest part of the chart.

Gunfight Pat

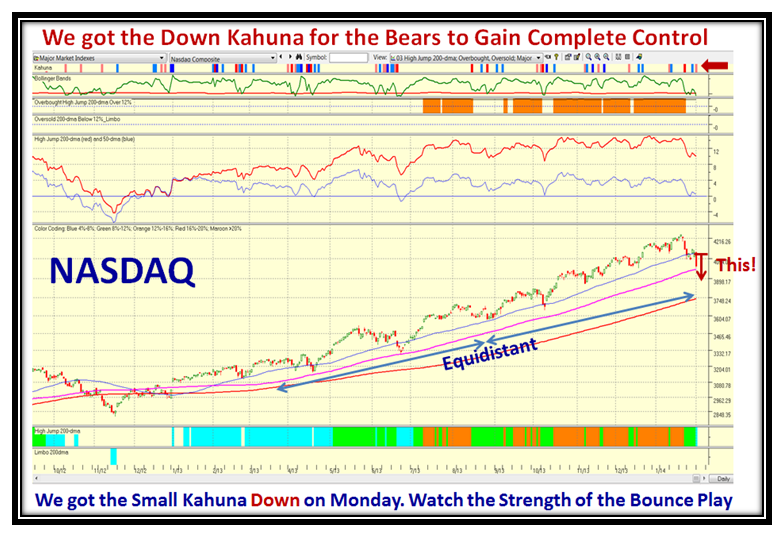
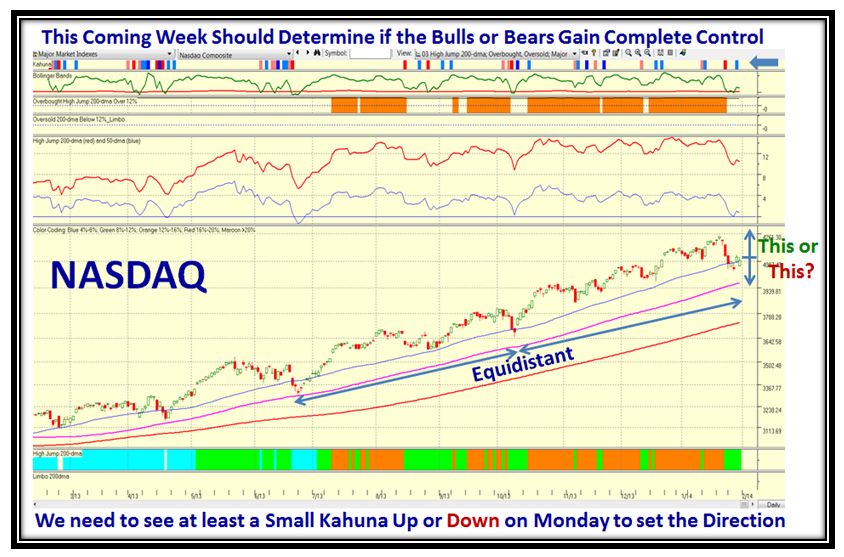
To wind this up let me also show you a chart of the Nasdaq which also shows the symmetry of the situation and the ripeness for either a new move upwards or a fall from the skies for a decent correction, which is overdue:

Gunfight Nasdaq

Good luck to you all and happy hunting.

Ian

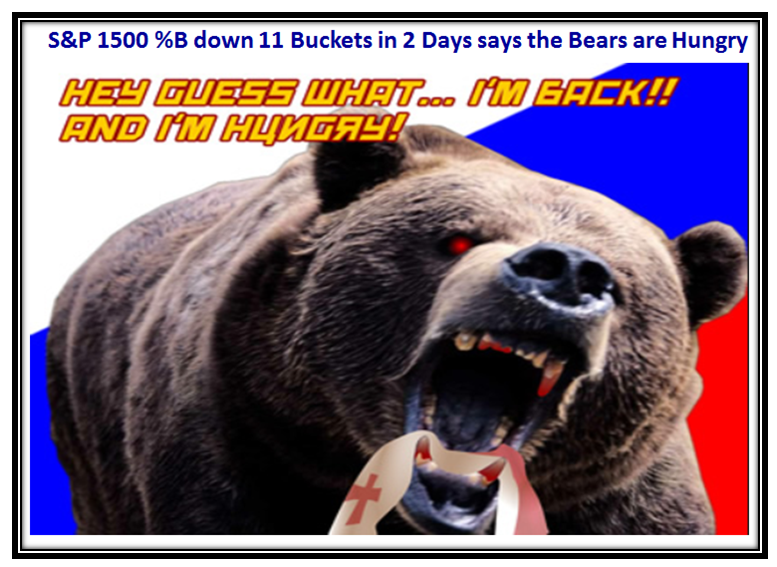
Stock Market: Bears Are Hungry!

January 26th, 2014

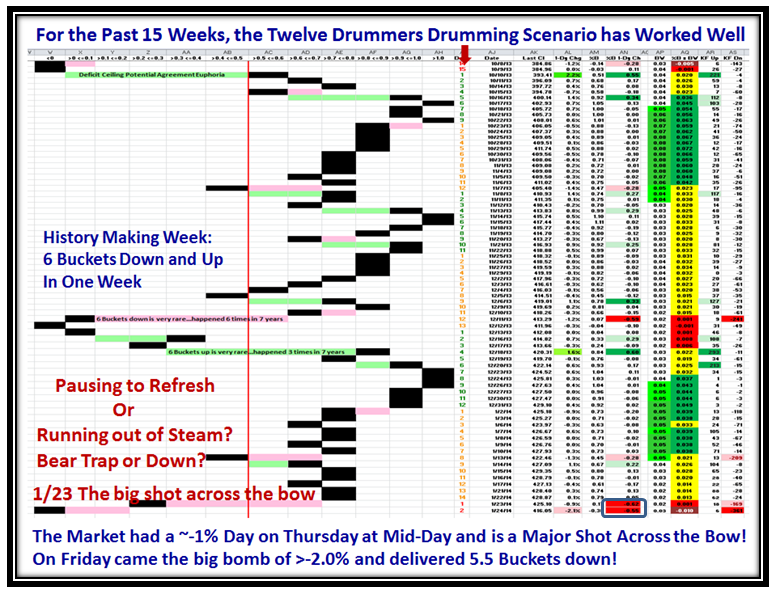
At long last the Bears have made a meaningful penetration in the Bulls’ Rally and now we shall see whether they gain complete control or this is just another Knee Jerk.  However, far more damage has been done this time so do not expect a quick bounce back as we have had before…but who knows in this crazy market?

Bears Picture

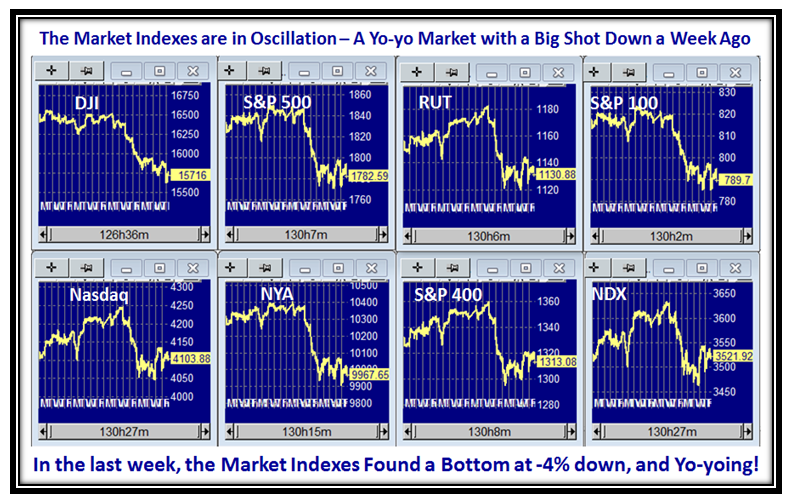
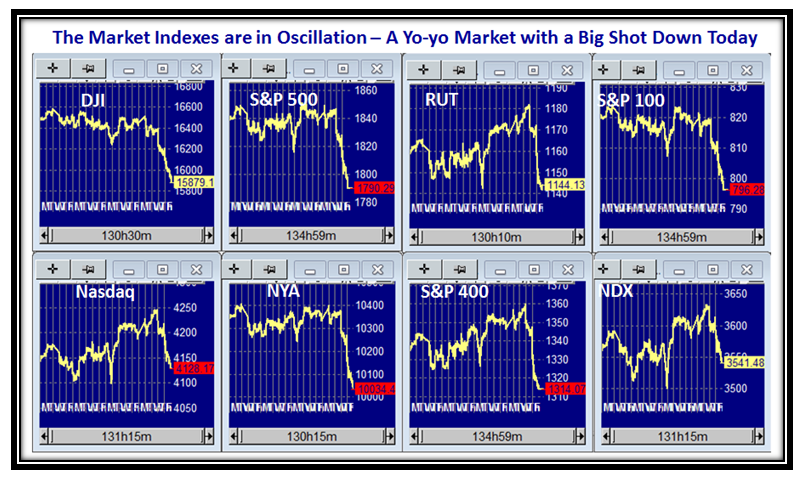
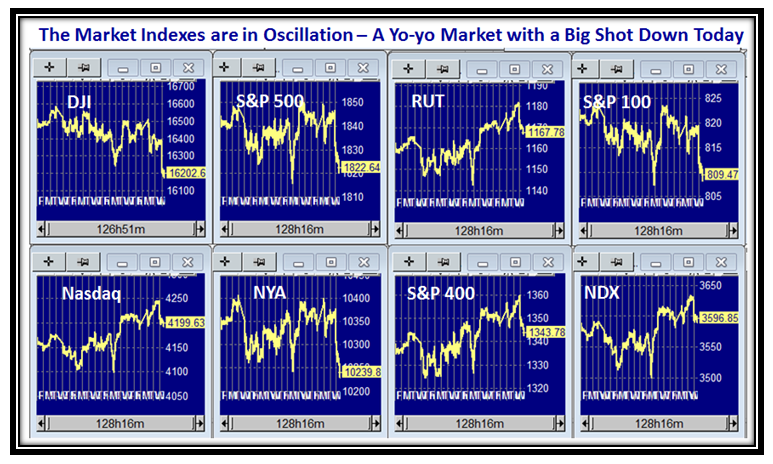
Here is the usual summary picture of the eight Market Indexes which shows the major drop in the last two days:

Bears Indexes

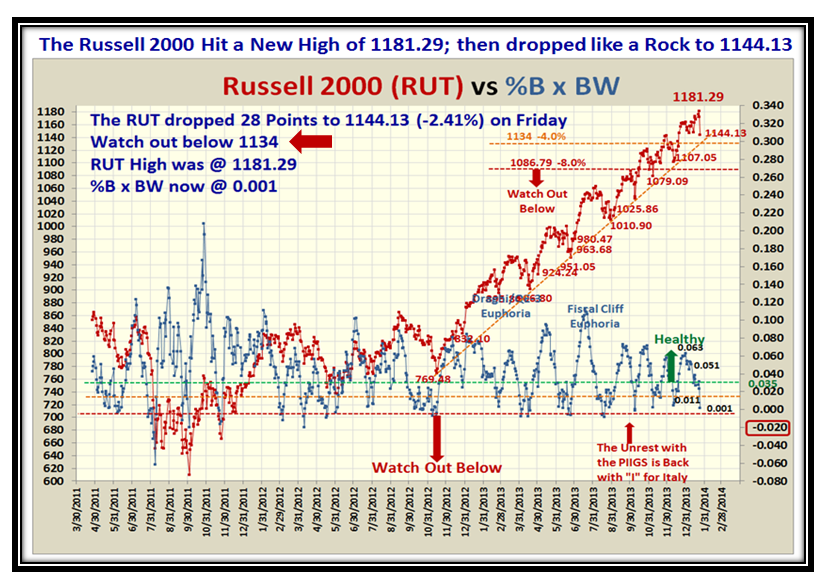
The Russell 2000 took a Major hit and is now just 10 points away from the high for a -4% Correction:

Bears RUT

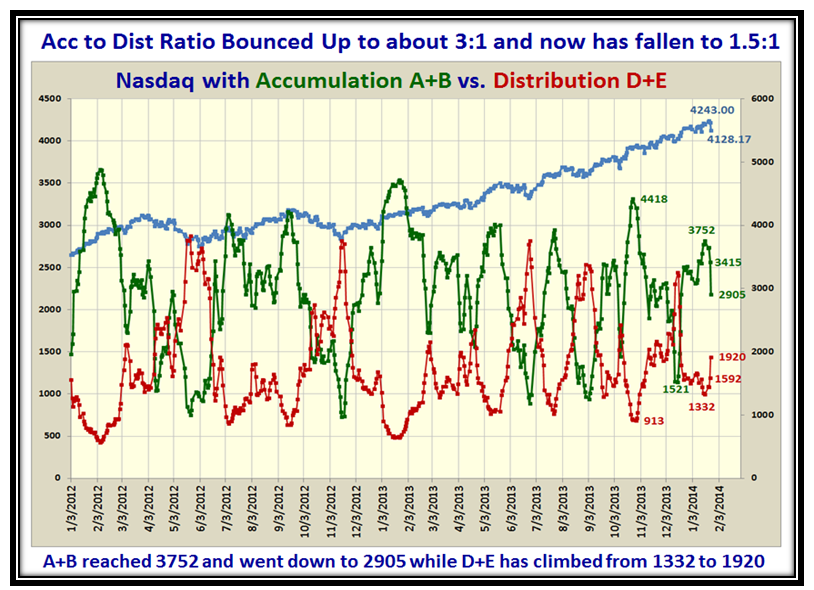
As we would expect, the Internals of the Market also took a beating as the Acc. to Dist. ratio is also down to 1.5:1

Bears abcde

Over 11 Buckets down in %B in two days for the S&P 1500 shows the damage that has been done, so don’t expect a big snap back soon despite the market being so oversold.

Bears Pat

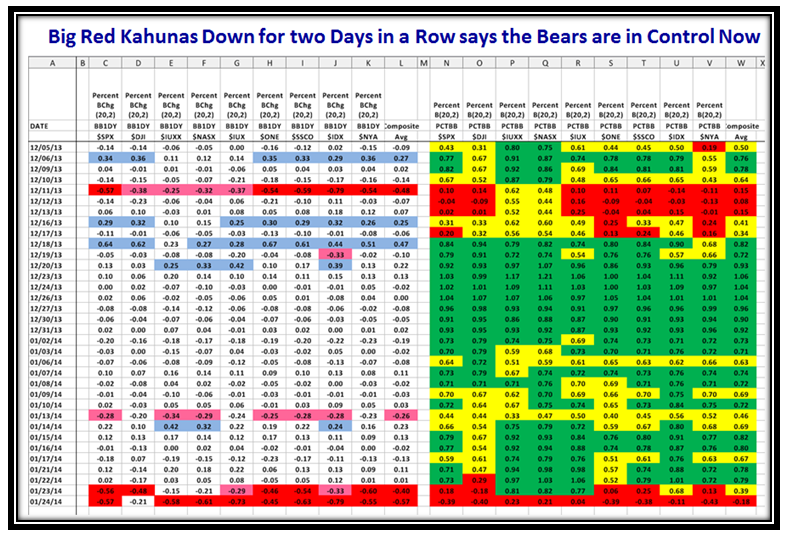
The Big Red Kahunas at the bottom of this next chart says it all, and going by past history, the Bears have control:

Bears Mkt Indexes

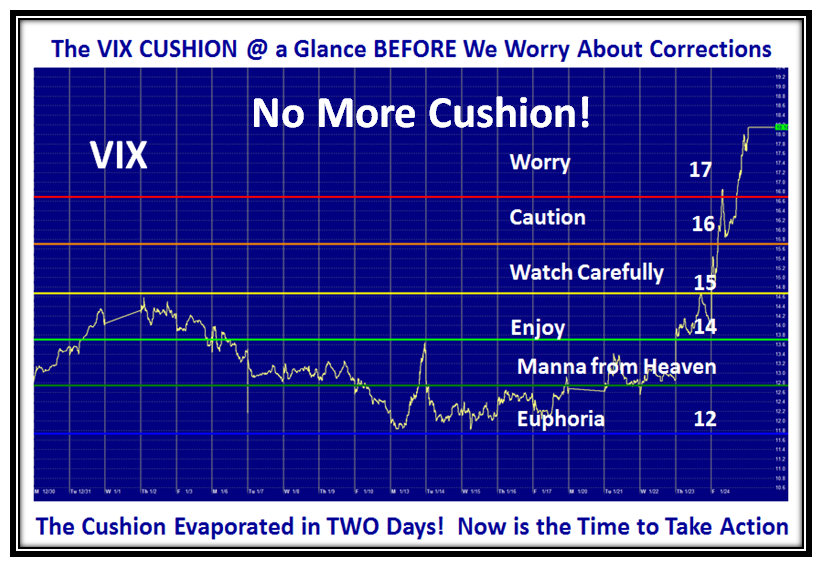
…And Finally, the VIX Cushion disappeared in two days so be careful:

Bears VIX

Best Regards,

Ian.

Stock Market: In “See-Saw Marjorie Daw” Mode

January 23rd, 2014

Today the Tom-toms are beating loudly to the downside, so I am writing this at 12.00 noon before the Market closes to give you my perspective on today’s action:

See-Saw Picture

Here’s the snapshot of the Market Indexes which have taken a -1% dip today:

See-Saw Indexes

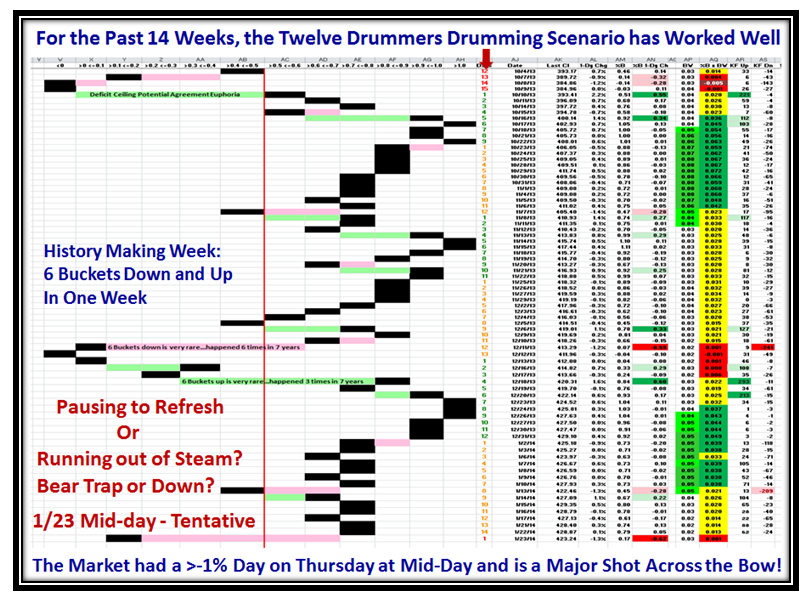
If the market remains down >-1% at the end of the day, here is what to expect in our favorite Buckets View:

See-Saw Pat

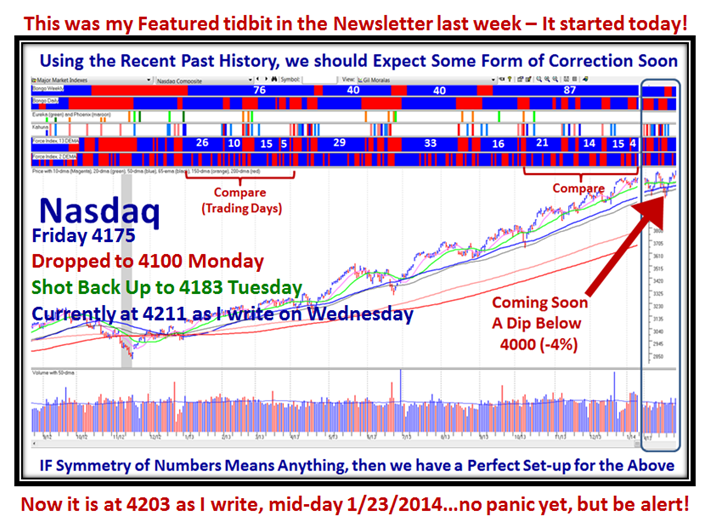
My featured view and perspective in last Week’s Newsletter issued on the 15th January, shows what I expected was in store for us sooner rather than later, and today seems to be the start of nasty things with the shot across the bow.  We should expect at least a -4% down on most Indexes from their highs for starters:

See-Saw Nasdaq

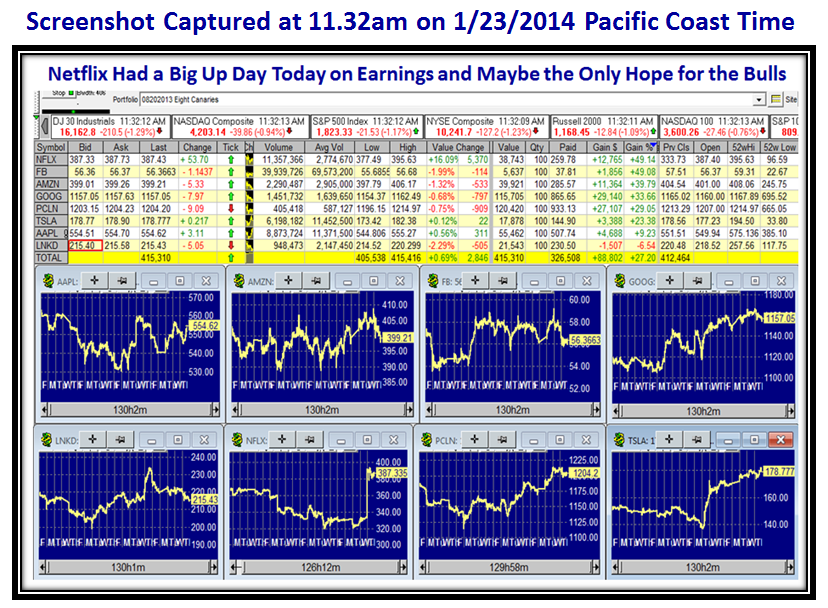
The one saving grace from today’s action is that NFLX delivered an excellent Earnings Report and is hope for the Rally to continue!?

See-Saw Canaries

Stay alert and nimble!  Best Regards,

Ian.


Copyright © 2007-2010 Ian Woodward
Disclaimer: Commentaries on this Blog are not to be construed as recommendations to buy or sell the market and/or specific securites. The consumer of the information is responsible for their own investment decisions.