Ian Woodward's Investing Blog

Archive for August, 2007

The Early Bird Catches the Worm but Watch Out for the Hawk Above!

Tuesday, August 7th, 2007

Both the Last Dance and the Game Plan Groups I published a few days ago on this blog are holding up and are very strong, and I am sure quick traders have seized the opportunity. The stocks on those lists are the leaders.  I have said time and time again seek out stocks with recent strong earnings behind them.  For more details on the characteristics of the stocks to watch please see “The Game Plan for the Short Term” a few notes below.   

However (when one starts with a However you know the other side of the coin is coming), you may want to give some thought to a few other points: 

  1. Think about the potential IMPORTANT News that may be forthcoming on the very day you go for it.  Today is such a day, with the FOMC doing its song and dance.  The Nasdaq dropped over 30 points on the news, the DOW dropped over 120 points and sell programs came barreling in.  Then, just as quickly, they reversed themselves and were up as many points…a crazy volatile market, which we must get accustomed to.  We have had that for over 15 months now. 
  2. V bottoms are very rare patterns and one is far more likely to get caught in a retest of the lows. 
  3. Watch the internals of the New Highs and New Lows on strong up days.  Yesterday was putrid, and most would call it a Dead Cat Bounce.  It also happened to come off support at the 200-dma on the Nasdaq, which was a most likely call for most technicians. 
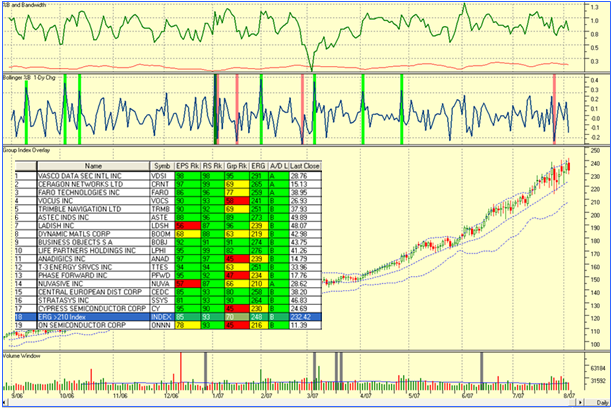
  4. However, to counter balance that, there is no question we are in a deeply oversold situation and there may be some low hanging fruit you can enjoy in the meantime.  We have not seen such a large number of “E – A” distribution for stocks since May of 2004, after the long run up in 2003.  Said another way, the A accumulation is at lows while the E’s are at highs, comparable to May of 2006 and other lows back in 2005, etc.   
  5. The correction so far has met the odds of a bounce back, i.e., you recall I taught you that 77% of the time the S&P 500 and for that matter the NASDAQ has held at an 8% minor correction.  That’s the good news and that is where we are at right now.  The bad news is if it breaks that level there is a further 11% chance it can hit 12% down on the S&P 500. 
  6. There is no question that good timing is everything, and the early bird who seizes the opportunity catches the fattest worm(s).  But watch out for the Hawk above, especially in such a Volatile Market.  As long as you trade with tight stops and raise your stops to preserve small profits and avoid automatic 8% losses, you will do fine. 
  7. Remember that “W” bottoms are more likely, so more cautious investors should wait a while to make sure a Double Bottom is behind us. 
  8. For those who want the market to prove it has bottomed and enter at a safer point, here are things to remember: 

a. Watch for a retest of the lows, i.e., a Double Bottom.  Then by all means look for the strong up day followed by the so-called Follow-Through-Day 4 to 10 days later. However, one must temper that with the tremendous Volatility we are now experiencing.  Down and up over 200 points within a day from day to day is becoming commonplace nowadays, so be careful, as we have now essentially experienced that three days in a row…between friends.  Don’t be too quick to jump in.   

b. Pounce quickly when the Market Index (NASDAQ) breaks through the short term declining tops line from its recent highs.

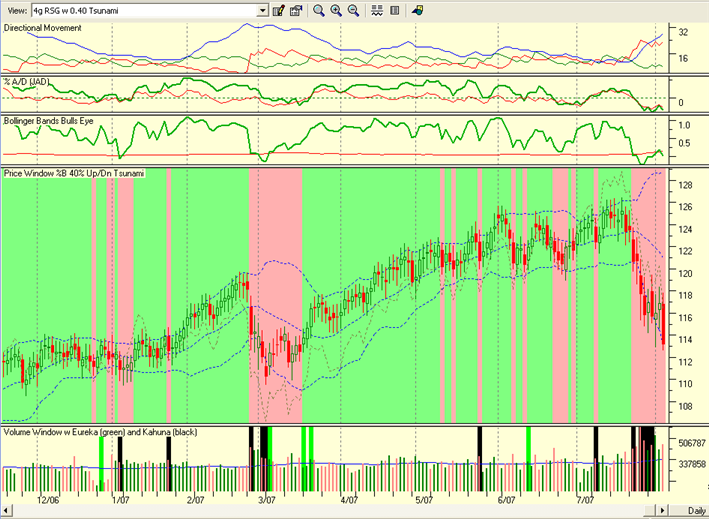
c. Wait at least until the 4-dma goes upwards through the 9-dma and preferably both go through the 17-dma, for confirmation that the ship has righted itself.  Use the 4a key on the Charting Module which is available with the HGSI Software.

d. For those who are even more cautious, we want the 17-dma up through the 50-dma, but you will be giving up a good deal of cloth on the upward rally.  That’s fine if it continues, but again you can get caught from being too slow on any retrace.

 That’s it for now.  Good luck and Best Regards, Ian.

Today’s Market Action

Monday, August 6th, 2007

This is a quick observation from my colleague Ron Brown

The image below is a snapshot of the market internals for Monday,August 6, 2007.

market-internals.png

As you can see the NASDAQ decliners outnumbered the NASDAQ advancers while the NYA advancers versus decliners were slightly positive. It was a heavy volume reversal day with shorts getting squeezed in the financial stocks and in large caps.  Please note that the NASDAQ numbers are on the left and NYA are on the right, with IIQA and IIQD being the NASDAQ advancers and decliners, respectively.

Today’s action shows how very important it is to have stops in place if you get caught on the wrong side of the market, and also how dangerous the leveraged ETFs can be if you are not nimble.

A Perspective of the S&P 500 History

Sunday, August 5th, 2007

Next week will be interesting.  Just a few statistics on the S&P 500 to give a balanced view of where we stand: 

  1. The least % down for the 13 previous longest moves on the S&P 500 is -9.73%.  That was in 1990.
  2. The next lowest was back in 1953…who cares, but it was -14.82%
  3. The Average of the past 13 such long rallies is -28.05%.  Let us pray we don’t suffer that big a drop.
  4. We are currently down -7.91%, so we hope it holds at 8% or a bit more.
  5. We badly need a bounce play at least.  Call it a snap back this week. 
  6. That doesn’t mean we will be out of the woods…no pun intended while enjoying the golf with Tiger leading.
  7. If the downdraft sets in, understand that the least number of Trading days to the low was in 1987 with 39
  8. If we liken this to 1990 for a drop of around 10%, that took 43 Trading Days. 
  9. The ONLY saving grace is that the P-E of the S&P 500 is 15.20 which is the lowest since 1990
  10. If Corporate Earnings continue at this clip, we can hit 100 for the S&P 500 and that will give us plenty of Gas in the Tank.  The tug of war I described earlier between EPS reports and Sub-prime spill over has been won by the latter for now.  So, the bad news is that Technicals trump Fundamentals right now. 

Best Regards, Ian.

The Game Plan for the Short Term

Saturday, August 4th, 2007

The previous blog note covered the gloomy side of the equation.  What can we see for the upside, and what should be the signs that the rot has stopped, and what should one do under these circumstances?

  1. The first and most important thing on our minds is Capital Preservation.  Just move your money to the sidelines and take a deep breath and regroup if you suffered a loss these last couple of weeks.  There is nothing worse than a leaky faucet.
  2. The second point is to be careful of the small caps…the Russell 2000 is in bad shape and may present some shorting opportunities, but it is already so beaten down that one may get caught if there is a snap-back.  Ron Brown showed how to address the ETF’s in his movie today, so see what opportunities appeal to you on that score.  The QID/QLD are a good pair for gamblers but one must be very, very quick on the trigger both ways.
  3. The only saving grace is Strong Industry Earnings.  We are very fortunate that the S&P 500 earnings are still on their way to achieving 90.00+ by year end.  However, that means very little right at this moment.  It will be of great value when the dust settles.
  4. Now is the time to be sharpening the pencil and observing how leaders behave to see if the rot has stopped:
  • Stocks whose Trailing Twelve Months (TTM) earnings are out and are stellar, i.e. >20%.
  • Stocks that have A or at most B Accumulation since they are the current leaders.
  • Stocks that have a Rel Str of at least 87 and preferably 95.
  •  Stocks that have an ERG >210
  •  Stocks that are still above their 50-dma and preferably above their 17-dma.
  •  Stocks that have not corrected more than 15% at most from their high and/or basing

Here is a list to keep an eye on.  If this Index can’t hold, this Market is in a lot more trouble:

Game Plan

 Best Regards, Ian.

The Party’s Over and the Jig is Up

Saturday, August 4th, 2007

In my last few notes we have had plenty of warning signs this past week that the Market Indexes were going to head down. I won’t repeat all of that, but at least you now know the steps to take if you find yourself in this situation again.  Before I go into an analysis I showed you how valuable the Tsunami Indicator is in times like this.  Here is the current picture.  Just look at the damage: 

Tsunami

 It is worth a few sentences on what possibly caused the psychology to change in the Bears’ favor: 

Three things immediately come to mind:   

I. The clientele were primed for a correction with weeks and even months of anticipation for a 10% correction on the S&P 500.  The talking heads talked that one up daily on CNBC. 

II. The sub-prime lending bubble which affected the Hedge Fund debacle for Bear Stearns and others. 

III. The unbelievable Volatility in the Markets for the past year building up from the correction last May 11, 2006 and increasing right up to the present day.  This discouraged most investors and even swing traders to throw in the towel. Day Traders had a ball, but even they were put to the test at being very nimble.    

It is far more important to assess where next and what the possible alternatives maybe for the immediate future: 

1. The Volatility is here to stay.  It may decrease but not anytime soon, so realize you must contend with that.  

2. The housing market and the sub-prime fiasco have still a ways to go to work itself off. 

Net-net on these two items is that it will take a while and there is little investors can do than to realize that for the moment long term Buy and Hold is very risky no matter how tempting we might feel in trying to bottom fish for value.  The knife is still falling and our motto is never catch a falling knife.  We have no idea of where the bottom might be.  That leads me to item I above, where at least we can resort to the up, down and sideways scenarios you have seen me use for setting the Benchmark Targets: 

3. The psychological mood is “let’s get a decent clean out and start a fresh bull rally”.  The $64 question is how low is low, but we have the tools to identify reasonable targets:    

a. Go back to the psychology – 10% correction for a decent clean out. The odds suggest an 8% correction on top of the several we have had since the bottom of 2002 is unlikely.  We are essentially there right now and already broken the 200-dma.  If the market does stop here then this problem is only postponed.  So we must be on guard for at least a 10% correction which takes us down to a nice easy number to remember, which is 1400 points on the S&P 500.  That is just 33 points away.  The odds suggest there is a 77% chance the correction will be <8% and an 11% chance of it being between 8% and 12%.  Since the 200-dma is broken, it usually takes weeks rather than a few days to recover, unless we have a major snap back next week.          

b. Beyond that we head for an Intermediate Correction of 12 to 16%.  You can do the math, but that takes us down to 1369 and then 1307, which would essentially mean wiping out the entire rally from this past March.  The continued sub-prime mess can do that.  Anything above 10% hurts and deeper corrections will kill you.   Appreciate that 12% down would be 6% down on the Limbo Bar (Reverse High Jump) and gives us an estimated P-E of about 15 for the S&P 500.  It goes without saying that the market would be very oversold and undervalued at that stage. 

I will give you a Game Plan for the immediate future in the next blog note, but I would appreciate any comments which you can leave at the bottom of this note as to whether this is of help to you. For more on the health of the Market, I strongly recommend you listen to my colleague Ron Brown’s movie at http://www.highgrowthstock.com/WeeklyReports/

Best Regards, Ian.

Copyright © 2007-2010 Ian Woodward
Disclaimer: Commentaries on this Blog are not to be construed as recommendations to buy or sell the market and/or specific securites. The consumer of the information is responsible for their own investment decisions.