The Market High Road and Low Road
Tuesday, March 31st, 2009I couldn’t resist the old Scottish Ditty about taking the High and Low Roads to Loch Lommond:
At the seminar just finished ten days ago, I drummed in the need for all good students of the Market to have a Game Plan. That Plan must have Stakes in the Ground and Measuring Rods to establish the “Must Achieve” targets for a Type 3 Swing Trader and then a Type 4 Long Term Investor to get excited about engaging their hard earned money in the market.
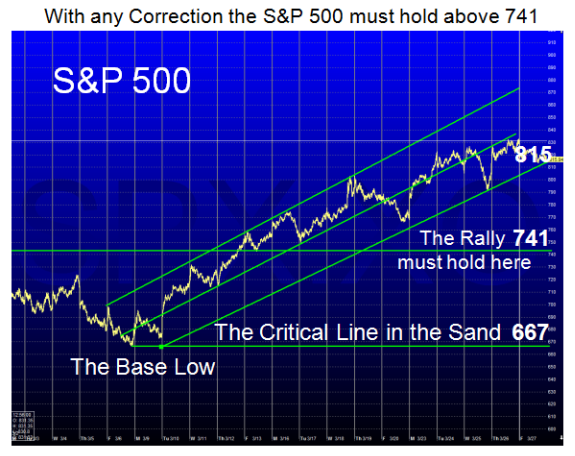
I think most got the logic of the factors I used and understood they were based on a mix of past experience, proven targets and Fibonnaci numbers. I also suggested we review the bidding from time to time to know whether we are on track for Recovery from the doldrums of a near Depression scenario; or whether we will sink back into the abyss to drive below 667 on the S&P 500.
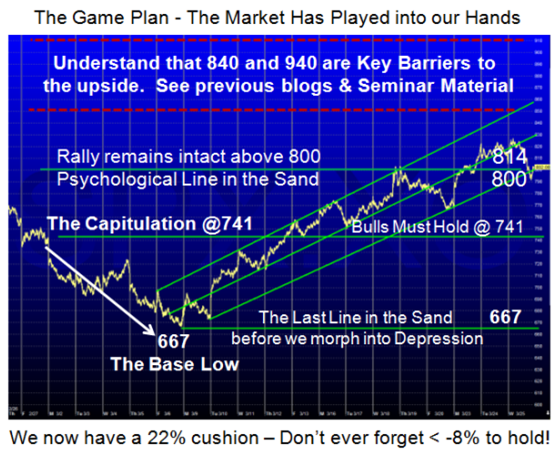
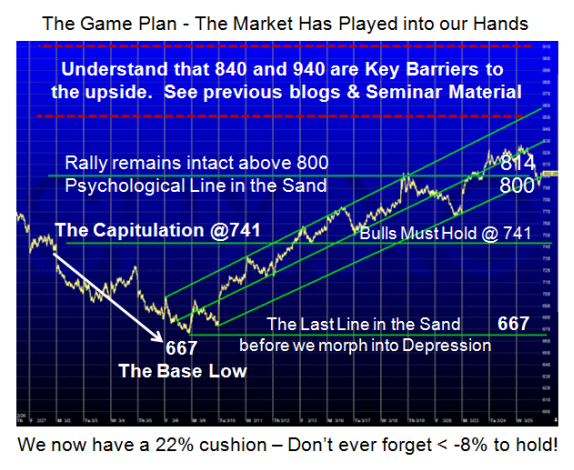
I gave you the Game Plan just one week ago, but it probably had meaning only to those who attended the seminar. I will repeat it here just to drive home the key winky winky which indicated that 741, 840, and 940 were key targets of support and resistance to watch:
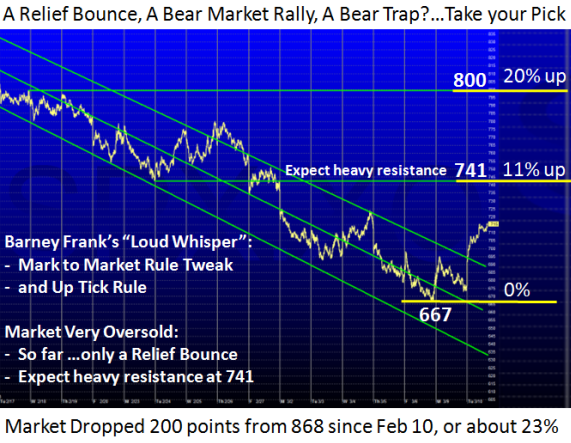
It is now over one month since we hit the Base Low of 667 on the S&P 500, and Barney Frank came to the rescue with his double barreled speech of “Mark to Market” and “Up Tick Rule”. I covered that in my Blog of March 10th, 2009. Whether they ever materialize remains to be seen, but if they do they should be a major boost to the market, especially in reducing the extreme volatility we have endured recently.
My son and his wife are itching to throw the dice and get back in with their 401-K money having been patient and avoided the major downdraft. So this picture is for them and for those who understand the Saw Tooth Plan I derived for them for “Must Achieve” targets. I can now say that the first leg of the Plan was more than satisfactory as shown on Line 1 of the chart below. Understand we are still not out of the woods, but it is a good start:
The simple requirements were that the S&P 500 achieve 21% up and no more than 8% down, both Fibonnaci numbers and lots of history to back up the rationale as to why they are key in the scheme of things. You will see that we achieved 24.9% up and so far if the recent low of two days ago holds we had 6.4% down as seen from the chart. Please understand that the critical Line in the Sand on the down side is still 741 as I show in the Game Plan Chart above, but at least we have a decent cushion should there be a major negative surprise of yet another 4% drop in one day as we had a couple of days ago.
Those who attended the seminar will refer to their chart on page 125 and compare it to the chart above. The current status shows that we have a fighting chance to achieve Line “2”, which I have tweaked to now aspire to the 940 Target which is key. This target kills two birdswith one stone…the 940 target and over 40% up from the Base Low, which are MUST achieve targets to be assured we continue on the track to Recovery.
Please also note that we can then sustain a 10% downdraft and still maintain the Saw Tooth requirements of Higher Highs and Higher Lows as shown on Line 2 of the Plan. Likewise, it will keep us above the critical 840 line in the sand, if and when it is achieved.
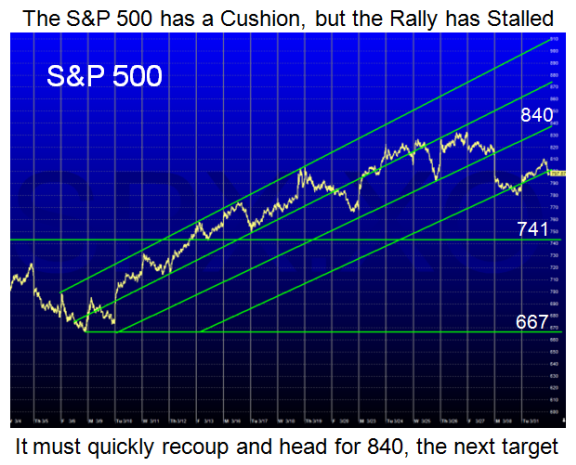
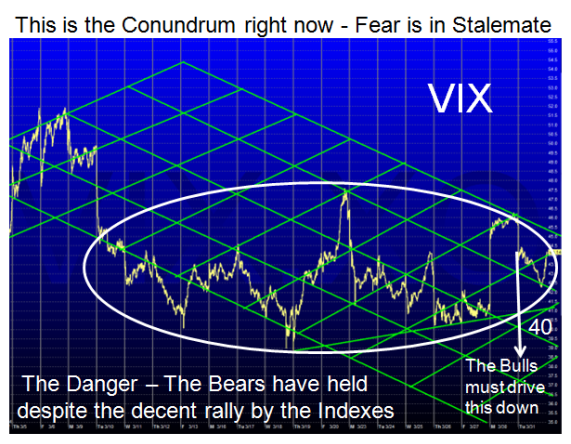
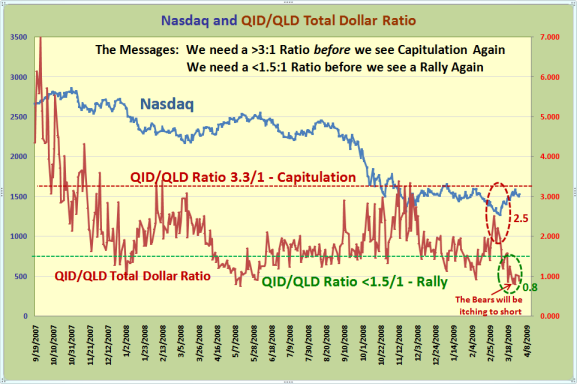
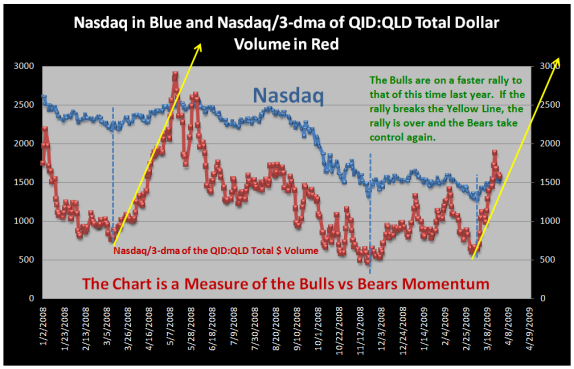
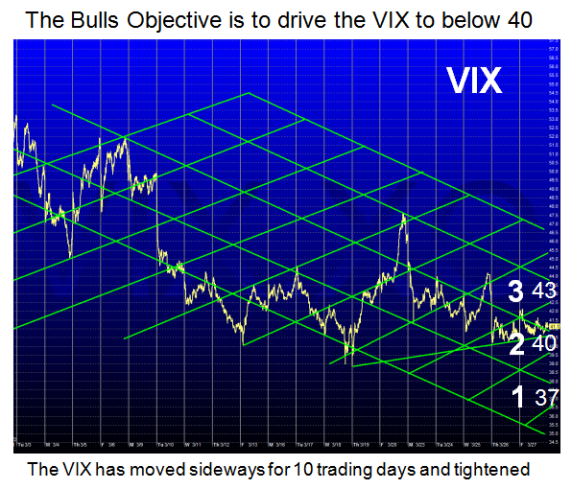
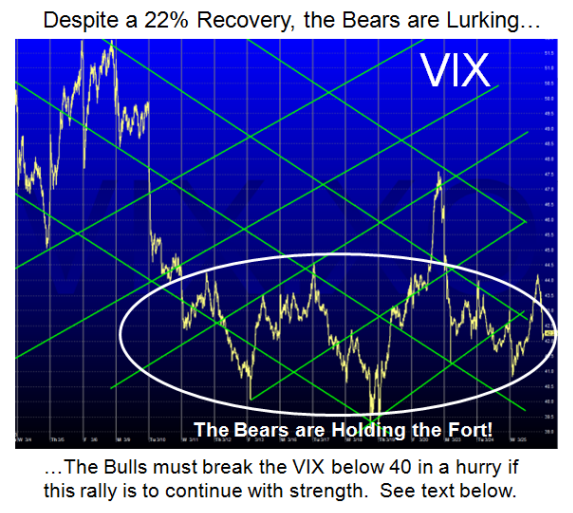
The bottom line is the next few days will determine the odds for Type 3 Swing Traders or those wanting to take a chance that we are in the throes of a decent Bear Market recovery. As you have observed I have narrowed my critical search to the information on the four charts below…the S&P 500 Channel that we are in, the VIX which has been ominously high despite the strong move so far, a feel for the Bull vs Bear Momentum as measured by the QID:QLD Total Dollar ratio and lastly its relationship to the Nasdaq which is a new perspective.
The Market is marking time waiting for the outcome from the G 20 meeting in London. The Prudent play is to Mark Time. Good Luck whatever you decide, but it is always “Your Call”.
Best Regards, Ian.
 Ian Woodward's Investing Blog