Ian Woodward's Investing Blog

Archive for June, 2009

Which Way is the Stock Market Windsock Blowing?

Tuesday, June 30th, 2009

  Werner from Amsterdam made an astute observation on the bulletin board which
suggested that the “Old” Silverback Gorillas we depend on to show the way and
that yesterday they were acting weak despite the SPX being up.  “Sczaplam” who
is a “newbie” to the Group and is eager to learn asked a follow up question for an
explanation.  So it is time to bring out the Stock Market Windsock to see which
way the wind is blowing:   

   windsock

Werner writes:
Some of the horsemen such as BIDU, AMZN, RIMM, AAPL & GOOG are acting
weak today, even though the SPX is green. Maybe another warning?

“sczaplam” queries:
In view of today’s action, could you expand on exactly what you saw to declare
the stocks were weak? Any chart views you use?  Thanks so much.

So let me show you how we do it using both HGSI software and also QuoteTracker
which dovetails with it.  As I have shown several times, the best way for an early
warning sign is to follow the Leaders and you need only go back a few Blog Notes
to see the 25 I have been using, so we will dub these the “New Gorillas, but I will
cover both.

Let’s start with the Old Silverbacks:

old

Always remember that leading stocks rise and fall above the 17-dma.  If their
Index breaks that moving average then watch out below, especially if they break
the 50-dma.  By that point your profits will have vanished.  At this stage the Old
Silverbacks are still intact as an Index, but they must get back up above the 17-dma
and then their recent collective high registered about 15 days ago.

Now let’s look at how the New Gorillas are fairing:

qt

gor

Although the last two days have seen a sell off, the Index is actually stronger as I
show at the bottom of the chart.

The bottom line is that the Leaders are still intact and at this stage the Windsock is
blowing East to West, i.e., in a trading range going sideways.  The true warning sign
is when they break the 17-dma to the downside.  The Bulls can take comfort if the
two Indexes break through the old high three weeks ago.  The Bears are Hungry
and waiting for their after July 4th meal.

Best Regards, Ian.

No Smoking Gun and the Bears are Hungry!

Saturday, June 27th, 2009

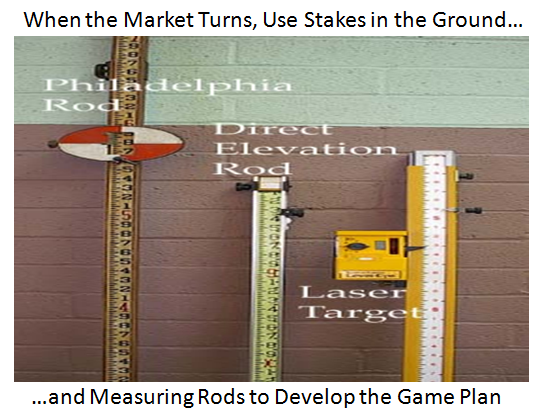
As you have gathered by now the lead off picture invariably tells the theme of the story line, but this time you will forgive me for using two pictures. 

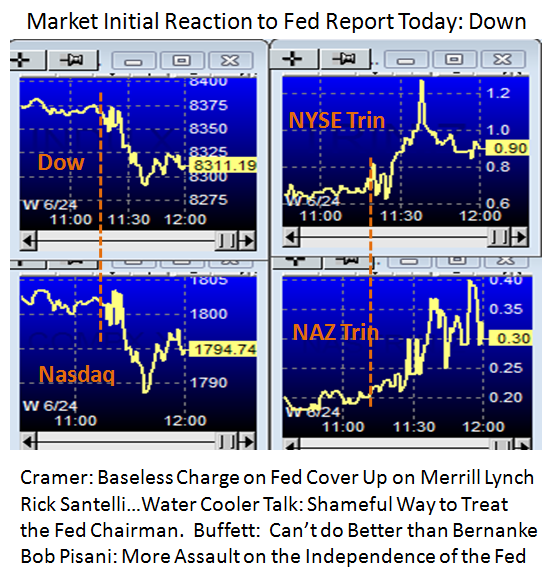
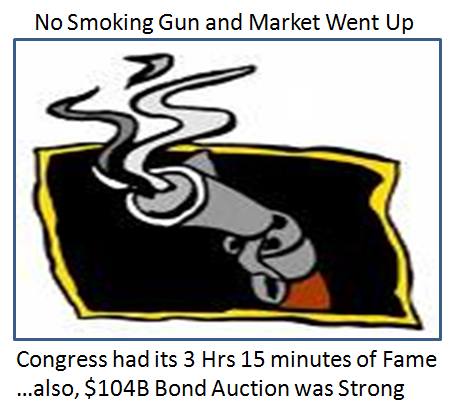
The first one is a continuation of the last blog where I left you with the thought that the Fed Chairman, Ben Bernanke was due to speak to Congress the next day and to expect him to vigorously deny any cover up, and true to form, they gruelled him for 3 hours and 15 minutes and he outfoxed them all.  The Market remained strong all day on Thursday, but in fairness it was not only due to his solid testimony but also the Bond Market had a roaring $104 Billion auction on that day.  In my opinion and I don’t often take sides on this mumbo jumbo…if they replace him at the end of his term, heaven help us all.  He has been the most trustworthy of the whole bunch.

            gun

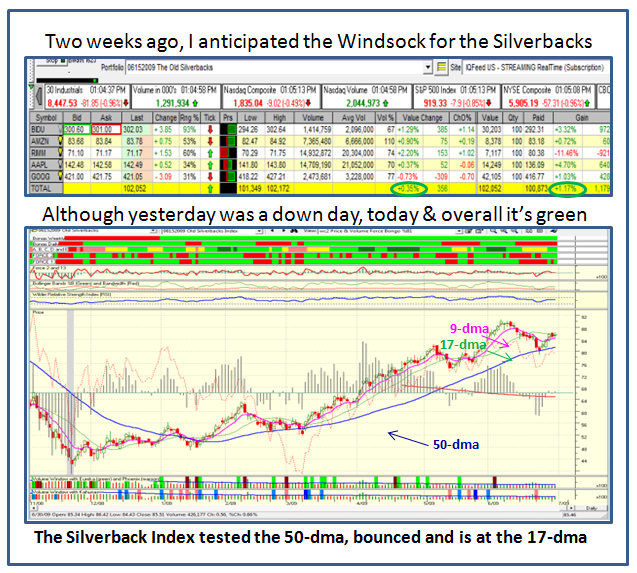
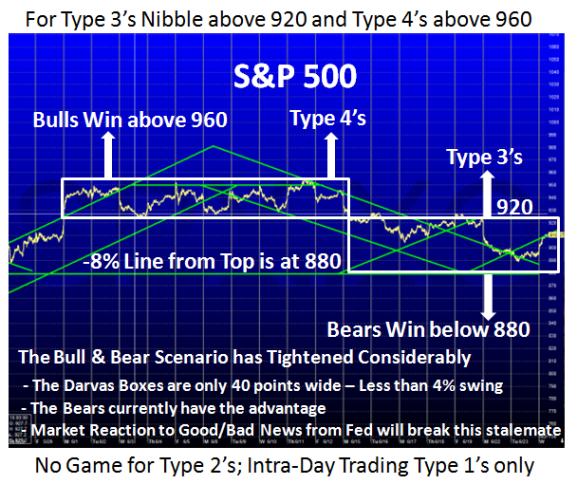
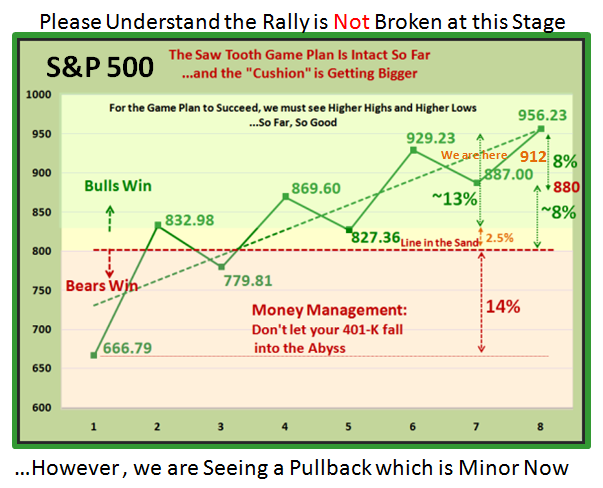
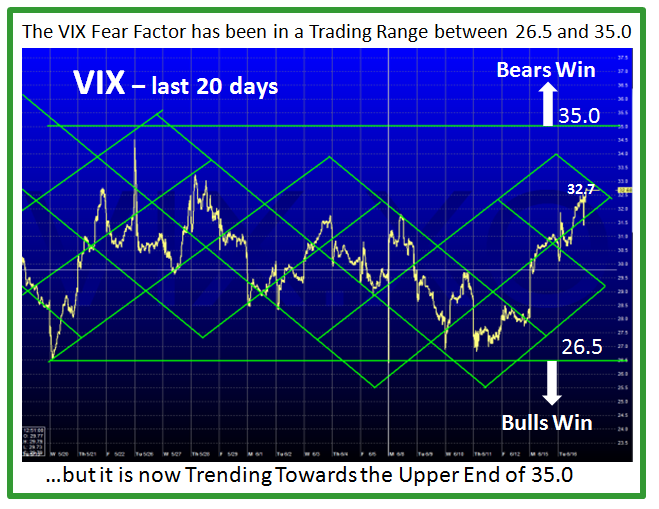
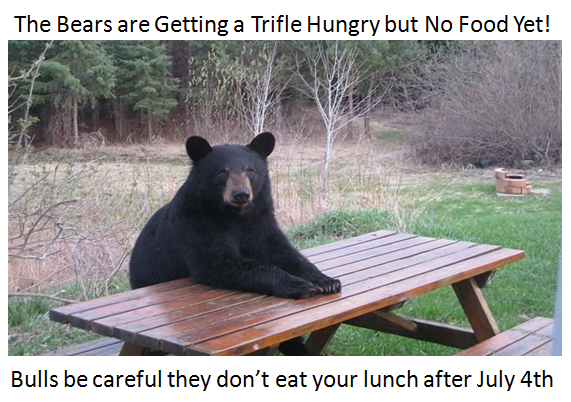
The second picture shows the tricky state of affairs on this market and we are literally again at the crossroads of the decisions we all have to make.   I gave you the early warning signs all of seven weeks ago, but I am getting ahead of myself, so let me introduce the latest theme:

bear

Now let me come back to the Pesto Sauce Picture I put up seven weeks ago on the blog note of May 13th, in which I showed you the signposts to watch for and then occurred, using the HGSI software to guide you.   I am sure those who follow my blog will recall the following chart and we had a good laugh on the Pesto Sauce cooking theme which “mk” introduced and I chewed on at the time. Unfortunately in this day and age people skim so here it is again to remind you:

pesto 1

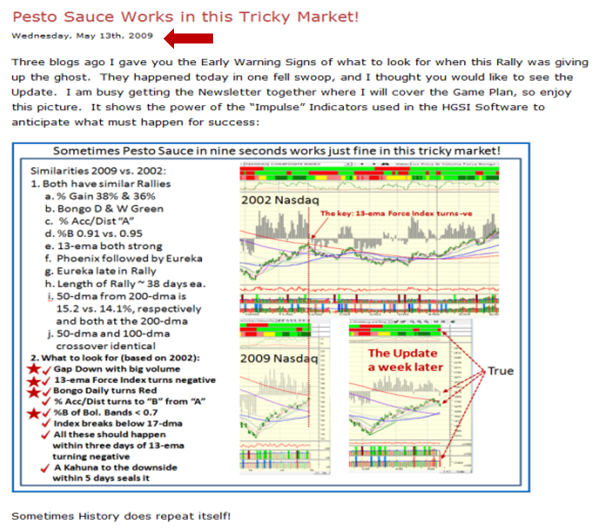
The moral of that story at that time is that indeed the market did correct, but NOBODY, nobody knows when and for how long.  I try to be fair and give you both sides of the coin, but it is “Always Your Call”.  The market will invariably fool you and I, and do the opposite.  However, the rest of the story is to always have an up, down or sideways plan and let the market tell you which way it is headed.  Never fall in love with one scenario.

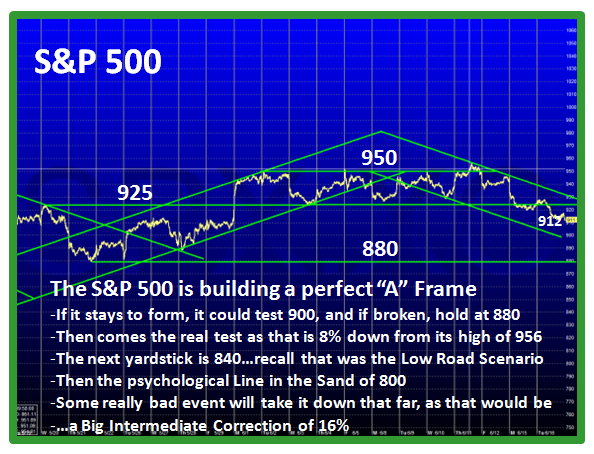
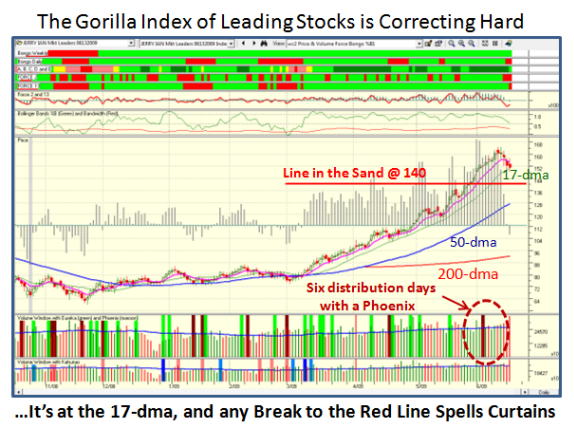
Given all of that, I offer you a new line on the Maturing of the Pesto Sauce Theme, in which I have UPDATED that chart of May 13 in the Bottom RIGHT HAND SIDE of the Chart, with the ten items that need to happen SHOULD this Market start to crater around Independence Day.   I don’t have a crystal ball and I am not suggesting there is something magical about after July 4th.  However,  with all the Russell 2000 re-balancing that took place on Friday that shot the Volume up and the fact that we are now nearing the end of the month, the quarter and the half-year mark, window dressing will be the focus next week.  It seems to me the serious business will come after they have had their fill of Hot Dogs, Hamburgers and Pesto Sauce!

pesto 2

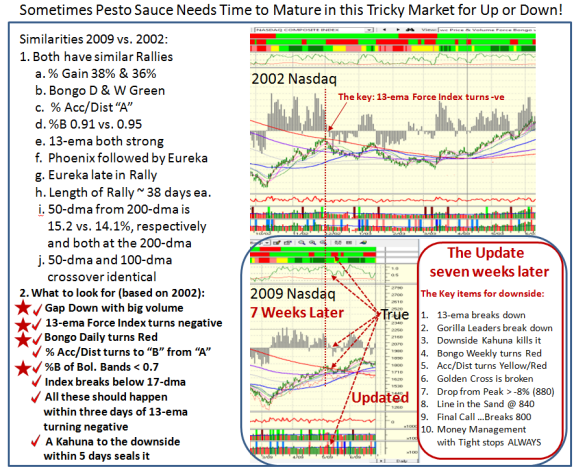
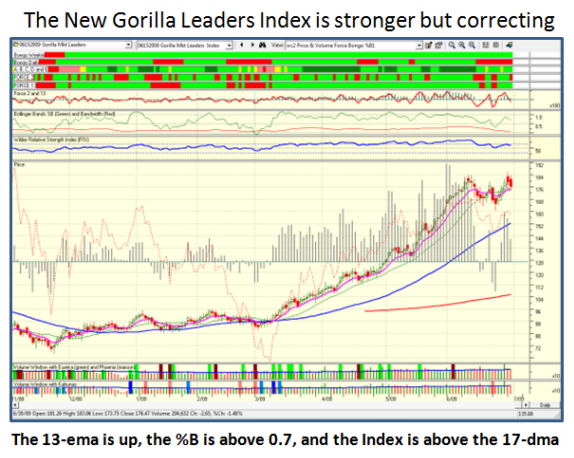
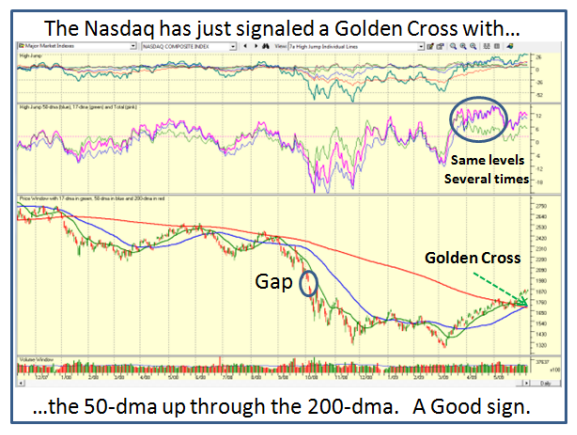
Note how the Chart shows that after declining for about 7% for a couple of weeks, it finally got enough oomph to break through the 200-dma with gusto and then dragged the 50-dma up to achieve the much-looked-for Golden Cross.   If you look above and below at the ribbons and “stakes” you can see that they were all positive.  Then the first signs of  once again starting to droop was the Bongo Daily going red and we saw the 13-ema breakdown, as shown.  If you look at the very last day we see the 13-ema is up again with a Light Blue Kahuna at the bottom, suggesting some momentum to the upside, but remember it was re-balancing day.

To the right of the bottom chart, I show the steps in the process for the Market to give up the ghost.  Don’t read anything into that, as I show below the items to watch for the upside:

1.   13-ema stays up and shows continued momentum by the growing size of the black bars
2.   The %B moves up again above 0.7 and heads for >1.0 along the way and stays up
3.   The Bongo Daily turns Green and stays that way along with the Accum/Distrib
4.   The S&P 500 rises above 920 as shown in the last blog where Type 3’s nibble
5.   The market surprises the Bears,heads up through 960 or stumbles there
6.   It won’t hurt to see an Eureka or two to show some irrational exuberance by the institutions
7.   It would be even better if they are accompanied by a Kahuna along the way
8.   Wonders never cease when the S&P 500 hits 1000, and the pundits will say “I told you so”
9.   All Golden Crosses would chalk up by then, be they measured in dma or ema
10. Type 4’s who didn’t enter will say “Shoulda, coulda, woulda”

And…so the cycle will continue and the HGSI signposts will continue to guide us as to which way the wind is blowing.  The one constant in all of this is that Money Management is key and keep tight stops until you have a big cushion.  Then decide how much profit you are prepared to give up to play for the long haul.  Just when you start to rub your hands and think you can do no wrong is when you should take some profits.

Now let me bring you down to earth – this market has only been playable by Type 1’s, the intra-day players.  Type 2’s have been frustrated, Type 3’s the swing traders know better not to gamble, and Type 4’s are on vacation.

Technical Analysis is a windsock, not a crystal ball [Carl Swenlin].

However, I offer you some Pesto Sauce to go with the July 4th celebrations.

pesto 3

Best Regards, Ian.

The Stock Market is Trapped in a Darvas Box!

Wednesday, June 24th, 2009

I found this picture that suits the current situation to a T, as we have been in a tight range for the past twenty plus days:

     box

The Ballgame has changed substantially; I can’t recall a recent previous occasion when the market went sideways for ten days in a row and couldn’t put together more than two days up or down, and then spend another ten days in a similar box between 890 and 920ish as shown below.  As my notes indicate, this market is down to Intra-day Trading with the bias in favor of the Bears as the Market awaits news from the Fed Report:

s&p

In sympathy with the S&P 500, the VIX has trapsed up and down in a similar Darvas
Box, where I show in the following chart that Bulls win below 26, bears above 35 and
we can only Hope for Relief between 28 to 32:

Many moons ago I came across Bill Luby’s blog “VIX and More” which I highly recommend to you as being THE expert on the subject of Volatility, and how to evaluate the VIX, etc.  One recent report that he has again covered is that the VIX is indeed Cyclical and shows you his research over 19 years for each month.  The bottom line is that the statistics show that the VIX invariably bottoms in the month of June and peaks in September.  He also suggested back in April this year that he did not expect the VIX to drop below the 25-27 area in the current bear rally.   Since we have reached that level, it does not bode well for the Bulls until we get past the summer doldrums or have a major surprise that drives the market to the upside in a hurry.  So please bear this cyclicality in mind going forward.

vix

On days like today when the Fed Report is due, most short term traders are cautious
and today was no exception.   The DJIA was up over 100 points at one point in the day having been up until the Fed Report came out.  It finished down 23 points at the close.

fed

Let me make sure I do not mislead you as to the reaction to today’s Fed Report as at
around the same point in time an explosive accusation came from a California
Congressman  making a charge of a Fed Cover Up on the Merrill Lynch acquisition by
Bank of America.  For the record I show four snippets of comments on the bottom of
the above chart, and leave you to make up your own mind.  You be the judge what took the market down to finish in a trading range yet again.

Anyway, the bottom line was yet another ho-hum day and hopefully with the Fed
Chairman due to speak to Congress tomorrow, you can rest assured we have not heard the end of this accusation and rebuttal in which the Chairman denied.

The problem we still have is that this Market is so event driven based on news from the administration, the Treasury Secretary, the Fed and the Congress that we are treading on egg shells with every new day.

Best regards, Ian.

Stock Market Signposts with Stakes & Measuring Rods

Tuesday, June 16th, 2009

At this stage of a pullback in the Stock Market it is time to bring out the Stakes in the Ground and Measuring Rods to identify the Game Plan.  That way one is not surprised should it turn into a full blown correction, given the first signs of real weakness we have seen the last few days.

      pic

You have seen the Saw Tooth Game Plan many times, so it needs no introduction.  We have a 16% cushion, and 8% down will take us down to 880.  We are over half way there at 912, so it is time to sit up and plan ahead as to what action you will take if we fall further:

plan

The S&P 500 hit 956 at the high and decided that was enough for now and finished today at 912 so we are 4.6% down from the high.  Heading down to 880 would kill several birds with one stone:

a frame

1.  Drop <8% down where 77% of Minor Corrections are halted
2.  Start the next leg of this rally after a pause to refresh at that level
3.  Breakdown into an Intermediate Correction of 12% to 16%
4.  Test the areas of support at 840 which you will recall was the Low Road
5.  Head down further to test the psychological Line in the Sand at 800

Types 1 & 2 will quickly turn from being long to turning to the short side;Type 3’s will be patient and wait for sunnier climes; Type 4’s will review the extent of the damage and if the Golden Cross of the 50-dma up through the 200-dma materializes for the S&P 500, Dow and NYSE, they will scratch their heads as to whether it is then time for them to enter.  The Nasdaq and NDX (Nasdaq 100) should already be above whether it is measured with Simple or Exponential Moving Averages…whichever tickles your fancy.

Another way of assessing the extent of the potential damage is to turn to the Fear Factor of the VIX which has been relatively benign this past month.  However, after seemingly wanting to head down below 26.5 three days ago it turned turtle and has shot up to 32.7 as shown in the chart below:

vix 1 year

vix 20 days

Don’t stop there, but use a third approach to see if the underlying strength of the Leading Gorilla Stocks are holding up or giving up the ghost.  The last two days have been ugly, but that is the whole purpose of using these as a yardstick for early warning of good or bad things to come, since they are fat with profits.  My good friend Jerry Samet sent me his list of top stocks and I rounded it up to give us 25 in total…most of which I have shown you in recent blog notes.  Note half of them got walloped today, which should not be taken lightly.

leaders

chart

It’s always “Your Call”.  Best Regards, Ian.

Up, Up and Away with the Bears in Dismay!

Tuesday, June 9th, 2009

Since my last blog, I suggested that we might be “Up, Up and Away on a second leg of this rally”, and it looks as if that is in the making.

          Up

As Type 4 Buy and Hold Investors now fully know, they wait for a Golden Cross before they have some assurance that the Market has turned in their favor.  We have been keeping an eye on the 50-dma crossing up through the 200-dma, and although the S&P 500, DOW and NYSE are still working their way to that goal, the Nasdaq 100 and Nasdaq have done it.  That invariably bodes well for gathering momentum to the upside so it would be prudent to watch these two Indexes to see if they can make the next appropriate goals.  I left you with a clue as to which way the wind was blowing by giving you some 29 Leading Stocks that had paused to refresh.   That was three weeks ago and to make the point that bunch is up 12% as a group; so tuck that lesson away for the next time:

results

Before we get into next steps, you will also recall that I have left you with the Three Road Scenarios several times before now.  The one most familiar to you would be the 840, 940 and 1000 Scenarios for the S&P 500.   We are still wandering around the 940 level and are currently at 942.43, so 980 to 1000 is certainly within reach.  This time I will show you what to look for on the Nasdaq, if we are to move up a further leg before we see a reasonable correction:

1.  The High Jump comes into play at this stage
2.  The Gap up between 1905 and 1947 presents a nice opportunity to close it
3.  The Cushion to the support at the 50-dma or 200-dma is comforting at 10%

The higher it goes from here which is 1860.13, the better the cushion.  Likewise, we
have only another 45 points to go before we reach the gap, so keep an eye out for
that vacuum to be filled if we get to 1905.  That takes care of points “2” and “3”
above, so now we need to explore the High Jump. 

As you well know, the High Jump has  been a valuable tool when one gets extended
(overbought) or the reverse with the Limbo Bar for a Base Low (oversold).  We use the % of the 17, 50 and 200-dma from the Index added together to give us the High Jump.  Here is a trick I learned from one of my “students” many moons ago.  Her name is Michelle Anvary and she alerted me that it is useful sometimes to use the 17-dma and the 50-dma only rather than all three items.  This is particularly true when the sum of the 17-dma and 50-dma from the Index consistently reaches a similar level as shown in the chart.  It pays to look at the highest reading of the 17-dma and the 50-dma during this period.

Given that the result for the standard 17, 50 and 200 High Jump is already higher than any reading during the past year, we have to go back all the way to the breakout of 2003 to see similar numbers.  Instead of doing that (which I leave you to do as an exercise), we can zero in on the 17-dma and 50-dma combo to arrive at an estimate, as per below:

High Jump

On 3/23/2009 and  4/30/2009, the Hi Jump readings for the 17-dma & 50-dma are 11.69% and 15.55% at their peaks, respectively.  Applying those numbers to the current readings we get an estimate of:

a.  1.1169 x 1774.30 = 1982 for the 17-dma, or
b.  1.1555 x 1698.19 = 1962 for the 50-dma

So there you have it…three tests-of-reasonableness that suggest that this rally for the Nasdaq could have legs that can reach either 1947 (Close the Gap), 1962 or 1982 if it goes above 1905, which would be the normal resistance level. 

The Ratio of S&P 500 to Nasdaq = 942.43/1860.13 = 0.5066

Target      Nasdaq    S&P 500     % above Base Low (667)
Current      1860          942                     41.2%
Medium      1905          965                     44.7%�
High          1947          986                     47.8%
Higher       1962          994                     49.0%
Highest     1982         1004                     50.5%

The bottom line is that the original 840, 940 and 1000 Lines in the Sand were reasonable targets established months ago.  We can get turned back here at the middle road scenario in which case we have a 10% Cushion to Support at the 50 and 200-dma, or go on to strive for 1000 on the high road scenario.

Best Regards, Ian.

Copyright © 2007-2010 Ian Woodward
Disclaimer: Commentaries on this Blog are not to be construed as recommendations to buy or sell the market and/or specific securites. The consumer of the information is responsible for their own investment decisions.