Stock Market Key Upside & Downside Targets
Tuesday, March 30th, 2010I am sure you all know by now that we had a very fruitful HGS Seminar and a good time was had by all. The overall mood was Happy Days are Here Again, but stay light on your feet as things are getting Peaky!
To kill two birds with one stone this note will summarize the presentation I made in 12 slides and hopefully give some sollace to those who did not attend of what they missed. Also for my newbie blog friends I show the power of the product in slicing and dicing the market in several ways and urge them to try the HGSI Software with a free sixty day trial, which they can register for on the top right hand corner of this blog site.
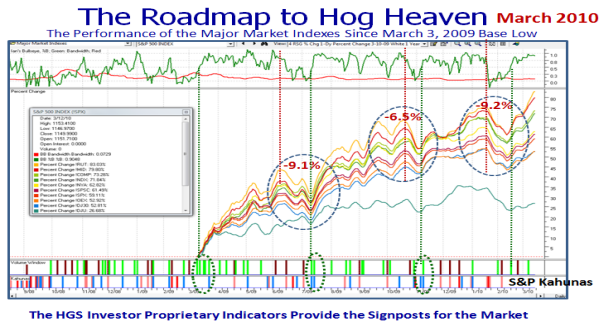
The single most effective slide that shows the power of the product’s strength is its proprietary Indicators as shown in this next slide. Now that we have a year’s worth of this booming rally, a picture is worth a thousand words to show that power:
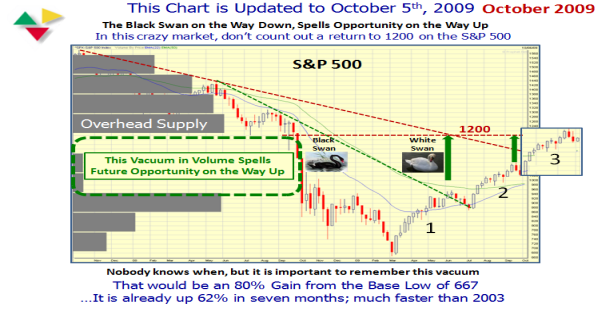
Many moons ago I gave you a winky-winky that the Black Swan we had in late 2008 would produce a White Swan opportunity in that there was a Volume Vacuum in coming back on the return path as shown below:
The good news is that we are almost there…the bad news is that we now begin to hit Overhead Supply.
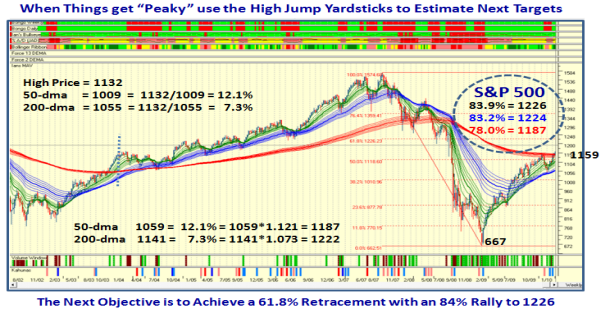
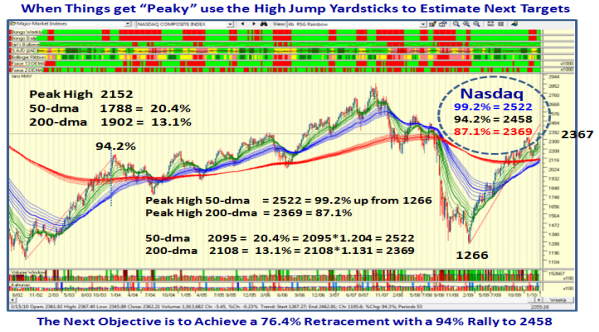
The Camp Sunshine High Road Scenario suggests that IF the Rally is to continue we should expect to reach 1225 & 2450 say on the S&P 500 and the Nasdaq, respectively, before these Indexes are extremely extended. The next two charts show the rationale by using both the Rainbow and High Jump Extension to guide us:
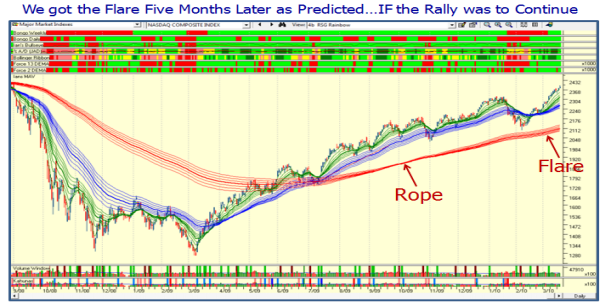
At the October Seminar and on this blog I showed you how the Rainbow Chart must first give us a tight Rope and then Flare out to demonstrate extension, as shown below:
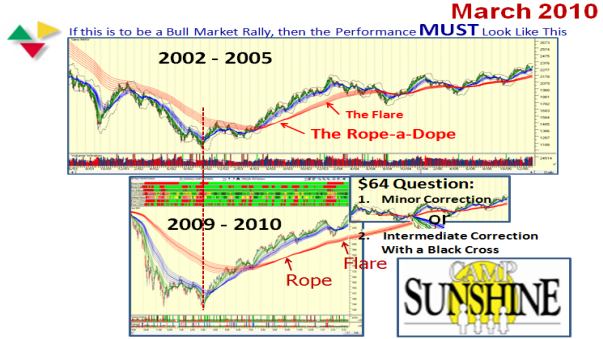
That extension happened these past three months as shown in the next chart and now helps us to establish two scenarios from here:
1. Do we suffer a Minor Correction of 8 to 10% or
2. Do we have an Intermediate Correction with the strong possiblity of a Black Cross as shown in the next chart:
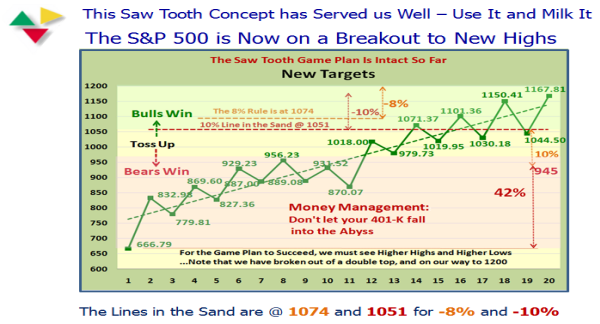
The Trusty Saw Tooth Plan gives the Longer Term Type 3 & 4 guidelines of the Lines in the Sand for an 8% and a 10% Correction and also shows that anything below 1040 would bring into serious question of whether the Party is over for now.
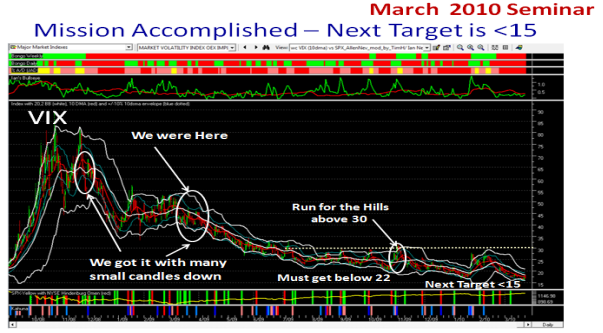
Those who regularly follow my prognostications on the VIX will immediately recognize this chart and understand that the next Target for the Bulls is 15, and for the Bears is back to 30. It is currently at 17.26:
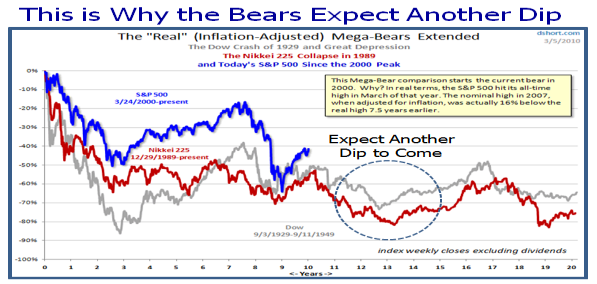
Now let’s turn to the Gloom and Doom Camp…they have had mighty slim pickings of late but are waiting patiently for their day to come, after many false alarms where they have been so bitten that they are not showing their true fangs AS YET! In this next chart which uses an excellent depiction at the dshort.com website (they do give permission to use their charts provided we give them credit which I am doing), we can immediately see that they expect another big fall based on past models of Mega-Bear Markets:
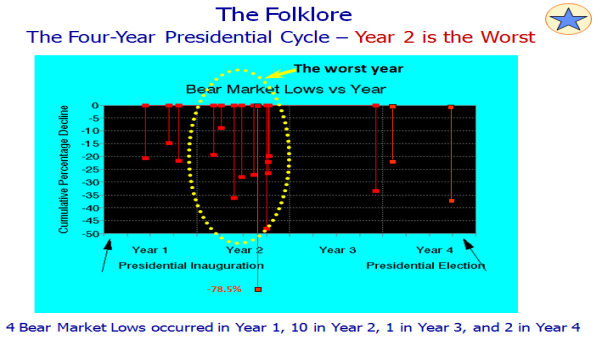
HGS Seminar Attendees always get my usual reminder that the second year of a Presidential Cycle is the Worst Year for Bear Markets, so to be forewarned is to be forearmed:
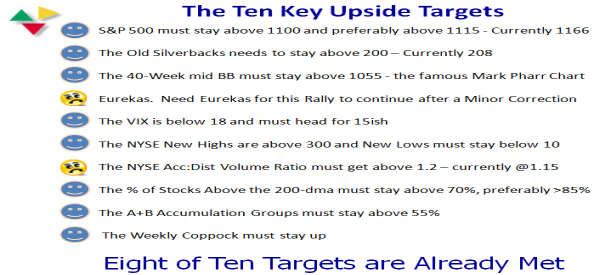
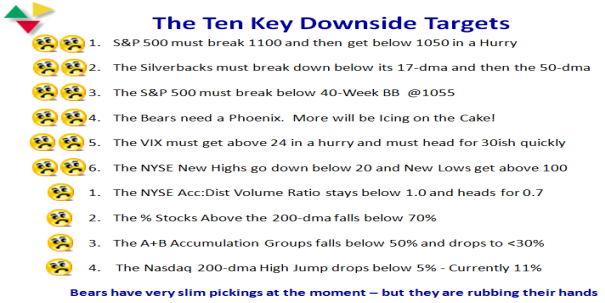
Last but not least here are the familiar happy and glum faces for you to enjoy on the Upside and Downside Targets for the immediate future:
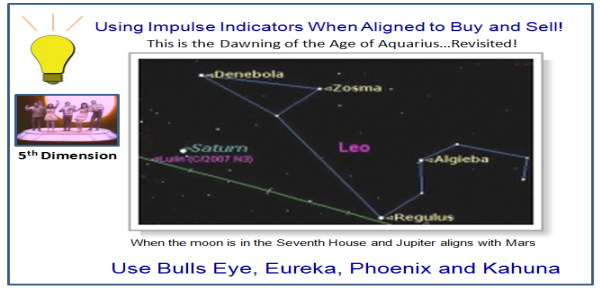
As always, there was one MAJOR Nugget that attendees got at the Seminar which was worth the second million they are about to send me since they are well on the way to making it. I gave Newsletter Users a glimpse of what they would see and I will leave the attendees to say whether it was worth it all. As they walked out the door, I was glad that they all felt Ron and I had raised the bar one more time. This time they have a Golden Nugget for both the Upside and the Downside Scenarios when the “Moon is in the Seventh House and Jupiter aligns with Mars using Bullseye along with Eureka, Phoenix and the Kahunas.” This time they went away with a lock on the Fifth Dimensions song of 1969…time flies when you are having fun.
Best Regards, Ian.
 Ian Woodward's Investing Blog
