Ian Woodward's Investing Blog

Archive for April, 2010

Stock Market – “PIGs” Fight Back!

Wednesday, April 28th, 2010

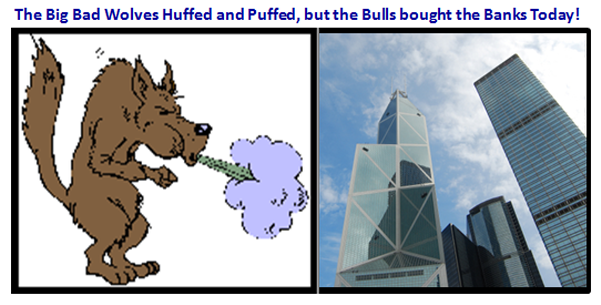
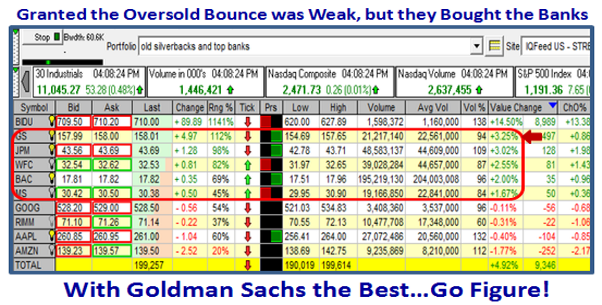
Maybe Hellicopter Ben came to the rescue today by announcing there would be no change in Interest Rates, or maybe it was a weak bounce from a badly oversold market, but the Banks were strong today with Goldman Sachs making the biggest gain…go figure!

pigs

banks

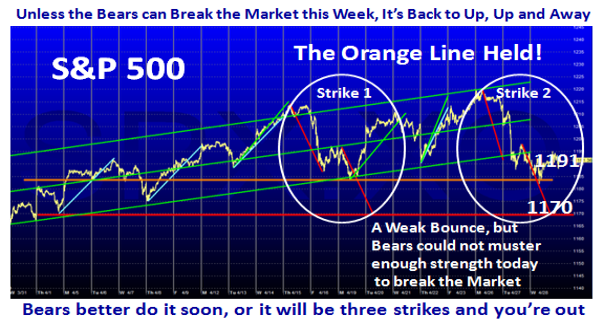
Let’s see if my suggestion that  the Bears must get cracking by this weekend or this market is headed up again one more time comes true.  The Orange Line held:

sandp

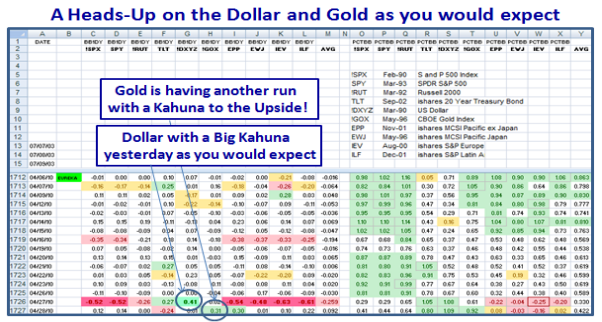
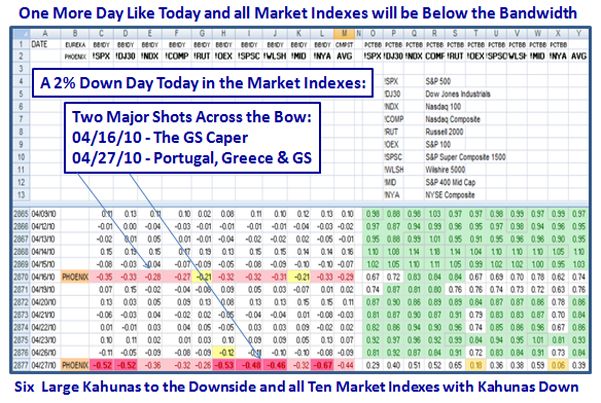
It seems from the number of hits I had yesterday that many of you are enjoying the Bullseye picture which as you all know is the %B coming up through the Bandwidth and/or there is a big Kahuna which is a one day change in %B either to the upside or downside.  Here are a couple of tidbits for you again today:

ss

Best Regards, Ian.

Stock Market: The “PIG” Strikes Again!

Tuesday, April 27th, 2010

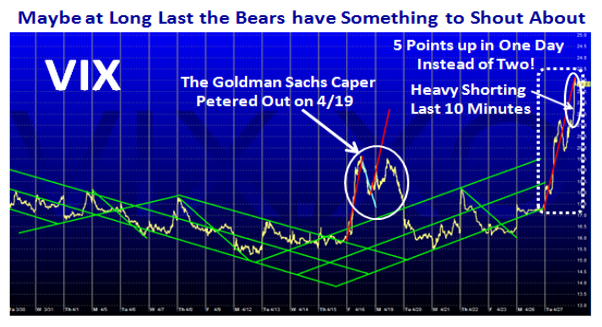
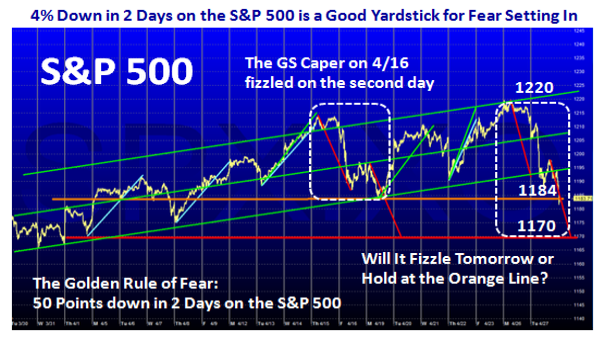
I had to stretch my Acronym a bit but Portugal, Institutions (ala GS) and Greece all hit the headlines today and that caused a “Really Big Shoe” to drop with a 2% decline today in most Market Indexes.  Let me not waste time with words, but show you the four pictures that sum up all our feelings for the day.   One more day like today and the Market Indexes will be below the Lower Bollinger Band, and you all know I don’t have to spell that out for you!  Seminar Attendees will enjoy the Last Chart.   The charts are well annotated so you draw your own conclusions:

shoe

vix

s

ss

Enjoy!  Best Regards,

Ian.

Stock Market To Da Moon

Friday, April 23rd, 2010

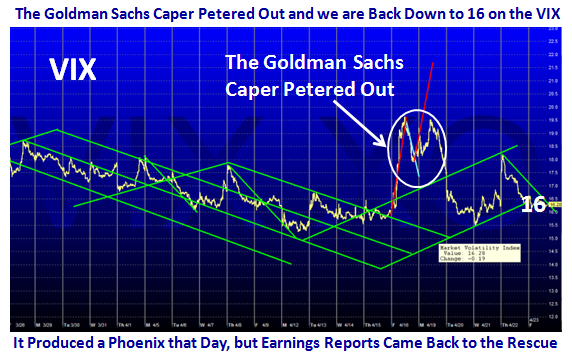
I couldn’t avoid a tongue in cheek headline for this blog note.  Everyone is aghast at the way this Stock Market Rally keeps sluffing off bad news and keeps trotting along the yellow brick road.  Sooner or later it will end, but there is only one way to behave – it’s YOUR stocks in YOUR Portfolio that matter.  This was an unusual week after the GS Caper, where the mood of Fear was soon tested…Fear for a day and a half, which dissolved as quickly as it appeared with the mood swinging back to recognizing many good Earnings Reports.   So the Bulls are still looking to a full moon.

      moon          

We are back down to 16ish on the VIX, so that sudden hiccup never followed through, the Bears tried but no cigar:

vix 

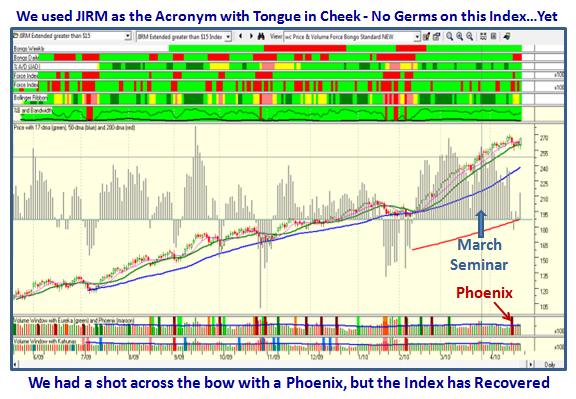
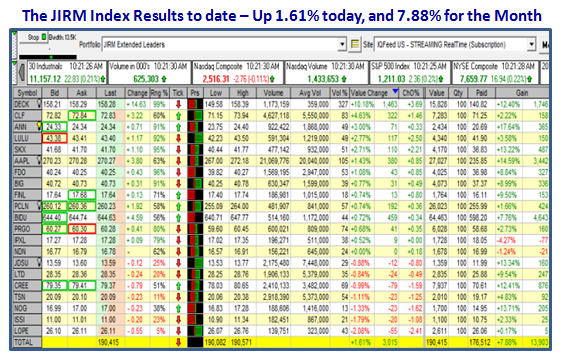
So far, so good.  There are no Germs on the JIRM Index which has gained about 8% in the past month since it was generated, or about 2%/week, which includes the downdraft that occurred from the GS Caper, as these stocks were hit hard for two days.  Note that only two stocks are under water and not by much:

 jirm

ss

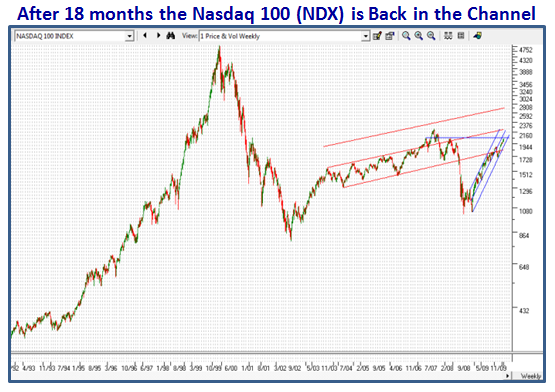
It sometimes pays to step back and see where we stand in the bigger picture.  The Nasdaq 100 (NDX) is already in the 2003 to 2007 Channel, and the Bulls hope it will stay there.  Whether it can push through to 2300 is another matter, but what does matter is when it is tested again on the downside at around 1825 or so:

ndx

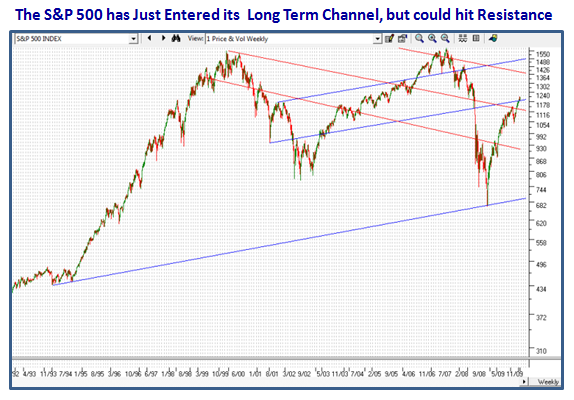
Prolonging the theme suggests that the S&P 500 is already close to running out of steam or can push on to new heights at certainly 1365.  Wonders never cease, but we shall see if this Stock Market Rally has enough legs to last to 100% Gain!

sandp

By the looks of things, the Bears don’t yet have the fight en masse, and the Bulls continue to buy every dip.  Realize that the Large Players have the control, so play close to the vest, especially if this Market goes into a Climax Run as that will signal the Small Players have gone ga-ga.

Best Regards, Ian.

Stock Market Rally – Days are Numbered

Sunday, April 18th, 2010

I am a little pushed for time so I will fall back on snippets of a Running Commentary with my friend and Seminar Attendee, Hsin, and others over the last three days.  We also covered this at yesterday’s Monthly HGS Investor Meeting, so all are up to speed.

Wednesday, 14th April, 2010

When you start rubbing your hands with glee, for sure that is the time when the Market is nearing a top:

pic

Recall the Targets I gave you at the seminar and have since posted twice on the blog…it suggests we are very close to the top for now:
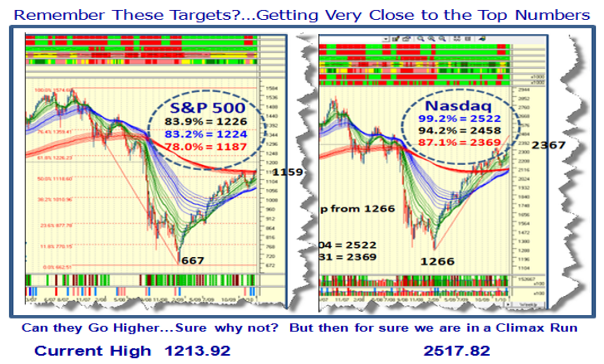
targets

Now the $64 question is when will this beast give a Climax Run?  The answer is very soon, and I am claiming that some form of correction is due within a week to ten days.  We shall see, as you well know nobody knows for sure.  But why do I even suggest that?
ss

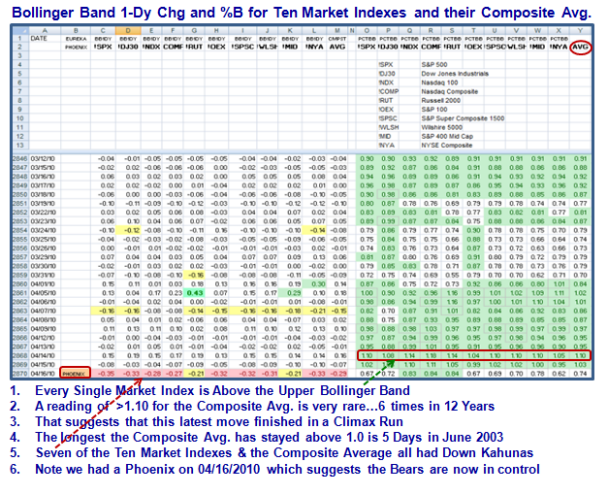
Hsin, you now have eyes in the back of your head…just look at the  chart above and you will see from my notes why we are in VERY RARE Territory.  There are only six other times in 12 years that the COMPOSITE AVERAGE of %B of the Bollinger Bands of all ten Market Indexes have been above 1.1.  I go on to give you additional statistics on that slide so enjoy before I put up my blog hopefully this weekend.  Only back in June 2003 did the Composite of these ten Mkt Indexes stay ABOVE the Upper Band for five days before they began to drop. 

 We have no way of knowing when the break will happen and there are many other things you should watch to see if they are breaking down, none the least of which is the JIRM Index…it will be one of the earliest clues.

The Three Scenarios:

1.  A SURPRISE Knee Jerk down which will cause an obvious deterioration that all will see quickly
2.  A Climax Run which will surpass the Targets I show on the 3rd chart…give it a few more strong UPSIDE days
3.  A gradual fading of the rise with a correction that either gains steam or is minor and the rally goes again.

Don’t be TOO Eager to switch to the Short Side TOO FAST, is my next suggestion to you.  The stock Market is not a Black or White, on-off switch, flip-flop, call it whatever fits your fancy…especially at the top.  There are shades of Gray that you have to watch for very carefully.  After all, what caused this sudden additional recent euphoria…INTC and JPM, Technology and Big Banks firing on the same day.  Days like that don’t get turned off quickly.  So make sure to keep an eye on the Old Silverbacks and Top Banks list plus the additional obvious ones you added such as CREE, NFLX, ISRG, PCLN, BUCY and PRGO, etc. etc. If you have to pick one stock of all to watch it should be CREE, why?…because it has given us >16% since the Seminar and is double all the rest.  Late Breaking News:  Note that they hammered GOOG after hours.

Good Luck,  Ian.

Friday Night, April 16th, 2010

Well Hsin:  Scenario #1 worked today so no need to look further after all that anticipation.  But at least we knew we were close to the top, which again was pretty obvious, so no cigar!  Since it is also Options Expiration day, we should be patient and see where they close this beast. The cigar comes with what happens next? 

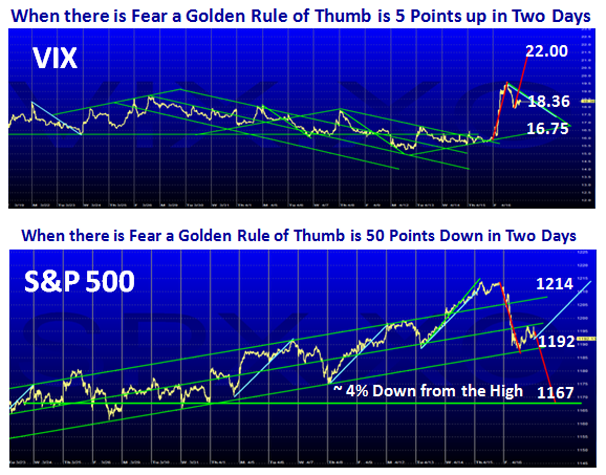
Either the VIX drives up another 3 points to 22ish and the S&P 500 goes down another 25 points (as I gave you GOLDEN Rules previously) and the party is over, or the Bulls come charging in to buy, buy, buy.  With something as serious as GS Fraud charges, I suspect it will be the former.  The floodgates open up below 1165 on the S&P 500, and will have wiped out the last 20 days gains.
vix

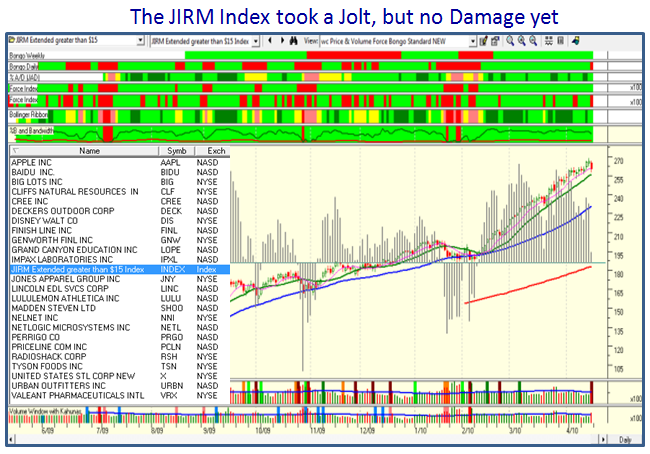
In any event you now have the tools to tell you which way the wind is blowing…JIRM (an acronym named after four people at the seminar) is blood red today with all stocks negative at -2.37% down as I write.
jirm 

Six stocks are already under water since we made the list, and another day like today will net another five or six to zero or negative gain.  That spells half the leaders if that were to happen.  That’s all you need to look for…period.  Then the cigar comes with what happens after that.  I will wait on your thesis!

Best Regards, Ian.

Stock Market: How High is Higher?

Tuesday, April 6th, 2010

When things get “Peaky”, turn to the High Jump Tool I have taught you to use time and time again.  Just type in “High Jump” in the Search window of this blog and you will see how I have used it previously with success.

       moon

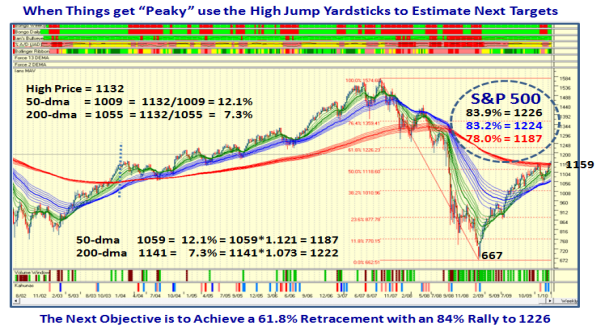
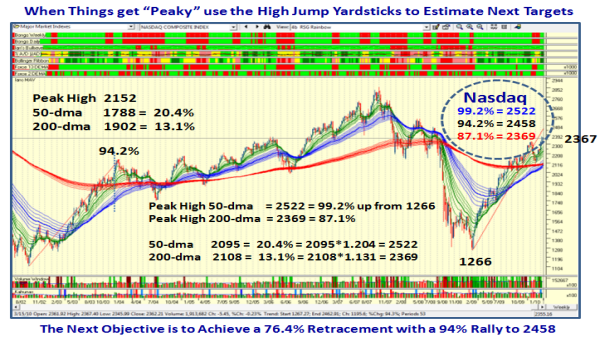
I just gave you two snapshots in my last blog of the Rainbow Charts using the High Jump parameters from 2003 as a guide.  Here they are to refresh your memory:

s and p

nasdaq

You will note that in the last week, we have now risen above the 1187 target on the S&P 500 and  reaching for the 2458 Target on the Nasdaq.  So now is the time to refine the Targets.  So to cap it off, here is a simple rule of thumb to use for a quick estimate for how high is higher:

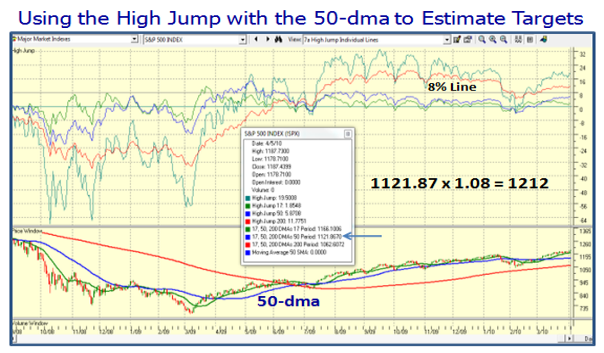
Use 8% above the 50-dma and you have a good feel for what is the next level.

 If you don’t believe me, use the “7a High Jump Individual Lines” View in the HGSI Charting Module Software and you are there:

high

The premise is that this Market is headed into a Climax Run and 8% is the next logical level.  Let’s get past 8% before we think of Supreme Greed setting in at 10%, but for your convenience here are both numbers:

% above 50-dma     8%     10%       Today 4/6/2010

S&P 500                 1212    1234              1189.44

Nasdaq                   2463    2509              2436.81

DOW                     11287   11496            10969.99    

The Bottom Line Message is that one or two more 1% to 2% up days and the Market will have met these Targets.  Also, the VIX is now down to 16.50 or so, and it won’t be long before it seeks 15ish if the market keeps rising.  Options Expiration is on Friday the 16th. of April, and Earnings Reports will begin in full force the following week for three weeks.  Sooner or later expect the fireworks to start.  To be forewarned is forearmed, but nothing has cracked yet.

Enjoy…Ian.

Copyright © 2007-2010 Ian Woodward
Disclaimer: Commentaries on this Blog are not to be construed as recommendations to buy or sell the market and/or specific securites. The consumer of the information is responsible for their own investment decisions.