Stock Market: How High is Higher?
When things get “Peaky”, turn to the High Jump Tool I have taught you to use time and time again. Just type in “High Jump” in the Search window of this blog and you will see how I have used it previously with success.
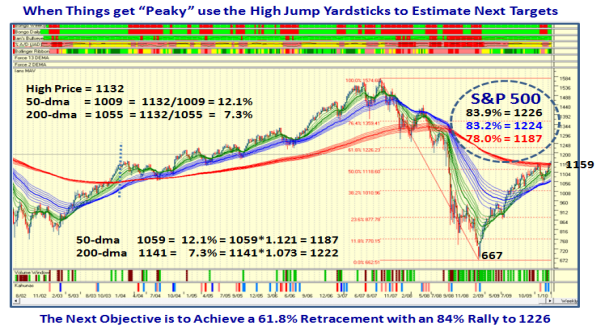
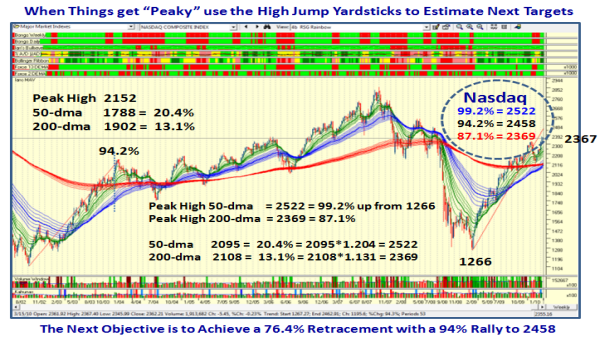
I just gave you two snapshots in my last blog of the Rainbow Charts using the High Jump parameters from 2003 as a guide. Here they are to refresh your memory:
You will note that in the last week, we have now risen above the 1187 target on the S&P 500 and reaching for the 2458 Target on the Nasdaq. So now is the time to refine the Targets. So to cap it off, here is a simple rule of thumb to use for a quick estimate for how high is higher:
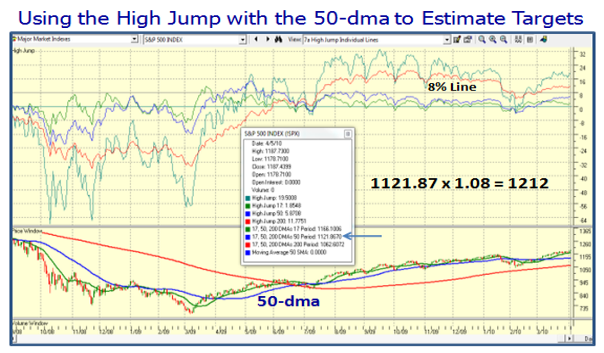
Use 8% above the 50-dma and you have a good feel for what is the next level.
If you don’t believe me, use the “7a High Jump Individual Lines” View in the HGSI Charting Module Software and you are there:
The premise is that this Market is headed into a Climax Run and 8% is the next logical level. Let’s get past 8% before we think of Supreme Greed setting in at 10%, but for your convenience here are both numbers:
% above 50-dma 8% 10% Today 4/6/2010
S&P 500 1212 1234 1189.44
Nasdaq 2463 2509 2436.81
DOW 11287 11496 10969.99
The Bottom Line Message is that one or two more 1% to 2% up days and the Market will have met these Targets. Also, the VIX is now down to 16.50 or so, and it won’t be long before it seeks 15ish if the market keeps rising. Options Expiration is on Friday the 16th. of April, and Earnings Reports will begin in full force the following week for three weeks. Sooner or later expect the fireworks to start. To be forewarned is forearmed, but nothing has cracked yet.
Enjoy…Ian.
 Ian Woodward's Investing Blog


