Ian Woodward's Investing Blog

Archive for August, 2010

The Hindenburg Omen did NOT Volley & Thunder

Thursday, August 12th, 2010


Those who follow my musings, including the large number of Hindenburg Omen followers I have as a result of my early warnings back in November 2007 of potential Market Tops, will strike a chord with this Blog Note today.  I value the mention in Wikipedia of one of the Blog Notes I wrote back then which has attracted a lot of attention from those followers over the years and especially of late.  It’s called “The Hindenburg Omen Signals between 2005 and 2007.”   I knew something was astir yesterday when I noticed a  large number of “hits” on the blog from the Hindenburg contingent, including four inquiries regarding the possibility of a Hindenburg sighting!

As you are well aware, my work looks for the extremes in Market Internals or as John Bollinger would say “The Fat Tails” ends of the Equation, i.e., the unusual Impulse Signals that the Internals of the Market give from time to time.  I realize that to some of you that the “mish-mash” of terms you have had to learn may have little meaning, but I also believe that over time these very signals have been a god-send to us who now see their value.  That’s part of the fun.  Terms like Bingo, Bango, Bongo, Eureka, Phoenix, Kahuna, and Hindenburg Omen are now part of the vernacular and can only be found to help you by using the HGSI Software.  They help in understanding the moods and emotions that rule the Market from Euphoria to Fear, Capitulation, Hope and Optimism to name a few.

So, let’s start with the Definition of the Hindenburg Omen:

Please understand that a single Hindenburg Omen (HO) “firing” does not constitute a confirmed condition…it requires a minimum of two within 36 days, so even if we were to have a spurious signal it is highly unlikely that we will see another one given what has just transpired yesterday.  Furthermore, these signals come in bunches at tops in the market usually after Long Rallies of at least a couple of years or more.  In addition, it would be extremely unusual for one to get such a signal after having just tolerated a >17% Correction in the market only a couple of months ago. Yes, of course, we have seen a spurious Hindenburg Omen fire but they are to be ignored.   Here for the record was the last time we saw such signals in droves, despite what you might read elsewhere on the Internet:

Now as for yesterday, you can see we have a clean slate.  The 52 Week Lows were not quite enough to meet the criteria, and the 52 Week Highs were more than double the 52 Week Lows, thereby violating Rule #5.  Of course times have changed since these rules were made several years ago, especially with the High Frequency Trading (HFTs), doing their stint…or should I say stunt?!  If the market continues to deteriorate, then the chances of the NYSE 10 Week Moving Average continuing upwards is mighty slim to nil, and will also negate any chance of us seeing multiple HO’s any time soon:

My Good friend and partner, Ron Brown, who does a Weekly Report which you can get at
http://www.highgrowthstock.com/WeeklyReports/default.asp nets out the current situation as a Trendless Market:

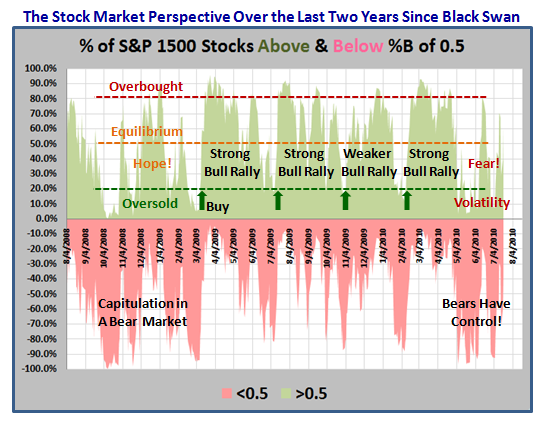
However, that said, I do have a new “Fat Tail” Measurement of Euphoria using %B Buckets to Identify Early Warning Signs of a Correction in my Newsletter which will be out this weekend.  I will leave you with the following status of the tug-o-war which the Bears are winning hands down.  Remember that what you are seeing is the Percentage of S&P 1500 Stocks which are Above (green) and Below (red) the Middle Bollinger Band of %B = 0.5.  The Bears have it by a whopping 77% to 23% as of yesterday:


Be very cautious how you play this market until you see which way the wind is blowing, but for the moment it is in your face.

Best Regards, Ian.

Somethings Gotta Give Part 2

Sunday, August 8th, 2010

Last week we had the dogs in a tug-o-war and I felt “Somethings Got to Give”.  We had a relatively quiet week after a great Monday with an Eureka Recorded to give the Bulls hope, but we are still in stalemate:

In the last Blog Note, I finished with this chart, but I have updated it to show you that two important things happened for the Bulls this week: 1) The 50-dma has turned up from Flat, an absolute pre-requisite for a Breakout, and 2) As I said above we had an Eureka on Monday, which showed Bullish Momentum:

You will recall that I showed you that we had an extremely bullish signal 10 Days ago when we saw 536 Stocks of the S&P 1500 (over 30%) were above the Upper Bollinger Band.  This had only happened three times since the March 2009 Rally:

So, let’s see what has happened since then and we find that the Index has held up for nine days since then and that we had a small shot across the bow on Friday, since we see that three of the “Buckets” are showing >100 stocks in each below the 0.5 level (Pink):

So let’s take a look at the 4 most popular Market Indexes and we see that they are all poised at the Down Trend-Line as shown, but the S&P 500 and S&P 1500 are leading in that they have already made some signs of breaking out, while the Nasdaq and IWM ETF, which is a surrogate for the Russell 2000, are lagging and the latter is not quite at the red line.  Realize that there has been recent rebalancing of the Russell 2000, so it might be a trifle sluggish at this point:

The Next Chart shows the Pie Diagram for the past two week’s performancer of the S&P 1500 showing %B above and below 0.5:

It shows at a glance that we have come down this last week to a reading of 66%:34%, which is still respectable, but it is getting borderline.  There are now three “Buckets” which have 100 stocks in each that are below 0.5 for %B, so there is some deterioration.

Lastly, the Battle is still on and depending on whether you are Bullish or Bearish, I can tell you that it is still a tough call, but maybe we will know which way the wind is blowing, i.e., do we continue up or do we fall back.  I show the picture…you decide, but tread carefully:

An Eureka or a Phoenix at this stage of events will be the clue.

Good Luck and Best Regards, Ian.


Market Tug-O-War…Something’s Got to Give!

Monday, August 2nd, 2010

Each week we get closer and closer to seeing if Golden Crosses prevail over Death Crosses or vice versa, or Head and Shoulders Tops win out over Inverse Head and Shoulders Bottoms!

We are now at the point where “Something’s Gotta Give”. Last week was a ho-hum week, and the results of %B above and below 0.5 is shown for each day last week, below:

I’m sure you would like to know how the Nasdaq finished the week with the Bulls and Bears tug-o-war, so here it is for Friday:

We had a Bad Spell with a couple of Fakey’s where the %B came back down through the Bandwidth, causing yet another Bull Trap a couple of week’s ago. As you can see we have now weathered the storm and the Bull’s have control at present with the Eureka on 7/26/2010 and the %B ratio as mentioned above:

My good friend Bob Meager came up with a way to show the %B and Bandwidth on the Think or Swim Software product, which allows me to display all that I have taught you about Phoenix, Bingo, together with Fakey’s (Bull Traps) and how to spy Early Warning Signs of weakness when the Index Skips Buckets on particular days. A Bucket is defined in this instance as a %B Spread of 0.1, i.e., 0 to 0.1, 0.1 to 0.2, etc. Note how the Phoenix Signals and the %B Skipping Buckets as shown below gave early warning and could help the alert trader that it was time to change from Bullish to Bearish before the big fall:

…And so we come to our favorite “wc” chart which clearly shows the congestion around the various moving averages, and so we wait to see which way it will break out or down this week:

Good Luck this week, with Best Regards, Ian

Copyright © 2007-2010 Ian Woodward
Disclaimer: Commentaries on this Blog are not to be construed as recommendations to buy or sell the market and/or specific securites. The consumer of the information is responsible for their own investment decisions.