Stock Market Under Pressure: But How Much?
The tide has turned for the worse in the last three days and our friendly Financial Newspaper says “Market Under Pressure”…but the question is “How Much?” Hopefully this blog note will give you a perspective on the answer to that question:
So let’s start with “From Whence we Came” going back to the Eureka Signal on 12/01/2010 when we had an Eureka and several Big Kahunas to the upside which started the Santa Claus Rally. By the 18th of January all the Market Indexes were overbought as shown at the bottom right hand side of the next chart. The very next day we had a Phoenix with some big Kahunas to the downside and that is the first shot across the bow:
Usually WITHIN twelve days from this Overbought date, we should be into a Correction, and we will see if that golden rule still holds true…we don’t have long to wait.
There are two items that can delay the inevitable tumble for some form of a Correction, since I will show you that we have already achieved “Bifurcation” and the Rotation is already here…but more on that later. The two Items are:
1. The State of the Union Address is on Tuesday as my good friend Sherman reminded me at our Saturday User Group Meet Up, and it is most unlikely that the Big Boys will want to drive the market down unless there is some earth shattering news that triggers a big correction.
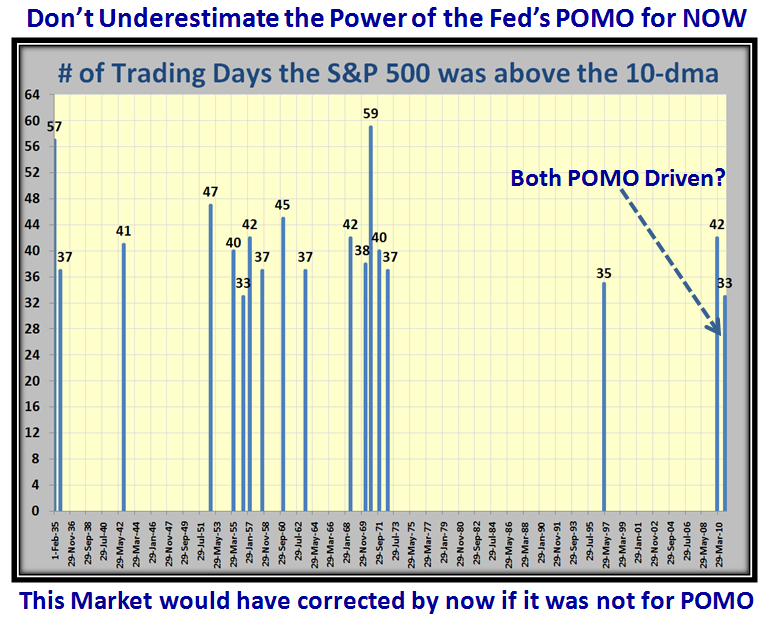
2. These are different times we are in; similar but different in that we have seen long rallies but different in that this market is being propped up by our good friend Helicopter Ben who is dropping big leaflets by way of the FED’s POMO otherwise why would we have not one, but two long rallies of the S&P 500 above the 10-dma as shown below:
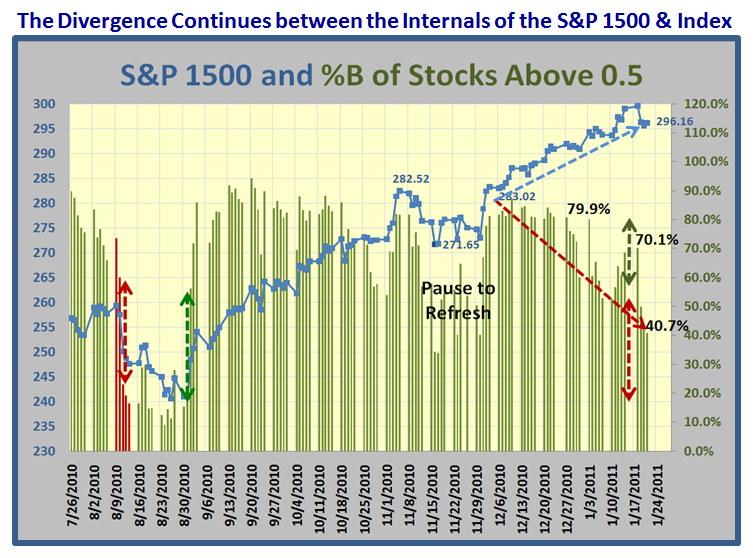
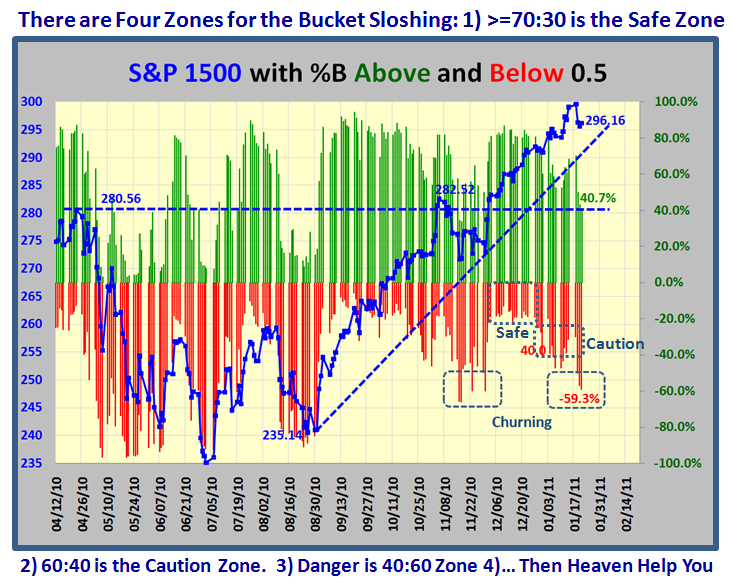
The next two charts are familiar to regular readers so they need no explanation, but will give you the latest picture of the Divergence that continues between the Internals of the Market and the Index Price:
So let’s turn our attention to the stages of deterioration from a Market Top to see how near we are to a Correction. Based on the recent results I have kept you appraised of we should go from Disparity to Bifurcation to Rotation and ultimately to Correction or a Major Snapback from a Pull Back.
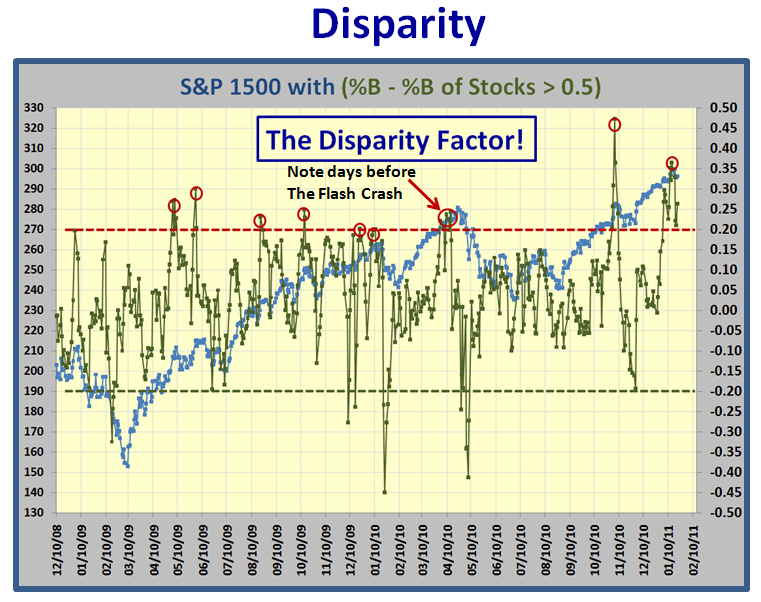
Disparity is a new term and I suggest it is the first clue that things are going heywire when one sees that the %B of the Index is still hanging tough and staying up, while the S&P 1500 Stocks above 0.5 begin to drop off as I showed in the last chart I posted in the previous blog, and repeat it here:
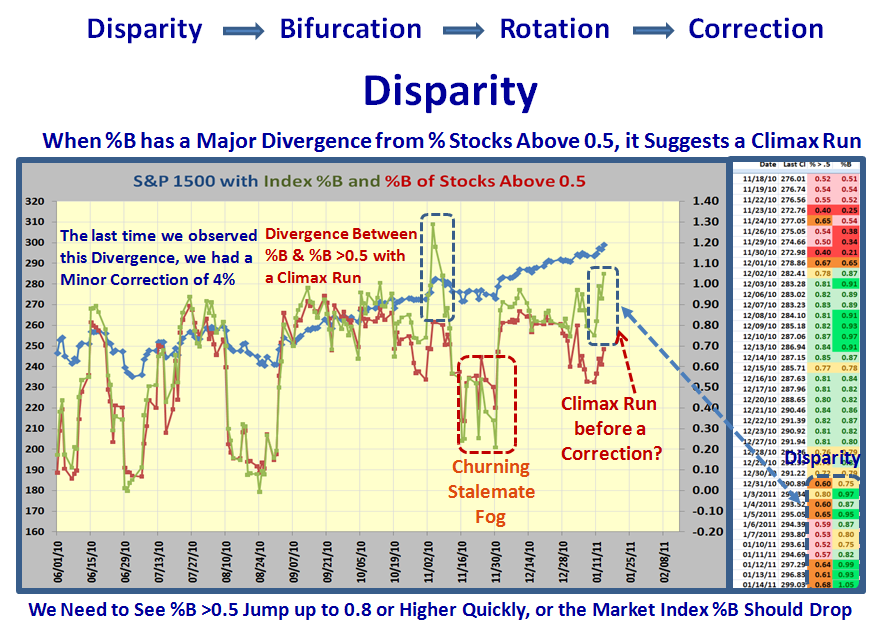
Let’s first look at the Disparity Factor for the past two years. I consider any difference of >0.20 is a signal. We can immediately see that this factor was about 0.24 and signaled just before the Flash Crash which then resulted in a 17% correction:
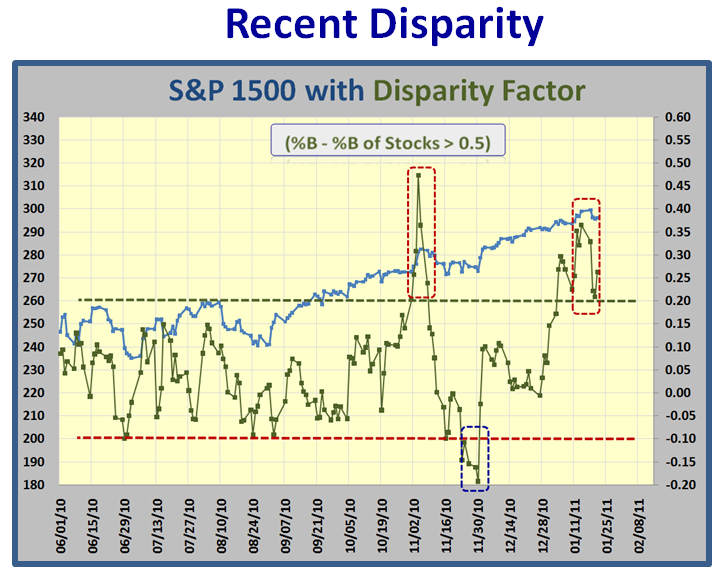
So let’s zoom in on Recent Disparity in the last three months where we see the difference, or Disparity as I call it, between %B and the % of stocks above 0.5 was as huge as 0.48 and we had a mild correction of 4%. This time it reached a peak of 0.37 and the correction has just started:
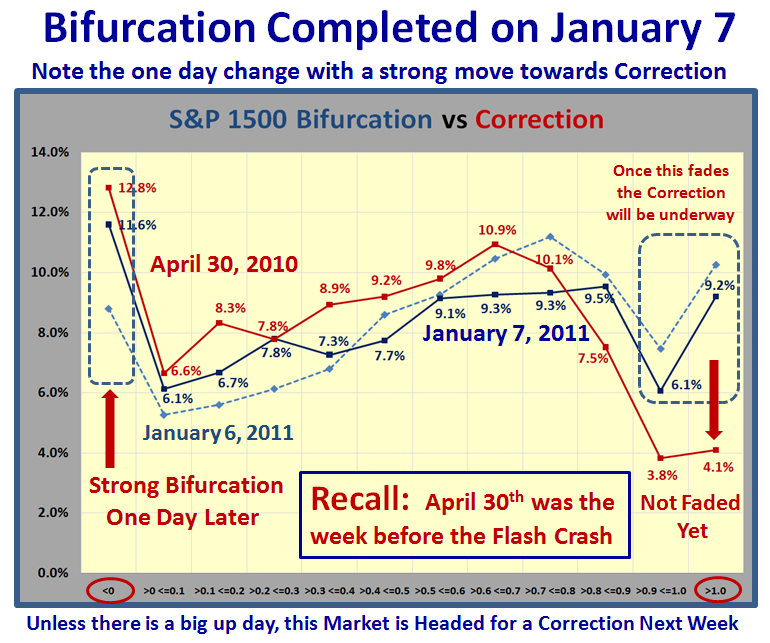
So having spied Disparity, another clue in our arsenal is “Bifurcation” which my good friend Mike Scott dubbed and I have also featured this in earlier blog notes. Narturally, as we get good at this stuff, the more significant buckets to watch are at the two extremes, <0 and >1, and here we see a whole bunch of stocks being trashed back on January 7th. In fact the % of stocks in this bucket is the tallest at 12%:
As it turned out Bifurcation first occurred on Janaury 7th. Note that when compared to what occurred on April 30th a week before the Flash Crash, not only did we have Bifurcation but also the % of stocks in the top bucket >1.0 was also at a low of a mere 4.1% which suggested that the Correction was already underway, whereas now we still had a healthy 9.2%:
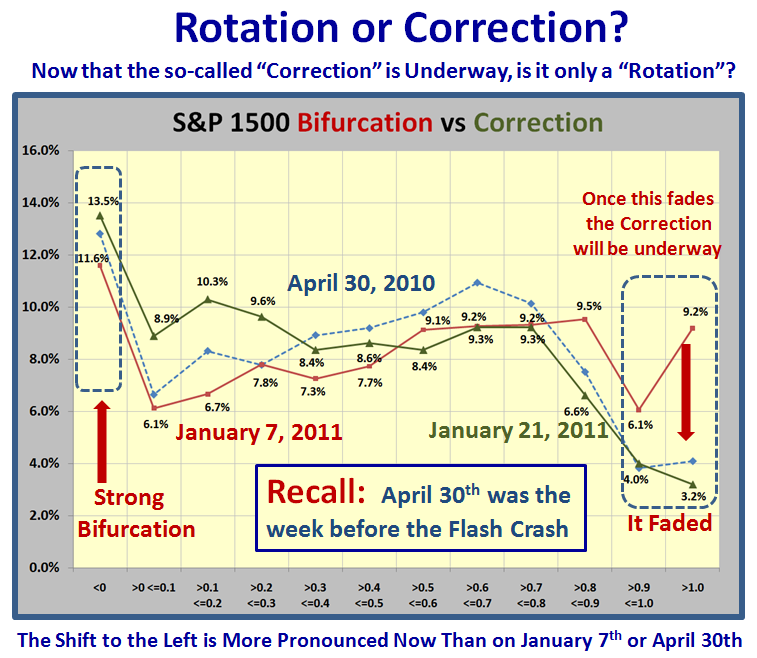
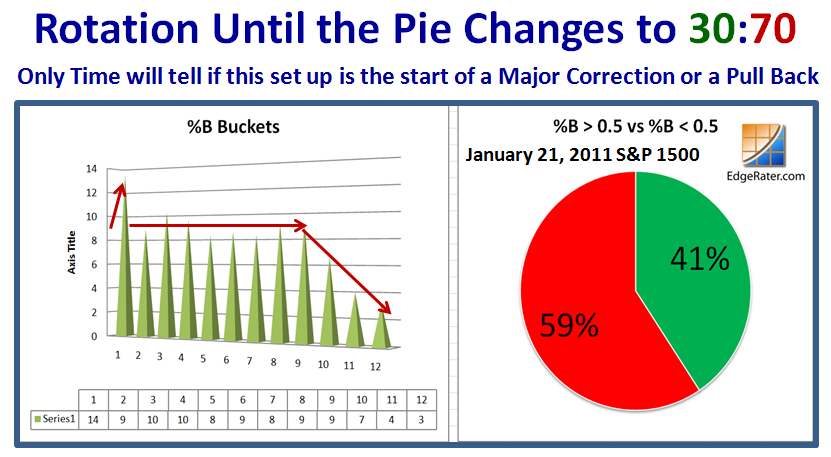
Now let’s look at the picture as of Friday, January 31, we certainly have Rotation underway as the percentage in Bucket >1.0 has faded to 3.2%, but we have to wait to see if it is a full blooded Correction:
The next question is when do we know we have a full-blooded Correction? When the Pie Chart changes to 30:70:
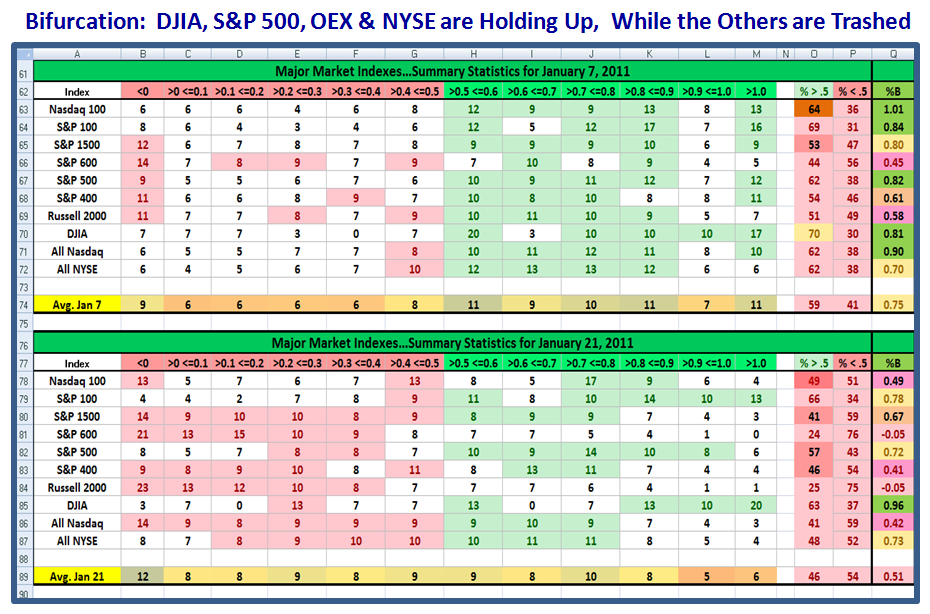
Don’t hold your breath as this next chart shows you the Bifurcation which has occurred in the the Ten Market Indexes I track. It is no news to you that the likes of the Nasdaq, the NDX, the Mid Caps and especially the Small Caps have all been taken to the woodshed and trashed. However, surpringly the DOW is the strongest Index with the S&P 500, OEX, and NYSE still holding up. Just look at the “Rose shading” on the left hand side of the bottom chart…Distribution is heavy:
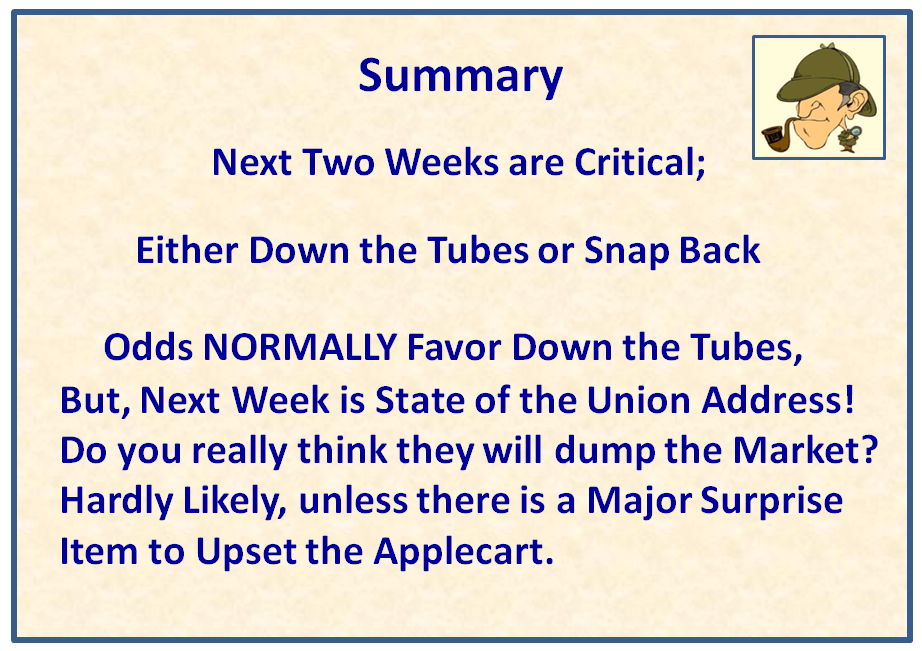
In Summary: I would have said that next week is critical, but with the State of the Union Address on Tuesday, do you really think they will dump the Market unless something major upsets the Applecart?
This coming Thursday, Ron and I are holding an on-line Webinar on three Impulse Indicators – the Eureka, the Phoenix and the Kahuna. We are already full and I urge those who are attending to digest this and previous blog notes as they substantially augment what we will cover in an hour and a quarter.
Best Regards, Ian.
 Ian Woodward's Investing Blog