Stock Market: Quick Glance Barometer
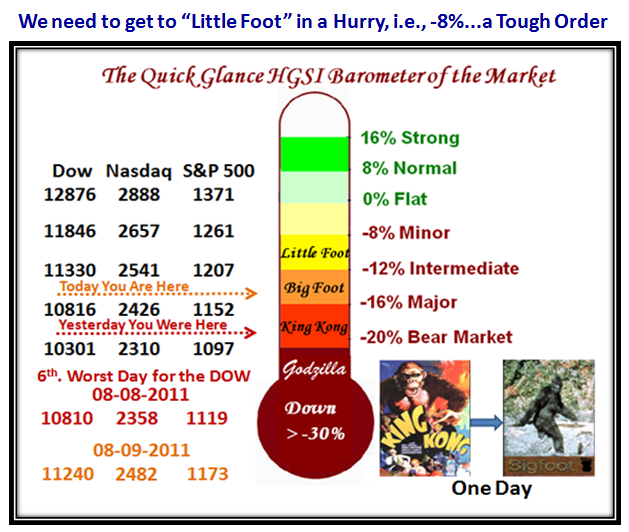
With the Major Market Indexes all sitting at around -18% down or worse, I felt it might be worthwhile to give you the Quick Glance HGSI barometer of the Market. Yesterday King Kong ruled, but fortunately with today’s sparkling Bounce Play essentially in the last hour we are back to Big Foot! Enjoy:
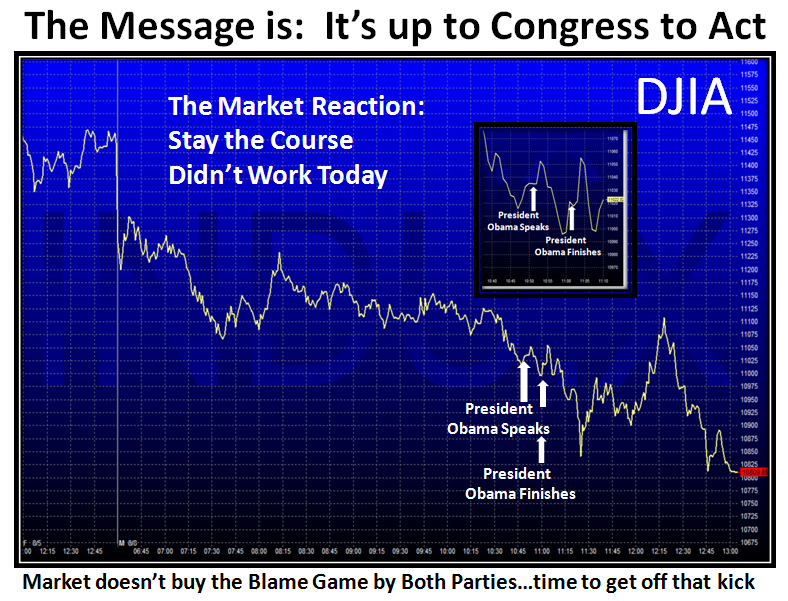
But let’s backtrack to yesterday when the DOW suffered the 6th worst day, where the mood after the Investors had a chance to digest the downgrade of the Credit Rating to AAa over the weekend and left a sour taste and a gloom and doom mood, with investors unloading their securities en masse. Even President Obama’s assurances to stay the course could not turn the mood around as shown by the next two charts:
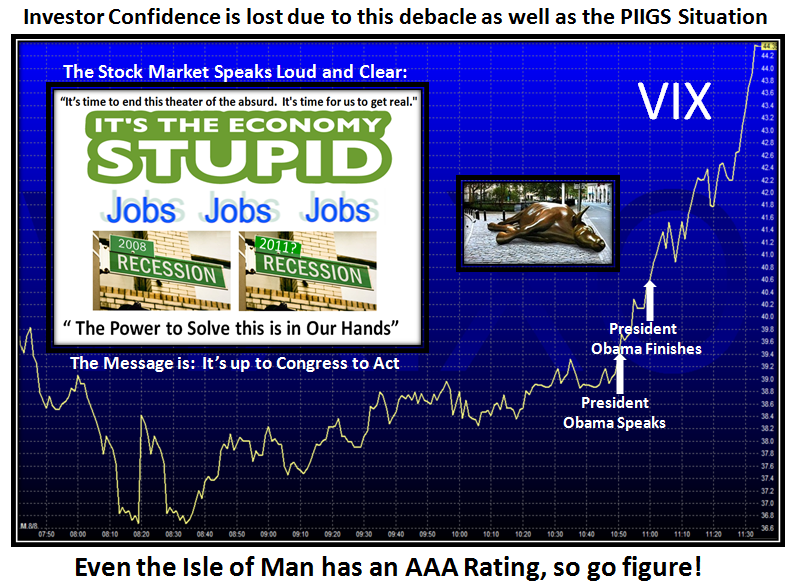
The VIX showed that Volatility was back as it hit over 40 again in a hurry and then some:
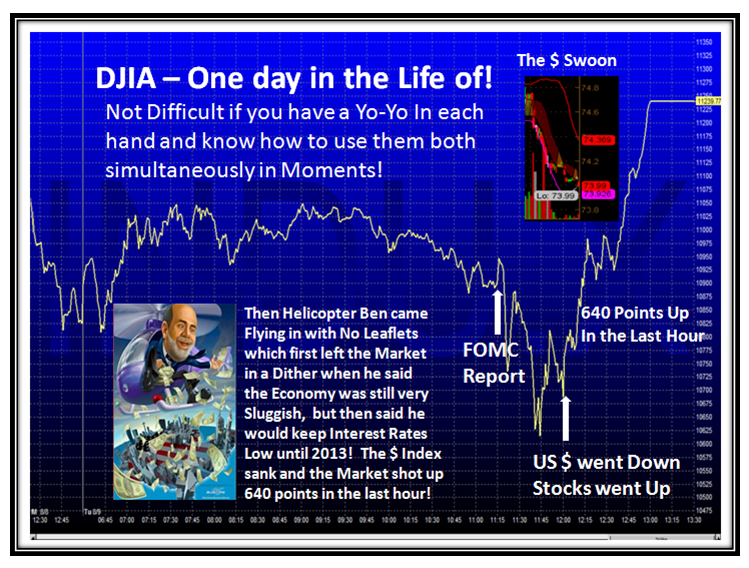
…And then Helicopter Ben appeared today with the FOMC Report with bad news regarding the Recovery of the Economy being slow and therefore more pain for the populace with regard to Jobs. At first, this sobering news took the market down, but then the re-assuring message was that the intention is to keep Interest Rates low for the next two years. No leaflets were dropped ala the prospects of a Q-E 3. However, on second thoughts by the market, the reaction was to take the Dollar Index down and consequently, Stocks took off and our man at the FED became the hero instead of the goat! Go figure.
In any event this helped “usuns” to breathe a sigh of relief at least in seeing the much expected and touted Bounce Play materialize like a Yo-Yo to drive the Market up for a respectable gain of around 5% all around for most Indexes for the day.
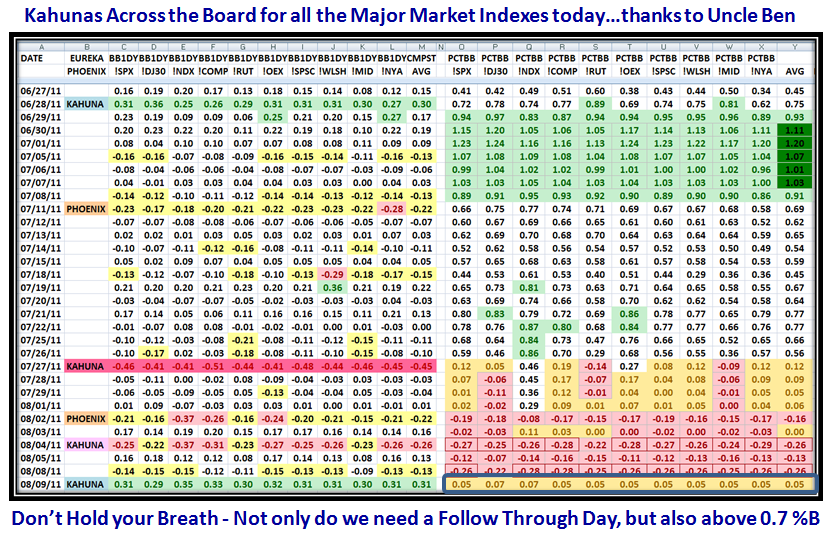
So with the strong Bounce Play, all Market Indexes enjoyed Little Kahunas up today as shown by the next chart. But cast your beady eyes over to the bottom right hand side of the chart to realize we are still only at the 0.05 level on %B, i.e., just inside the Lower Bollinger Band…so don’t get too excited yet. Of course we can expect the usual discussions from our friendly Financial Newspaper that this was a turn-around day and we should next look for the Follow Through Day (FTD) to suggest we have a Market in Recovery. Let me remind you to go back and study the last two charts of the previous blog note to realize that Rome wasn’t built in a day, and you should be alert for the booby traps which invariably occur at the expected resistance points, be it with Fibonacci, Cycles, or just plain support and resistance levels.
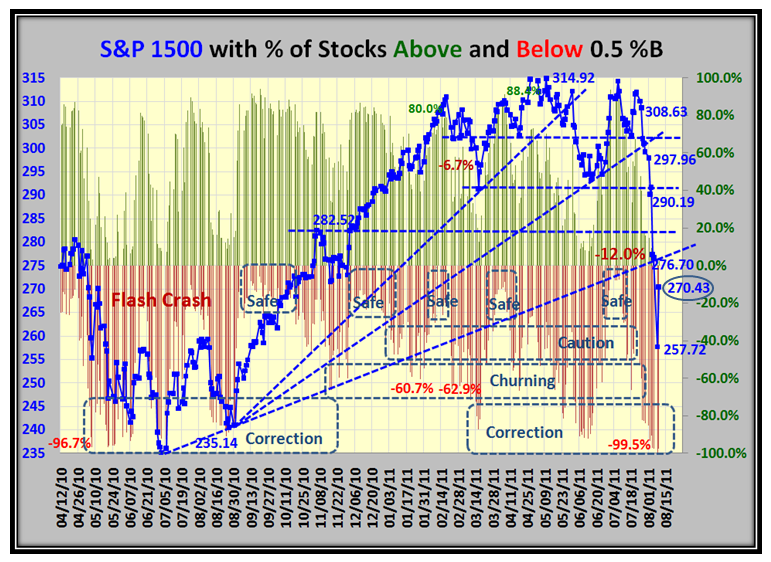
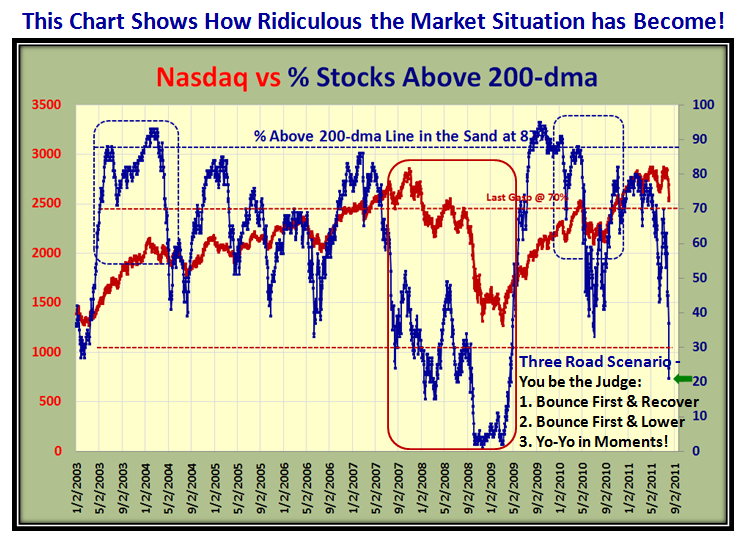
So having looked at %B for the Indexes, now let’s see what the % of stocks above and below 0.5%B looks like at this stage of the game…disaster:
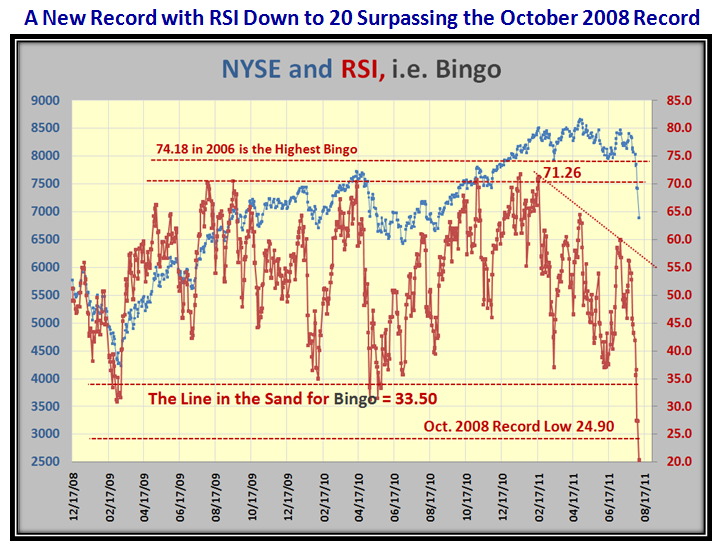
Now then, let’s see the extent of the damage with the likes of RSI, which gives us a measure for “Bingo” using the NYSE. The picture speaks for itself and as you would expect, we reached the lowest level yet recorded during this period since Black Swan days in October 2008, beating it down by a college mile:
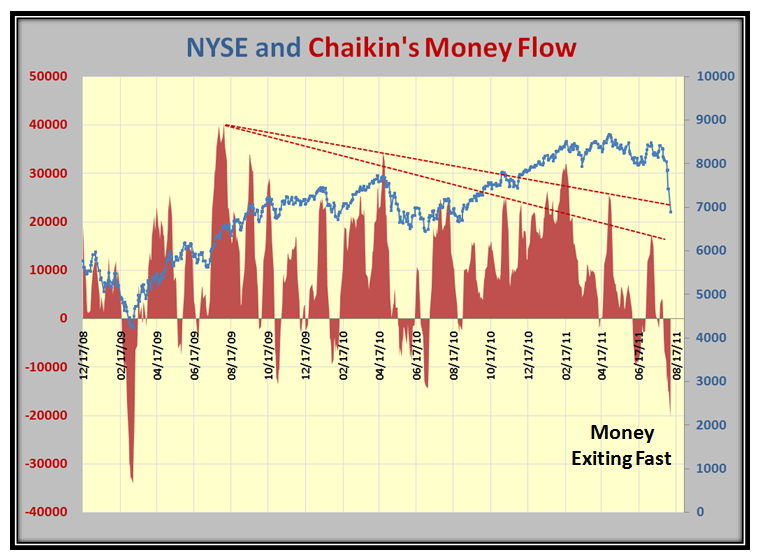
…And as you would expect, Money is flowing out of the Market fast:
More of the same:
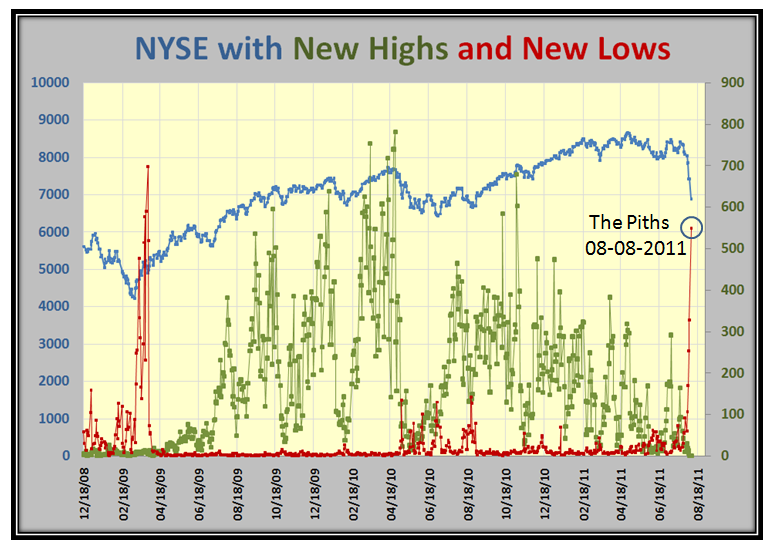
…And as you would expect, the New Lows are now reaching to the stars:
So there you have it. Type 1&2 Traders sharpen up your Yo-Yo skills and Types 3&4 relax in the sun.
Best regards, Ian.
 Ian Woodward's Investing Blog