Stock Market: You Snooze You Lose
Last night I gave you my latest results of the research I have done using %B x Bandwidth, and it seems that the picture I left you with was too small to understand since it is not enough to trust, but one must verify. The hour was late and all I got was one response to what I believe is breaking new ground. However, I see my friends from Qatar are taking note! Be that as it may, I repeat…You snooze, you lose.
My good friend Chris White has provided me with the tools to show you why I have confidence using his EdgeRater Product, where he does the whole kit and kaboodle for you in a Template. It doesn’t get any easier and you judge for yourself as I unfold this good stuff step by step as to whether between my work and his tools we may make and save you money by keeping you on the right side of the market…more so than most:
Now to address the one response I got today, which I appreciate:
Ian,
Thank you for your timely blogs to help us stay sane in this crazy market. I increased the size of your last chart in the blog as much as I could (twice) but still cant read the numbers ( 21″ monitor) and what it is saying. Is there any way to blow that up and resend it? Thanks, Bob
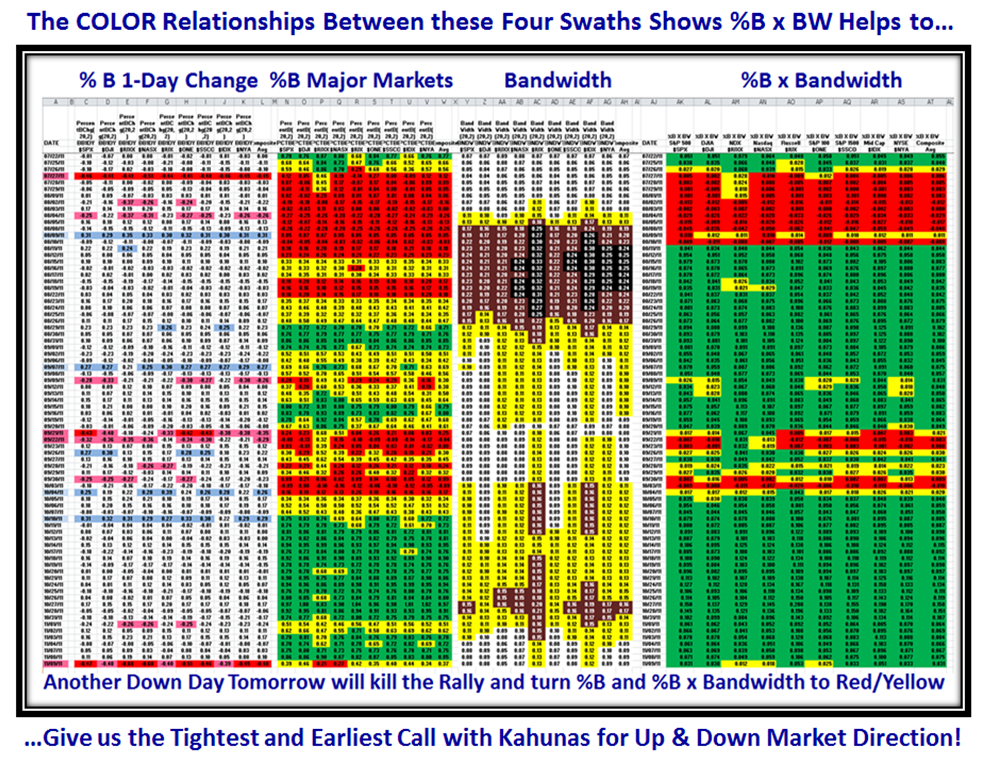
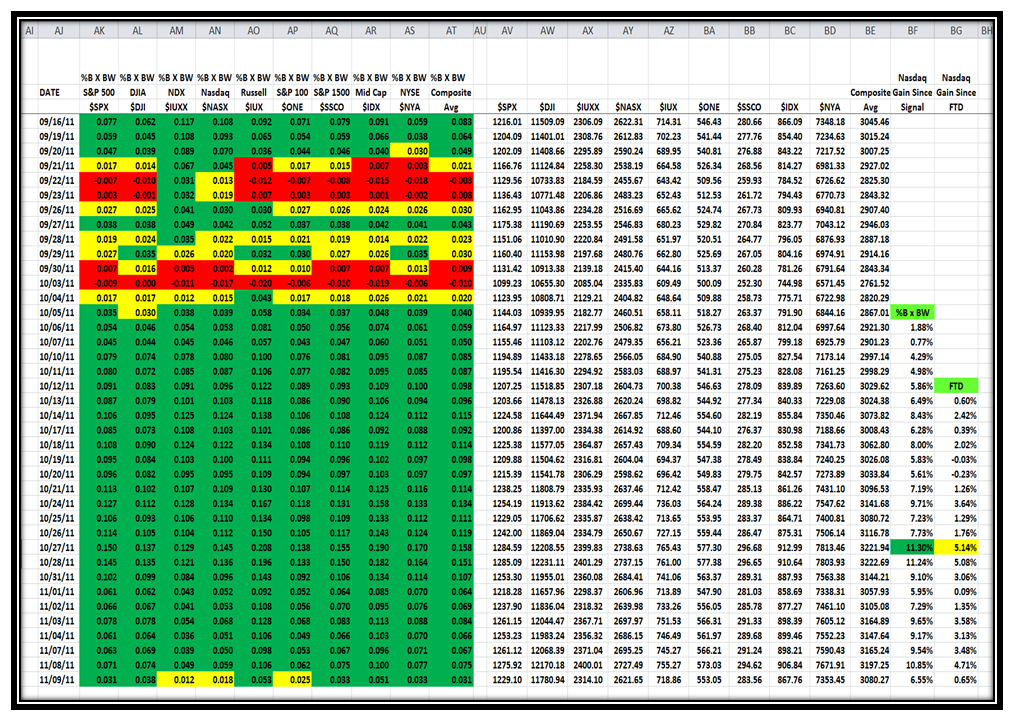
Bob, your wish is my command. Here is a step by step view of the four swaths, starting with the original with all four scrunched together to give you a general view as I did late last night, and then the “Real Proof in the Pudding” or the “So What?” is the fifth swath of %Gain from the day of the Signal. This first chart showing all four swaths was intended to give you a general view of the inter-relationships, and maintains continuity for you from last night’s blog note:
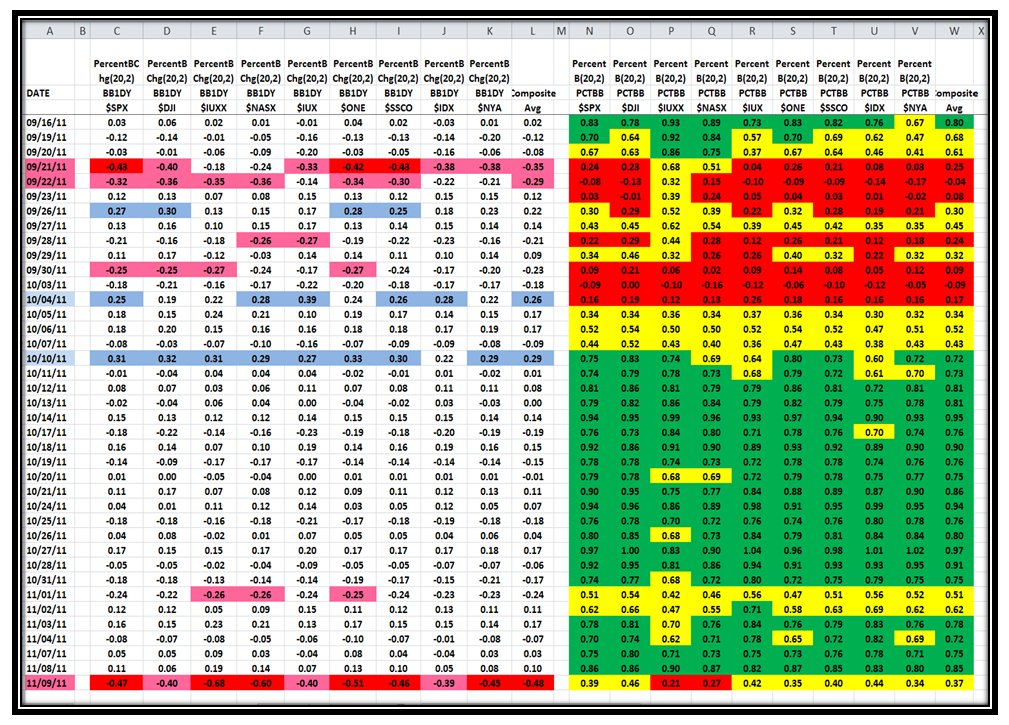
Now here are the first two Swaths, %B 1-Day Change and %B, and hopefully you can read the numbers this time, when you click on the chart itself which will give you a bigger picture. Note that when we see a string of Kahunas down or up, as we see on 09/21/2011 and 10/10/2011, respectively, %B essentially changes color in unison
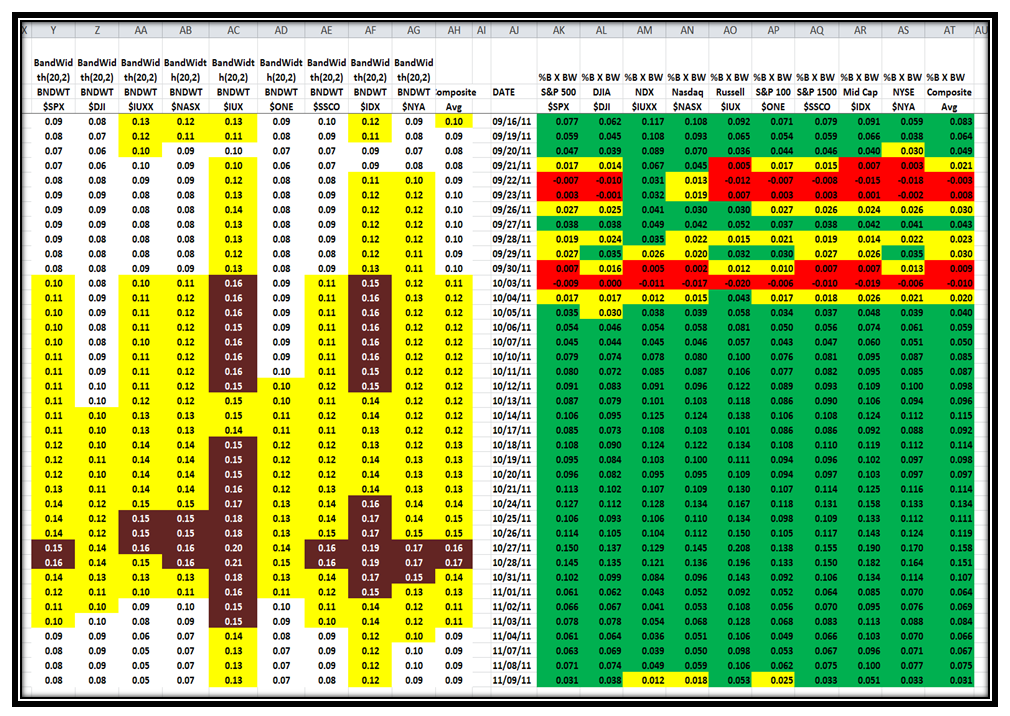
Next we have Swaths 3 and 4, Bandwidth and %B x BW:
If we look at the last line, we see that Bandwidth had mainly the same readings and identical Conditional Color Formatting, while %B x Bandwidth showed that three numbers changed from Green to Yellow, signaling a caution but no major change, implying that although we had a 4&1/2 bucket drop in most Indexes in %B, the Rally was not yet dead! I have not updated the chart for today’s readings, but as you would expect given that it was a ho-hum positive day the colors for %B x BW improved to just two “yellows” for the NDX and Nasdaq, while the S&P 100 came back to “green”. I am not for one minute suggesting that the Market is not on shaky ground, which it is, but it is still not dead!
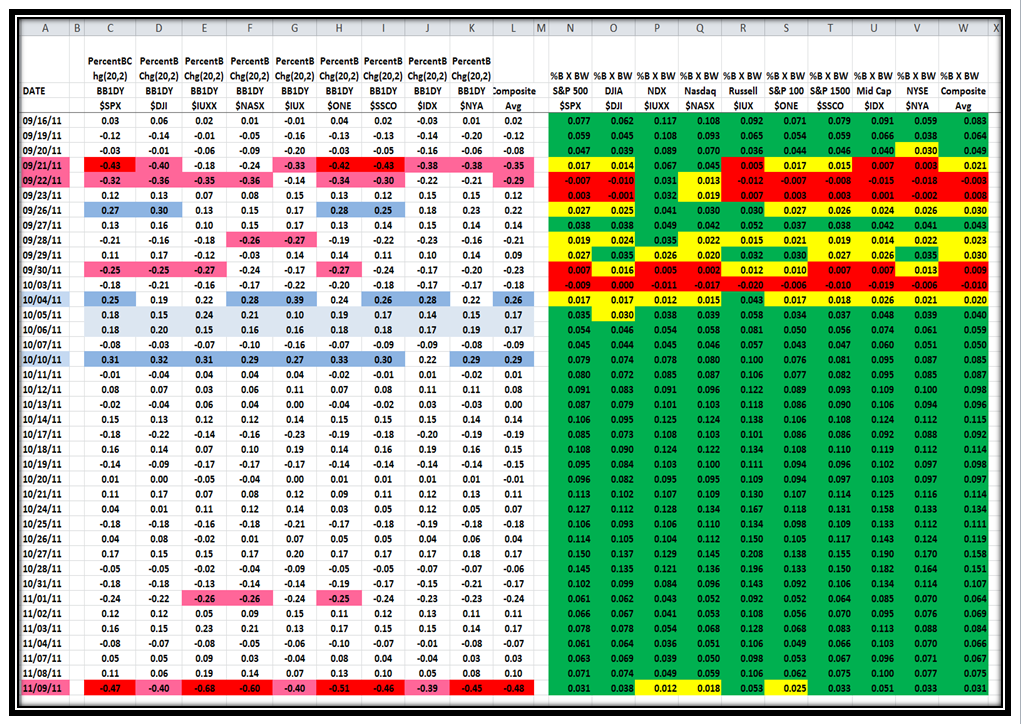
Next, just to prolong the agony, since this is the first time I am walking you through the logic, I show Swath 1 and 4, %B 1-Day Change and %B x BW. However, you will note that this time I have colored the swaths for 10/05/2011 and 10/06/2011 with a light blue just to draw your attention that although there were no Kahunas on those days, the momentum was still impressive with what I would call 2/3rd. of a Kahuna on both days…remember that a Kahuna is 0.24. In other words we see three days in a row with strong Momentum from 10/04 to 10/06, which resulted in %B x BW changing color to “Green”, implying that the signal that recovery with a New Rally was confirmed on 10/05/2011. Obviously by 10/10/2011 when we had another strong swath of Kahunas, the %B x BW was sitting with four days of solid green. Please understand that the Follow Through Day was not signalled until 10/12/2011 which was two days later.
You might well be asking when does this process signal that the market has turned back to a Bear Market or that the Rally is dead…I would want to see at least six of the Market Indexes turn to Yellow/Red for %B x BW. Likewise, I am equally sure that you are saying “So What?” The answer is on the next swath which shows the %B x BW together with the actual Index close prices, which comes back to my opening picture of “You Snooze, You Lose!”
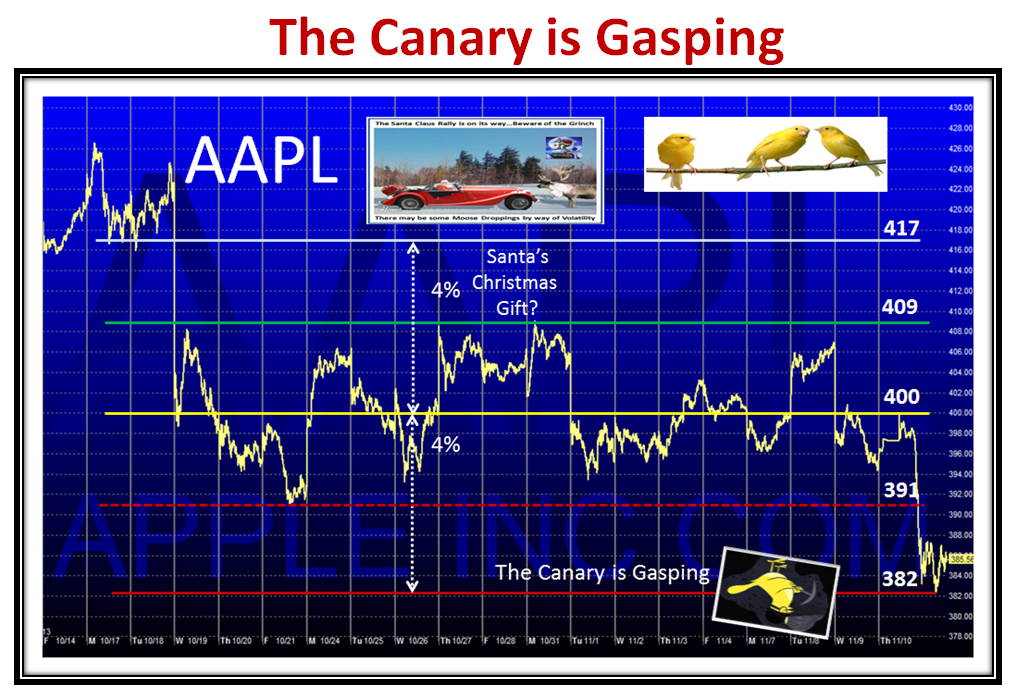
The So What is that with the process I have shown you you stood to double your gains at the peak, between friends, over the FTD system. Yes, of course, the Market is under pressure…it ought to be after a ~5 Bucket drop and it will take good news out of Europe and momentum buying from the Large Players or we head down into the doldrums. I have always taught you to watch the Canaries in the Coal Mine and my charts of four Market Indexes in the previous Blog gave you the picture that we are flirting with the lower support levels too close for comfort. But, for tonight to round this blog note off, let’s just look at the “Go To Canary”, AAPL, and you will see that it is Gasping and nearly out for the count!
So there you have it. We will see how useful this is going forward. We are at a critical point, but not yet out for the count!
Best Regards, Ian.
 Ian Woodward's Investing Blog

