Ian Woodward's Investing Blog

Archive for March, 2012

Stock Market: A Major Shot Across the Bow!

Tuesday, March 6th, 2012

Those who follow my musings in these Blog Notes have realized that I have recently written more than my usual number of notes, and this is the third one in as many days!  It’s my attempt to keep you on the right side of the Market.  As you also know, I have various Tools and Rules that give me the agility to anticipate Fear and Greed and I have plucked several recent examples that show you how I do it.

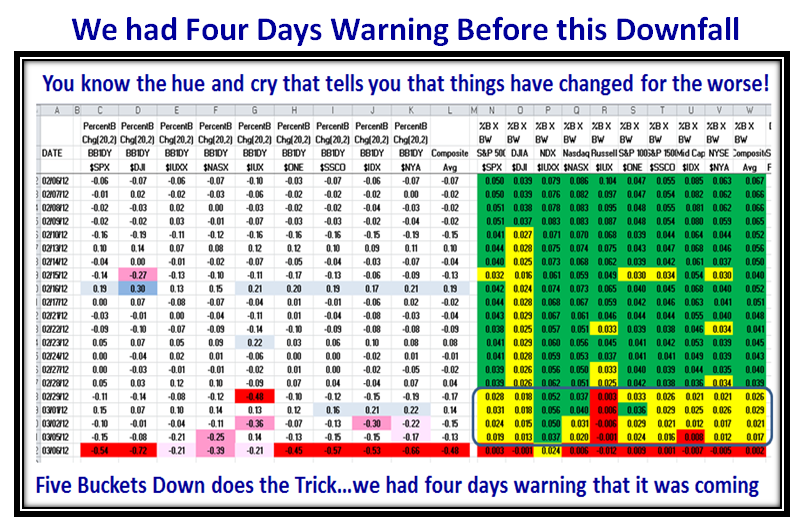
Let’s cut to the chase with this first view that I have given you time and time again:

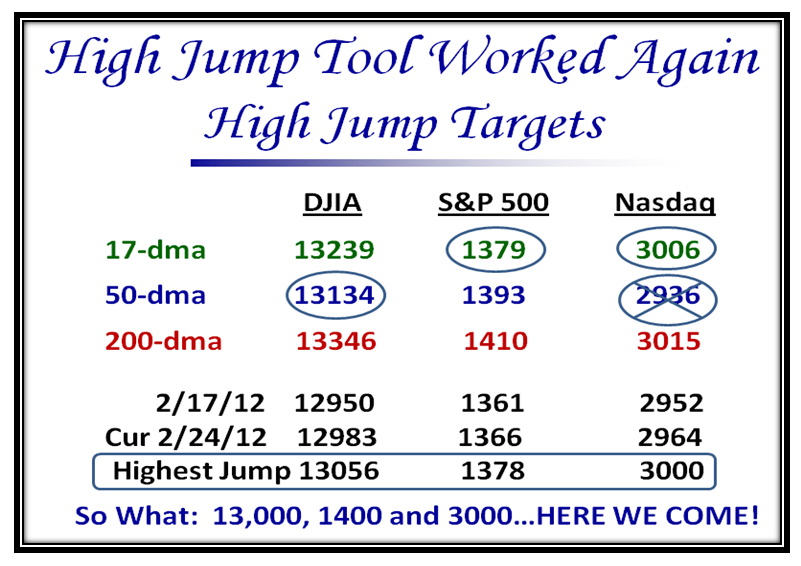
Three weeks ago I gave you the High Jump Targets as the Market was getting very overbought and it demonstrates how this is a very useful tool which we have in the HighGrowthStock Investor Software:

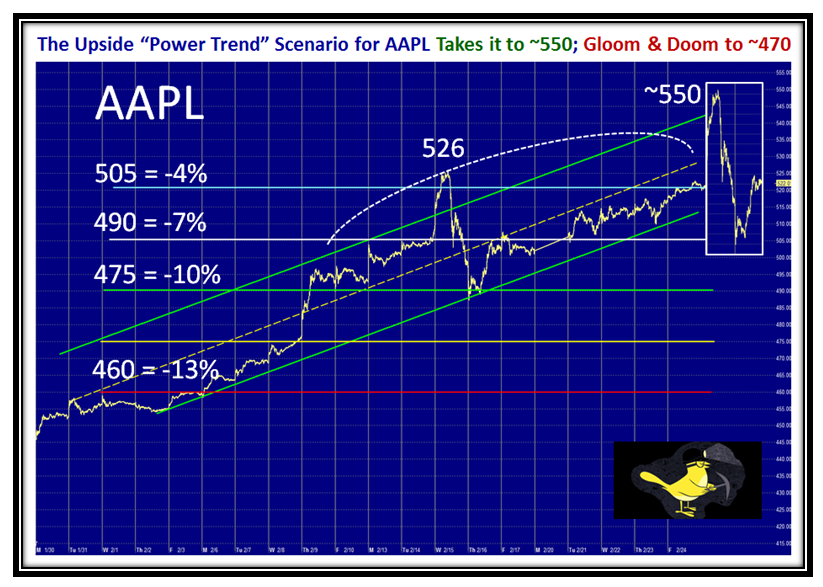
I have always emphasized the Canary in the Coal Mine Scenario which for months is “AAPL”.  Five days ago I gave you what the probable outcomes might be for Up and Down scenarios:

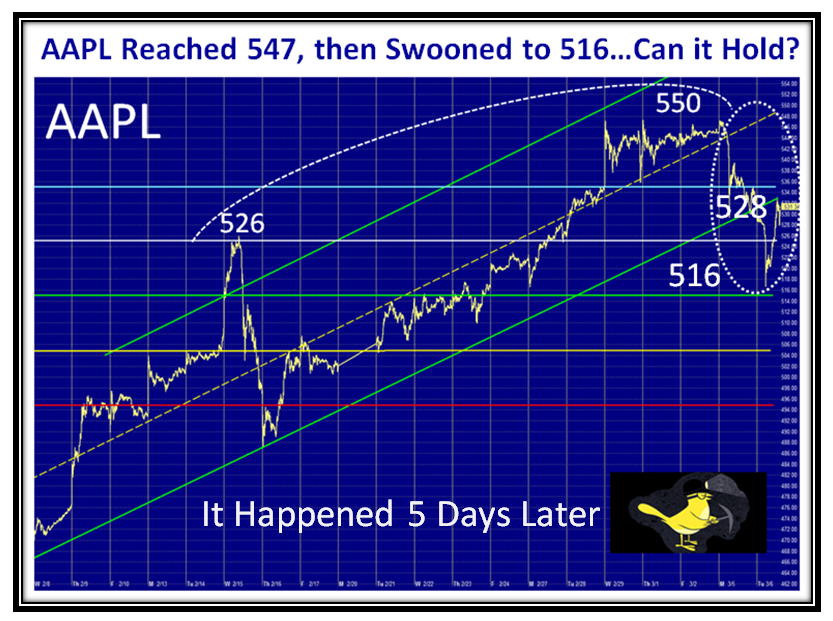
…And here is what happened today:

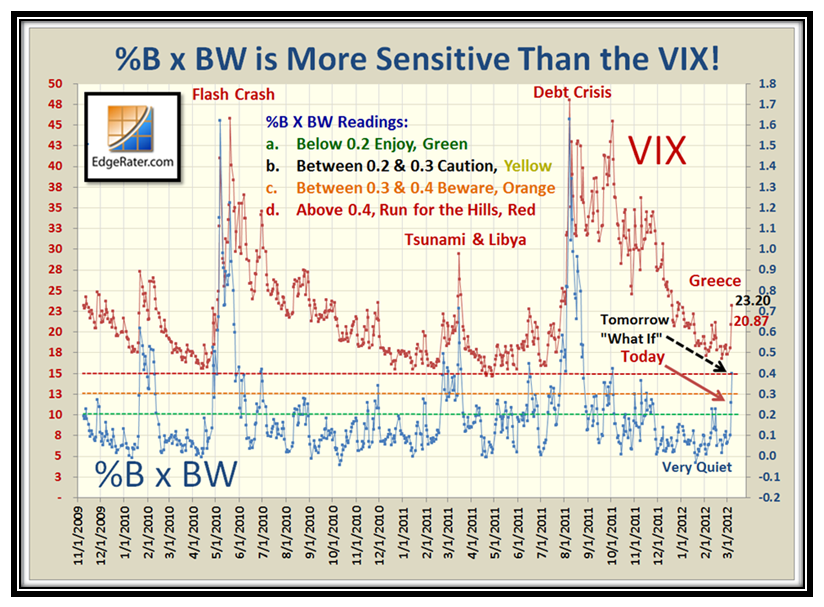
In recent weeks my focus has been on the VIX and TVIX and with the problems in Greece it came to a head today.  I show you what transpired today when the VIX woke up and the Woody Indicator (%B x BW) jumped.  I go on to show you what to look for tomorrow if there is a further big move to the downside to drive %B x BW to 0.40 as shown.  It pays to ask “What If” so that one can anticipate should the Market head down on this particular occasion.  The number is 23.20…let’s see what happens, but at least we are prepared:

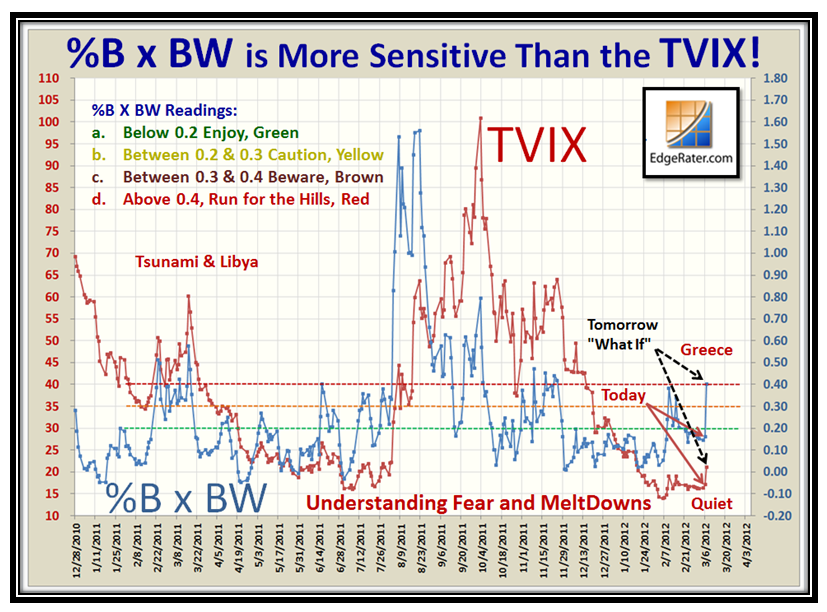
The TVIX on the other hand is still “Quiet”, so the Bears are not fully committed as yet, and it will take a lot more to get it moving with gusto:

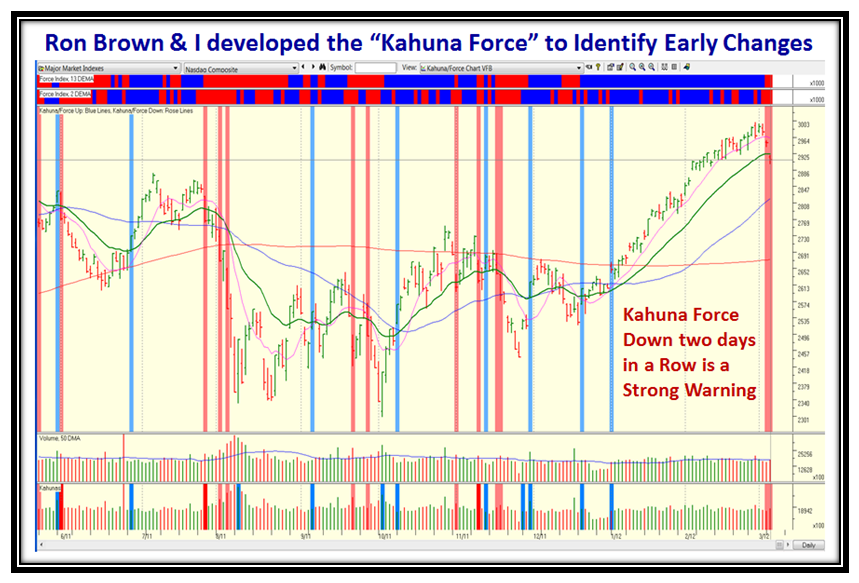
Last but not least, here is an Indicator that Ron Brown and I developed to identify Market Turns both up and down, and there is no mistaking this down move as it has signaled two days in a row!  We call it Kahuna Force and again is only available in the HGSI Software:

Well there you have it.  I hope this helps you to fully understand the Tools and Rules I use to be agile enough to stay ahead of the Market but not to second guess it or fall in love with a particular scenario which is fatal.

Best Regards,

Ian

Stock Market: Gain on Swings and Lose on Roundabouts

Monday, March 5th, 2012

Friday we were on Pins and Needles.  Today we had a shot across the bow, and the net result was Stalemate.  What we Gained on the Swings we Lost on the Roundabouts:

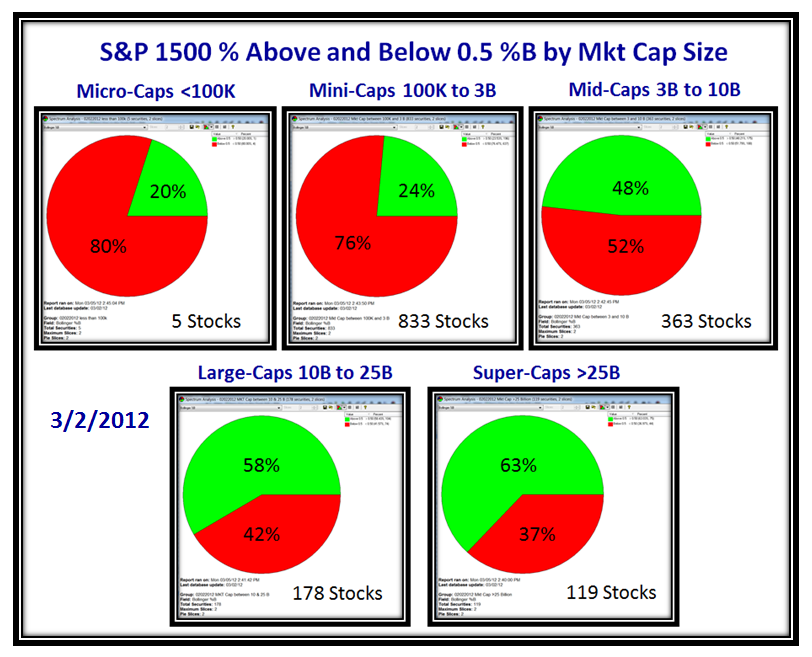
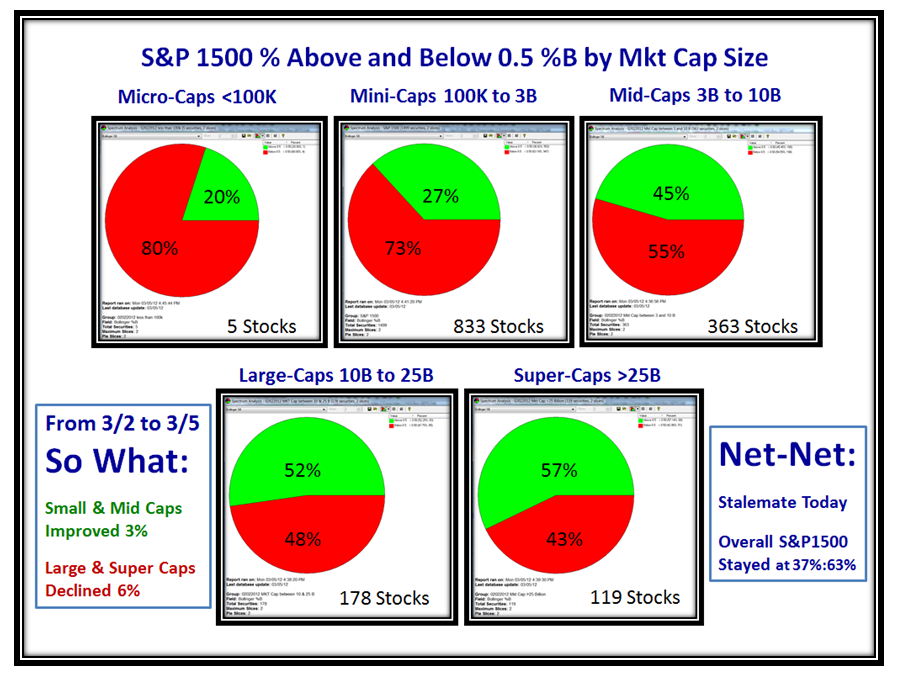
Looking for a Needle in a Haystack, here are the bottom line pictures.  Below we have Grandma’s Pies on the the S&P 1500 for the various Market Cap Sizes at the Close last Friday on 03/02/2012:

…And here is what it looked like at the end of Today.  Large Caps lost Ground, Small and Mid Caps came back…net-net No Change in the overall %B breakdown for the % of Stocks Above and below 0.5:

However, Grandma’s Pies have turned more than a trifle soggy with 37% Above and 63% Below 0.5, so the odds favor a correction, though the Bulls are grudgingly giving up ground.  AAPL got hit today but again it recovered towards the close.  The VIX and TVIX remained very QUIET, which says that the Bears once again must be patient.

Best Regards, Ian.

Stock Market: Is on Pins and Needles

Saturday, March 3rd, 2012

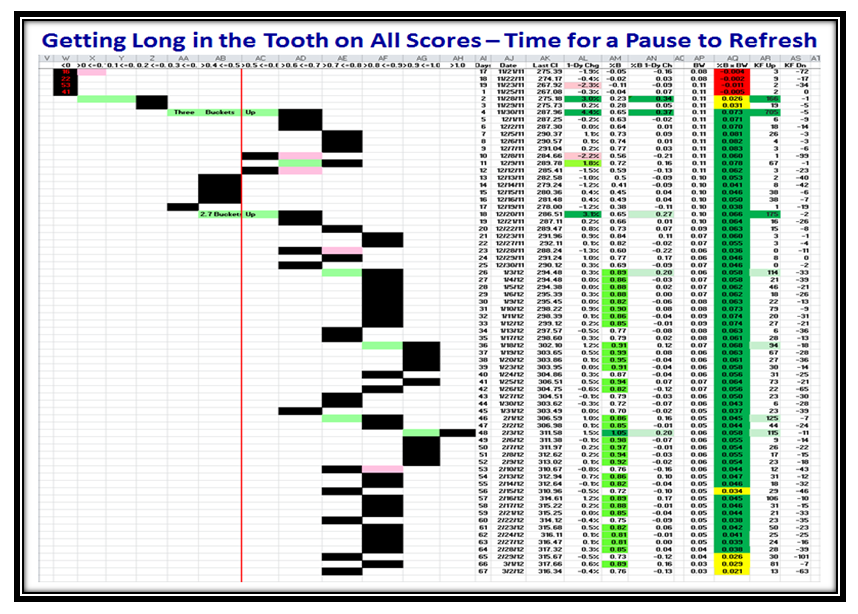
I need hardly tell you that this Rally is long in the tooth, but it is now really apparent that it is now on Pins and Needles!  The evidence that some form of correction has been building is what I will show you, but when momentum is this strong despite the sluggish volume of late, it takes a while for it to cave in.  I have collected a potpourri of evidence of old and new faithful slides for you to judge for yourself:

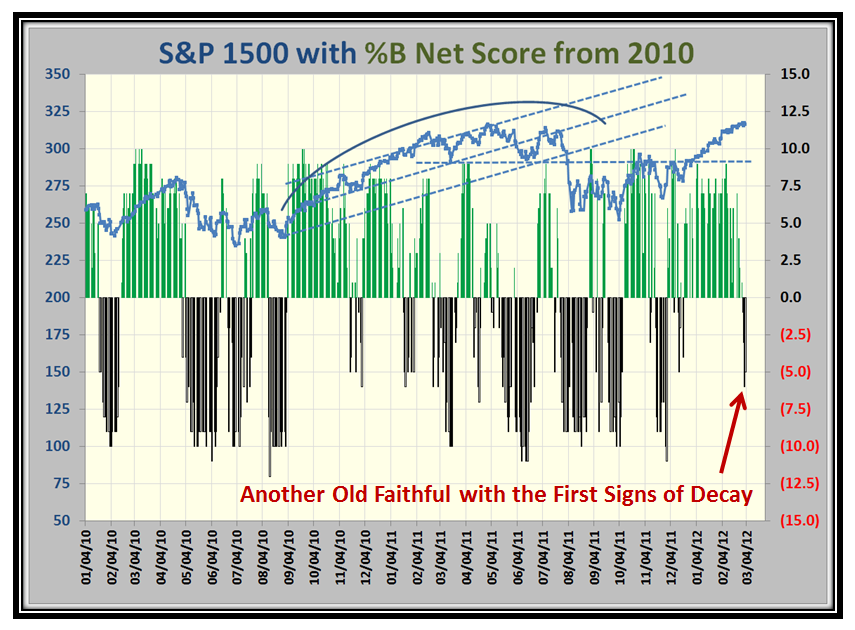
I offer you my Three Road Scenarios with one caution…every one is waiting for a dip so that they can get in since many have missed this last run, so don’t be surprised if the correction is small.  But as usual, we can’t predict the future on a whim.  Here is an old faithful that shows this rally has stayed up and is now long in the tooth:

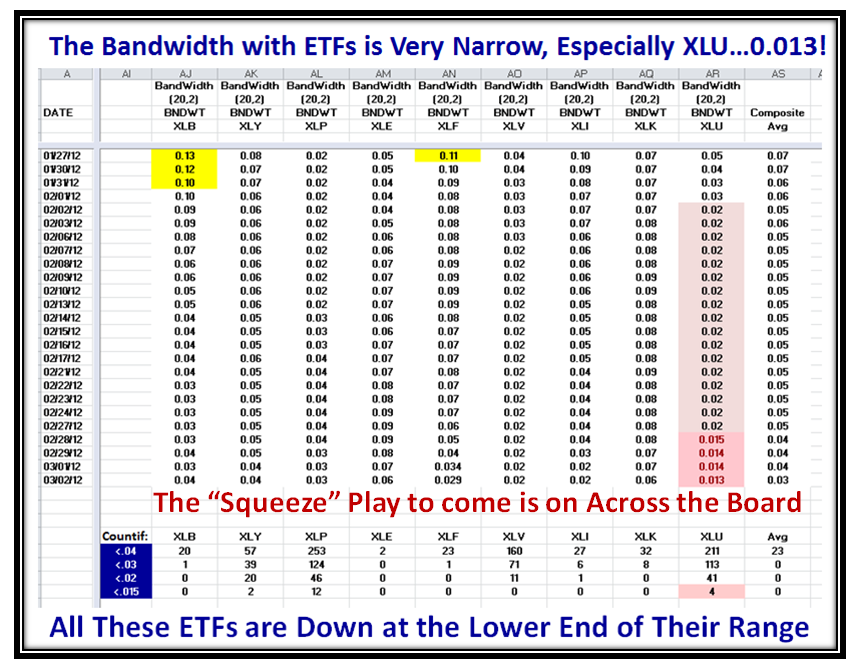
Now here is a new twist.  My recent good friend Fred from down the road who is coming to the seminar,  has been studying feverishly the Woody Indicator (%B x BW), and brought my attention to the Utilities ETF (XLU), which led me to investigate the XL_ series in general and the XLU in particular.  As the next diagram shows all these ETFs are at a Bollinger Band Squeeze Play, where they are tighter than a drum.  So much so that there is no where for them to go but up in Bandwidth!  You judge for yourself and cast your Beady Eyes on the shaded portion for the XLU which is now down to an unheard of reading of 0.013!  Furthermore if you look at the “Countif” table I have produced for you, you will see this has NEVER happened before in the two years of history I looked at:

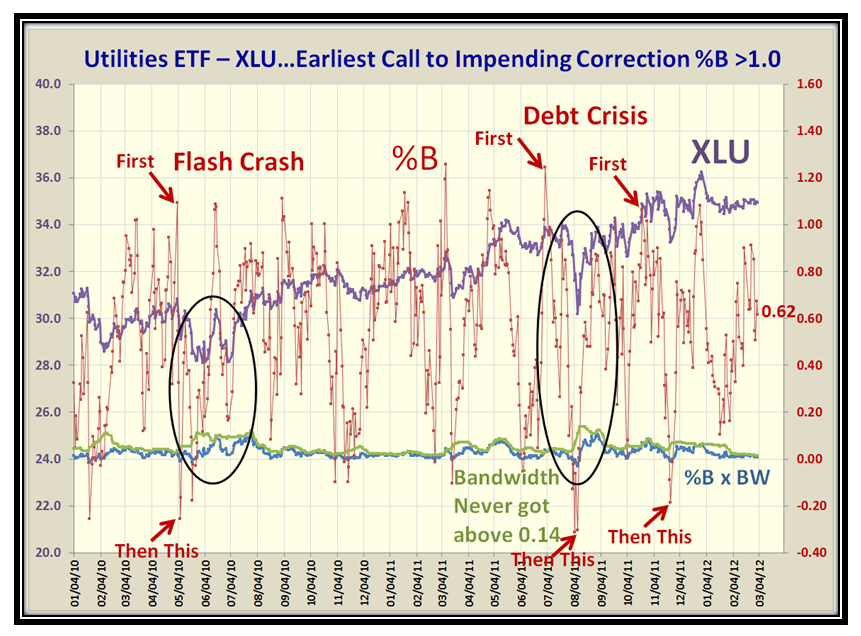
Let’s take this a step further and concentrate on the last two year’s worth of %B, BW, %B x BW and the Price of the XLU, and it was certainly a surprise to me that the Bandwidth and therefore the %B x BW were so low that one could get very little information out of them, UNLIKE the VIX and TVIX which I have shown you in the last few blog notes.  On reflection, it should be obvious that Utilities are slow boats and usually have little volatility.  However, the %B had plenty to tell us…unless I am reading too much into the tea leaves.

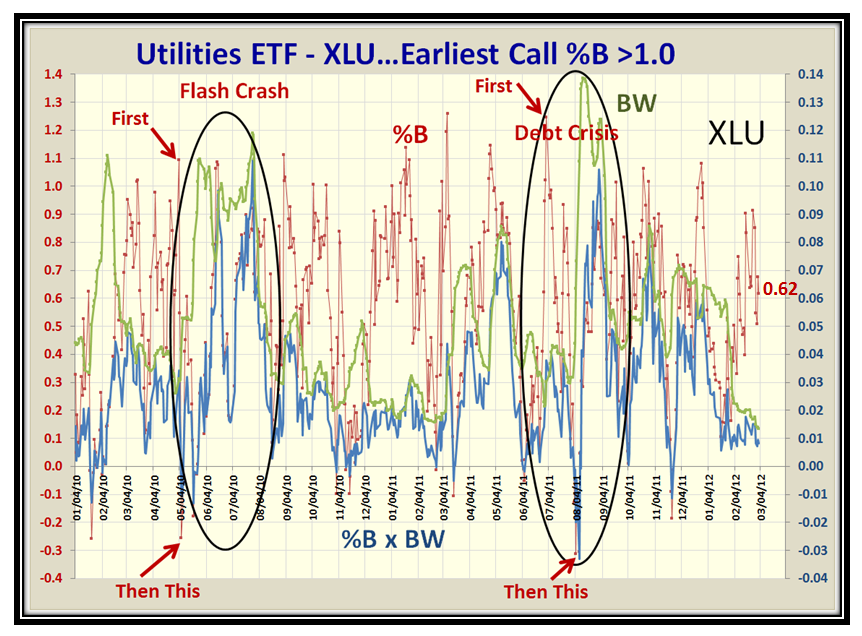
If we study the chart below we see that invariably BEFORE a big fall, %B for XLU FIRST rises above the Upper Bollinger Band, i.e., >1.0 and then collapses rapidly through the Bandwidth to below the Lower BB.  Those who have been with me all these years will recall my BullsEye Indicator and that is precisely the “Go To” indicator in this case at this point in time.  Note that in the two most recent big drops in the market, i.e., the Flash Crash and Debt Crisis, we get “First, and Then This” as I have depicted on the chart.  It will be interesting to see what happens this time as we are currently sitting in Limbo at 0.62:

This next view is a bird’s nest as I took out the XLU itself and therefore expanded the BW and %B x BW.  However, you can see that %B leads both, and the concept is therefore to watch %B on the XLU for any quirky moves!

Now for some other old favorites which I haven’t shown in a while and you will at once see that the tom-toms are beating:

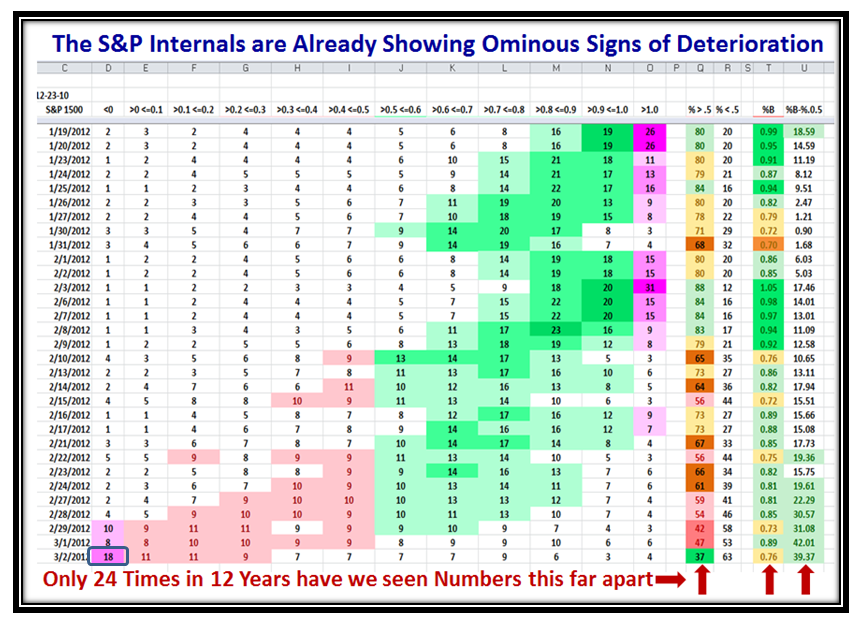
…And that is confirmed by this view which not only shows that we now have 18% in the hole <0, but also the tell tale sign that %B-%0.5 in the last column is ominously high…42% and then 39%.  This and the next slide says it all:

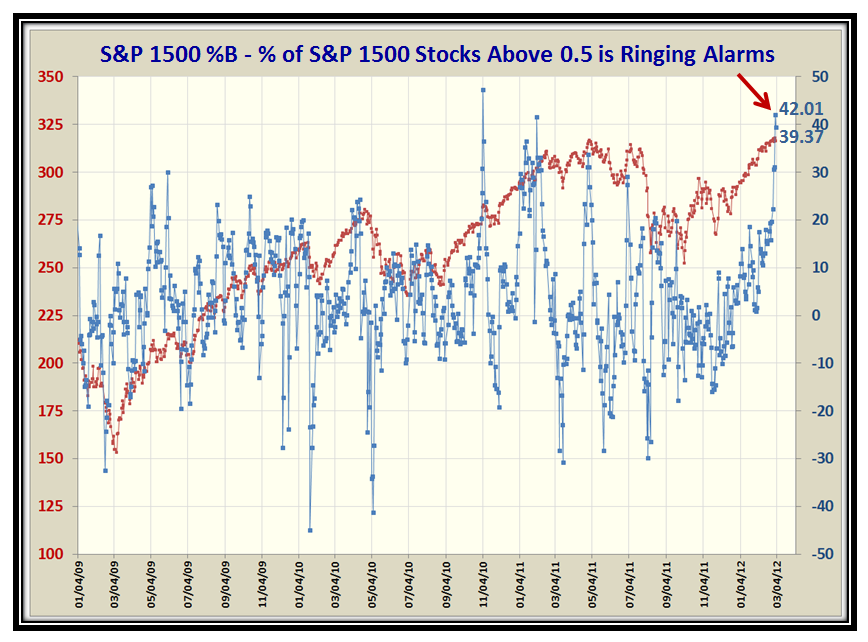
…And here is the chart which is worth a thousand words:

The Seminar in three weeks time will be interesting to see how all of this panned out.  There is still time to sign up.  We have several distinguished guests who will be speaking including:

Gil Morales will be speaking at our upcoming March seminar along with Fred Richards and Chris White. Lou Powers, our energy expert will be in the audience, and since energy is such a hot topic, he will probably have some insights for
us. Hopefully, his book will be published soon.

Let’s not forget that Dr. Jeffrey Scott who is a “permanent fixture” will also be talking and we will have a lot of banter back and forth with all of you and have a fun time.

What could be better than basking in the sun with 80 degree weather which we are usually blessed with?

Hurry, hurry, hurry…time is running out.

Best Regards,

Ian

Copyright © 2007-2010 Ian Woodward
Disclaimer: Commentaries on this Blog are not to be construed as recommendations to buy or sell the market and/or specific securites. The consumer of the information is responsible for their own investment decisions.