Ian Woodward's Investing Blog

Archive for December, 2012

Stock Market: Santa Claus High Road?

Monday, December 10th, 2012

I’m sure some of you are itching to buy the Santa Claus Rally now that the Market Indexes are showing signs of life. On the heels of the Blog Note I put up on Saturday, my good friend Dr. Robert Minkowsky noted that I had shown the Mid Cap S&P 400 Market Index leading the charge. He gave me some ideas that will at least give a perspective of what are the challenges for both the S&P 400 and the Russell 2000 to take the High Road from here:

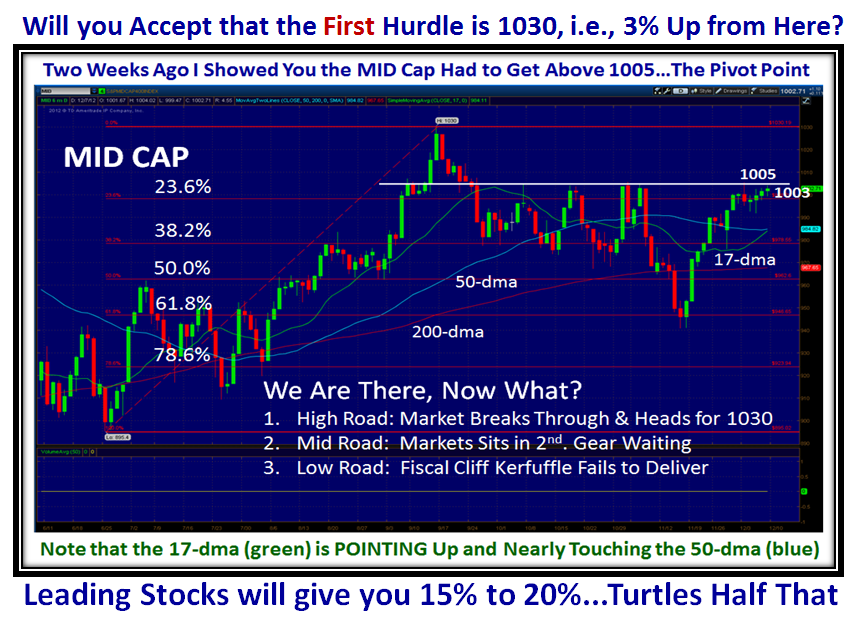
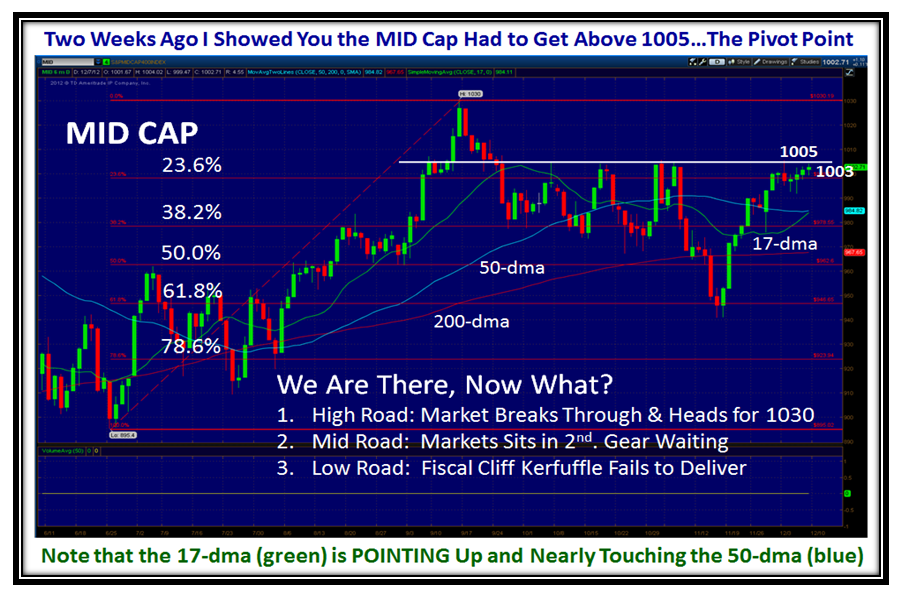
Let’s start where I left off on Saturday, and you will accept that the first Hurdle is for the S&P 400 to get above 1030.

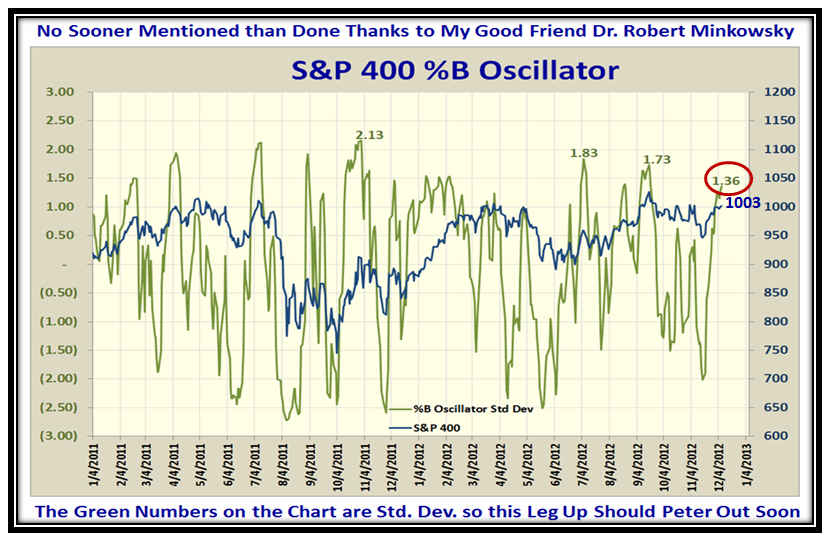
Since the intention is to buy into this Rally at this stage with the 17-dma about to break through the 50-dma to the upside, the question is where does %B stand relative to past history and how much cushion do we have?  Robert has used an approach where he has “Normalized %B” using its Standard Deviation with about 23 Years of past history.  He calls it the %B Oscillator, which is shown below for the S&P400:

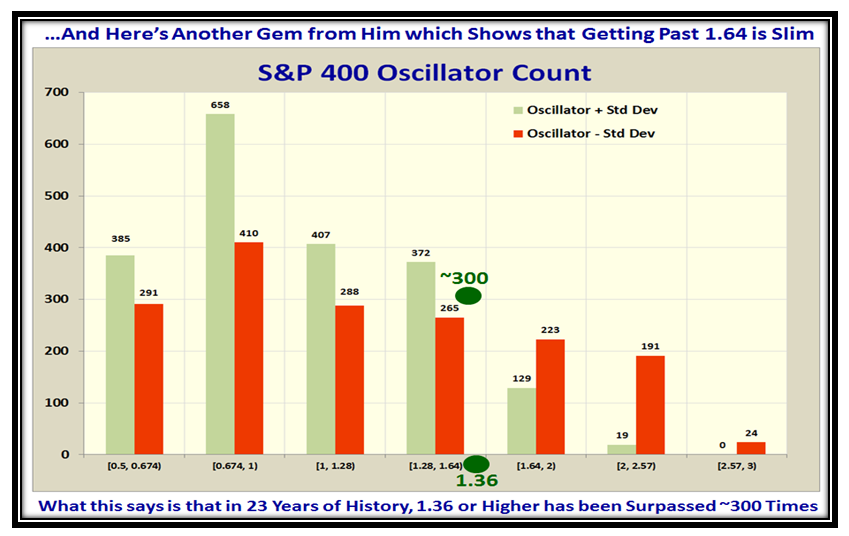
2 Std. Devs. is the Yardstick so we see that we still have some cushion with the reading in green at 1.36, and we can compare it to recent past history.  The second picture shows the statistics for the “Oscillator Count” over the 23 Years of History, and as I highlight in Green, 1.36 has occurred about 300 times:

However, if we look at the next yardstick of 1.64 Std. Dev. it has occurred only 129 times, so although the Mid Cap Index has surpassed that twice before this year, it suggests that is about as far as we can expect it to go on this Rally.

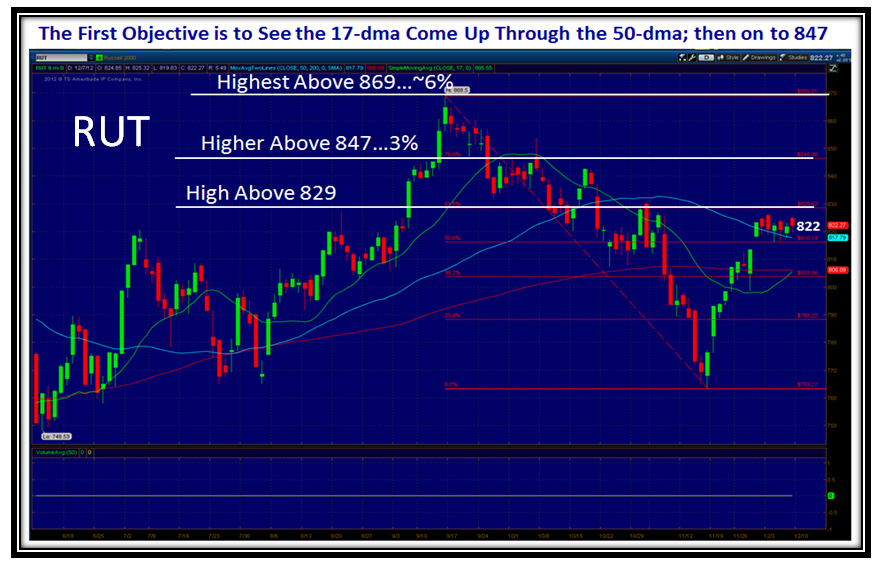
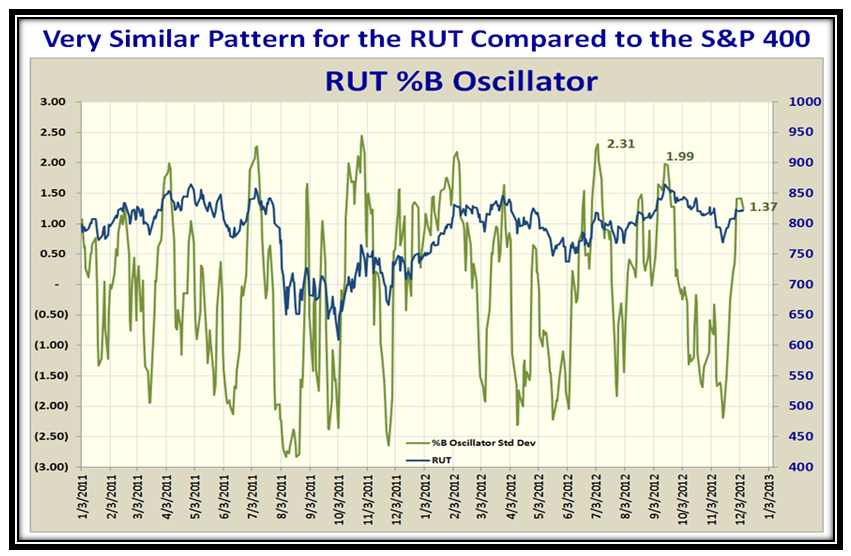
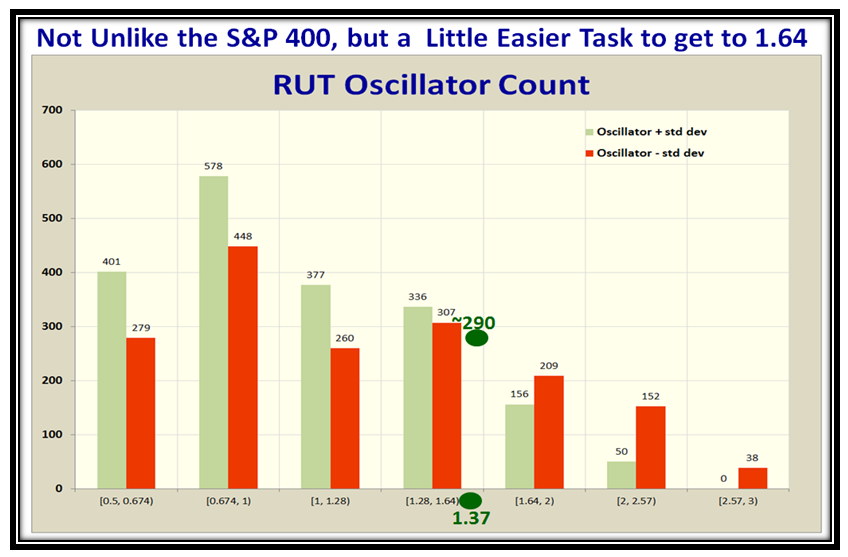
I’m sure you are asking “What about the Russell 2000 (RUT), since small caps get a boost at this time of the year with the so called “January Effect”?  No sooner said than done:

The results are very similar, but the RUT has a bit more cushion since it shows 156 readings at 1.64 Std. Devs. compared to 129.  The net bottom line is to be on your toes with tight stops if you are entering the Market at this stage where you are certain there are big things to come when the Fiscal Cliff kerfuffle is behind us before the New Year.  Thank you Robert for a new perspective of how to use “Normalized” %B with Std. Deviations and Historical Count.

Best Regards,

Ian

Stock Market: Fiscal Cliff Fudge!

Saturday, December 8th, 2012

On this quiet Saturday afternoon I see that Finland tops the list of those looking for where the Stock Market stands at this critical Pivot Point, followed by the Netherlands, Viet Nam, Indonesia and we must not forget my friends from Qatar.  That’s not to forget that Australia, United Kingdom and Canada who are always at the top, but the first two are in bed and will log in tomorrow with luck!

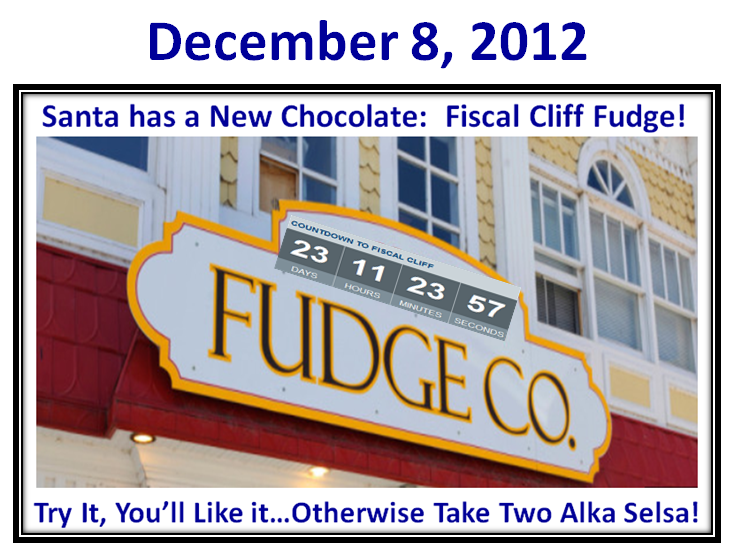
I have a New Headline for you from Santa who has a New Chocolate:  Fiscal Cliff Fudge!

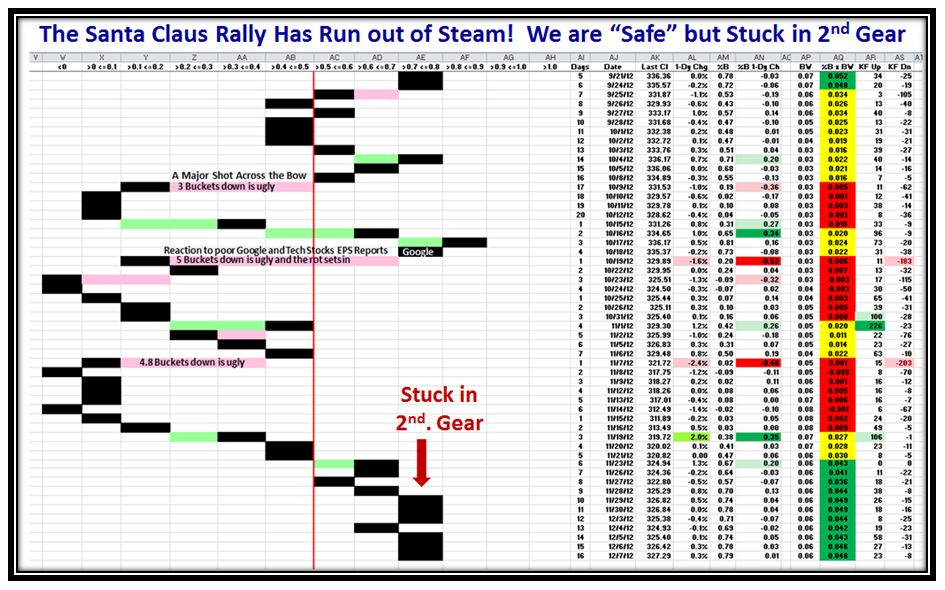
I don’t know about you folks, but frankly I am weary of all this Fiscal Cliff mumbo jumbo;  yet it is patently obvious that the Stock Market is sitting in 2nd. Gear waiting for something to happen.  The best I can do for you is to give you the Three Road Scenario and point out that we are now at the Pivot Point I gave you 2 weeks ago where I indicated the Stiff Resistance the Markets had to overcome.

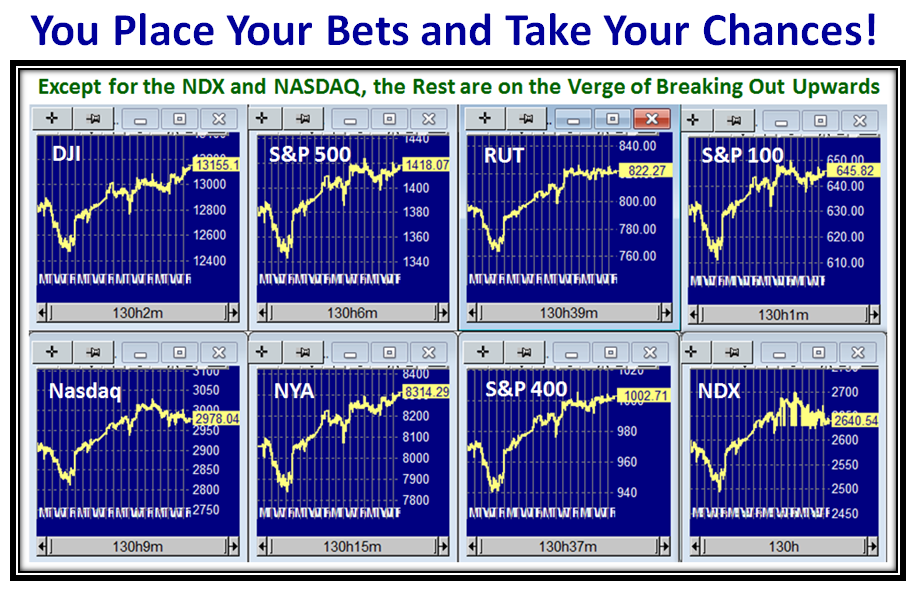
If you believe the Powers that be will cobble up some Fiscal Cliff Fudge before year end then the general signs of the Market are that it is showing it is poised to go up, so play like a Type 1 or 2 Short Term Trader and have tight stops…otherwise sit out the rest of this supposed Santa Claus Rally which has already recovered around 7% from the recent bottom.  Meanwhile, you do realize we are stuck in 2nd. Gear:

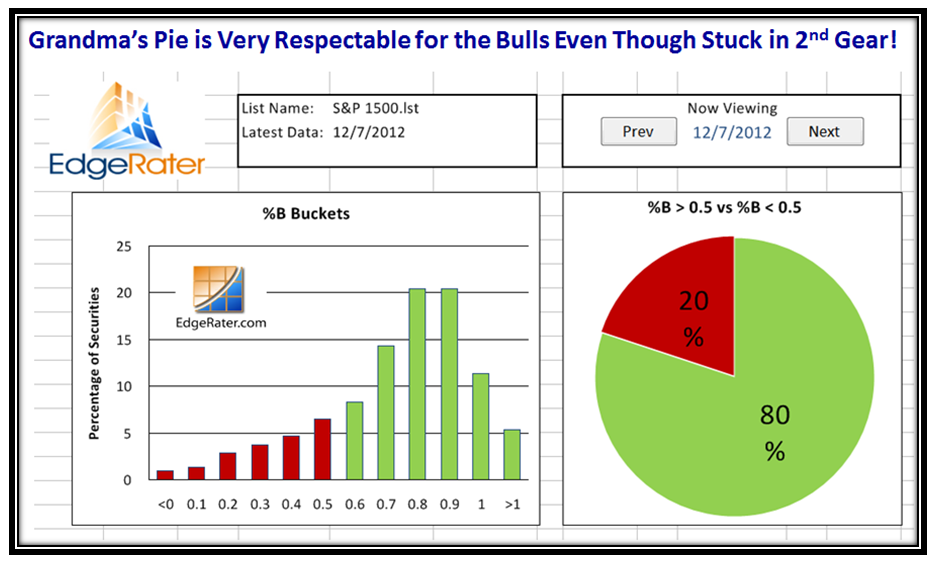
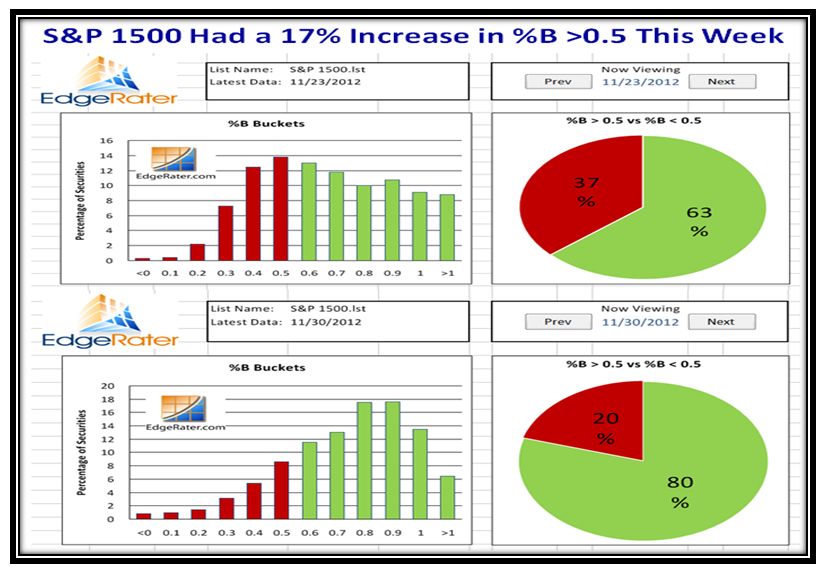
As I say, the internals of the Market are very respectable when we have an 80:20 Ratio in favor of the Bulls on the S&P 1500 stocks above and below 0.50:

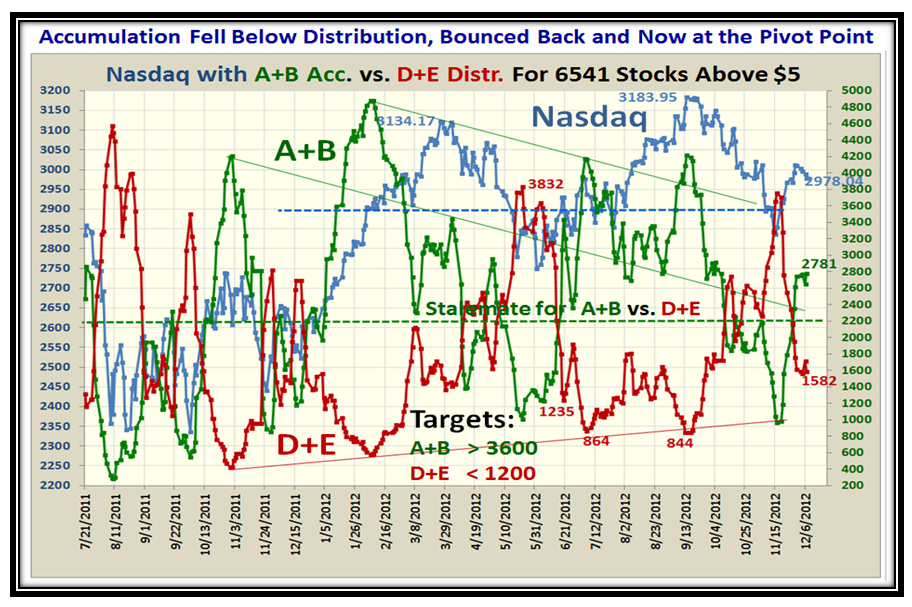
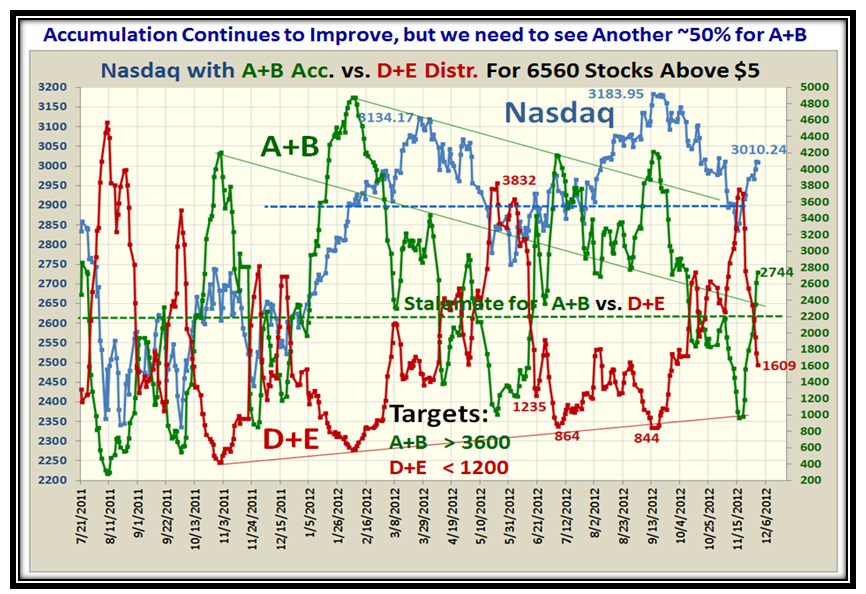
…And, the Accumulation of Stocks is showing the same upward bias, though not with superior strength:

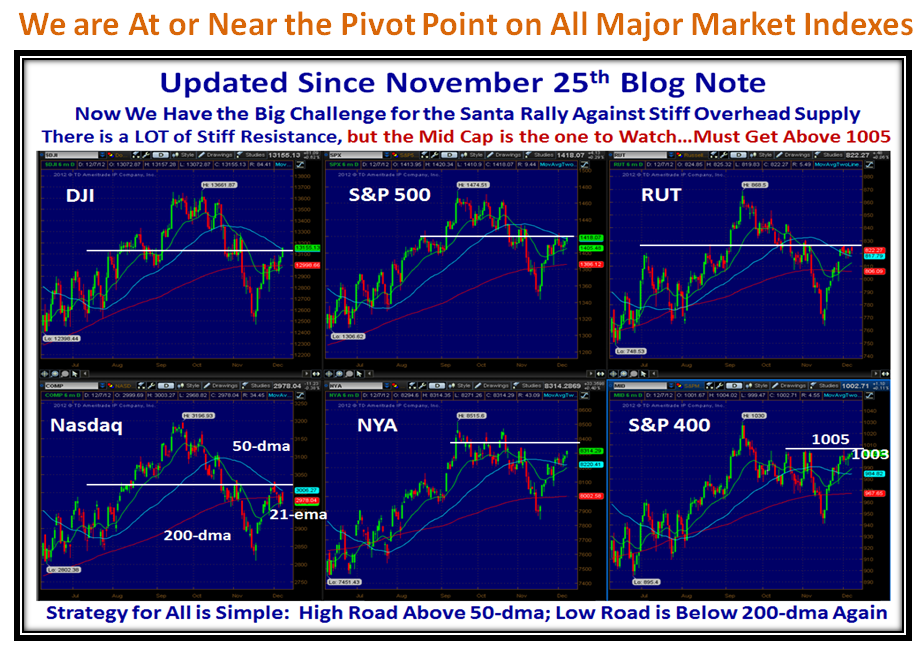
Two Weeks ago I gave you my Thanksgiving Gift and it proved to be of value…We are at the Pivot Point:

I have added the 21-ema which between friends is the same as the 17-dma.  You will note that the only Index that has the 21-ema up (green) through the 50-dma is the Mid Cap S&P 400 stocks, so this is the Leading Index.

So let’s zero in on the Mid Cap Chart and I have given you the High, Mid and Low Road Scenarios with explanations of what the Market should do:

So there you have it, the status and the alternatives for the Road Scenarios.  Please drop us a line if you plan to attend the March Seminar.  It helps us enormously at this end.

Best regards,

Ian.

Stock Market Dancing Like Gangnam Style!

Saturday, December 1st, 2012

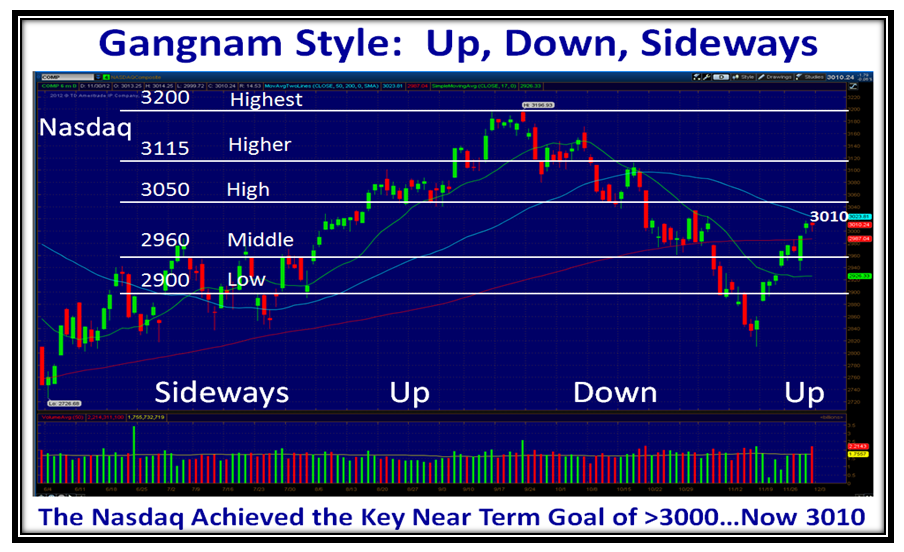
My 11 Year old Grandson danced Gangnam Style at Thanksgiving and I am now in the groove and just couldn’t resist capturing this picture for posterity sake.  I wish I could get 884 Million hits on my blog!

The good news is that the NASDAQ has clawed its way back up above 3000 in this past week and now must face the challenge of moving to the High Road Scenario once again.

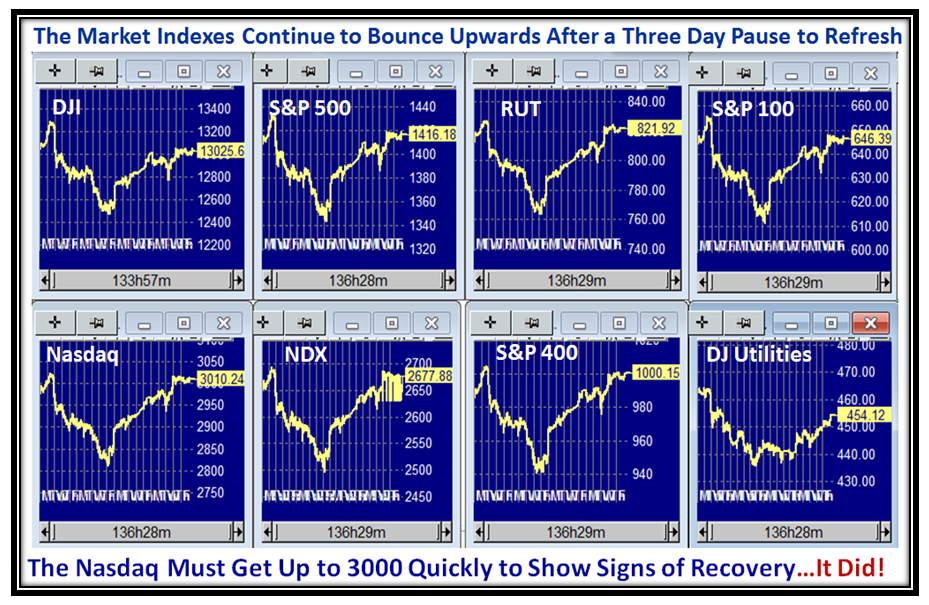
The Market Indexes Got a Knee Jerk at the Open on Wednesday, but shot back up to keep the Rally going:

There has been a big turnaround in the internals of the Market and especially the Accumulation vs Distribution ratio.  At least we are now out of the Stalemate Zone so the Santa Rally remains intact:

…And here is another snapshot which will stiffen your backbone with the improvement in Grandma’s Pies:

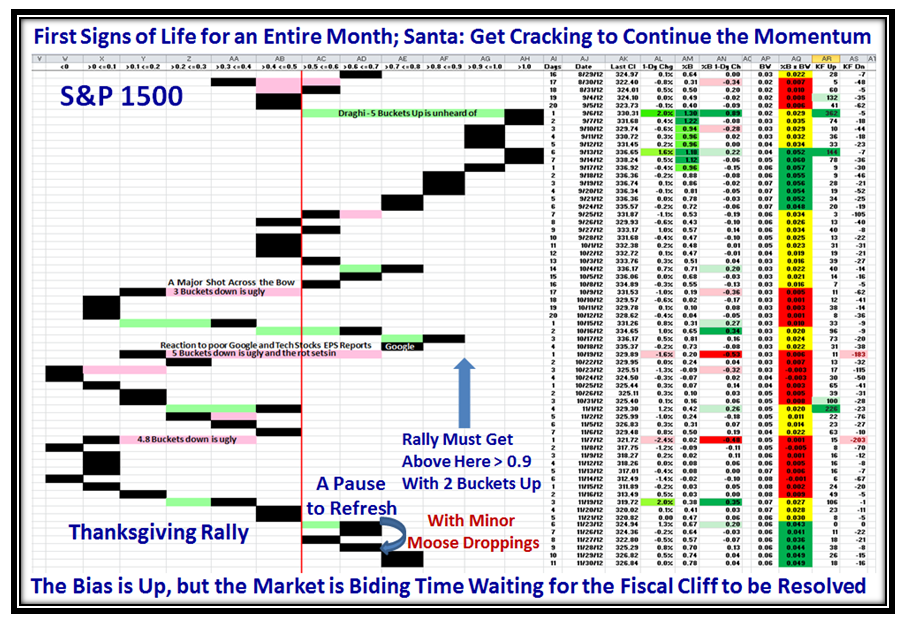
Last but not least we see we had the Pause to Refresh and are now trotting up again, albeit slowly:

…And here by popular request to prove I am a fast learner!

Enjoy your weekend.

Best Regards,

Ian.

Copyright © 2007-2010 Ian Woodward
Disclaimer: Commentaries on this Blog are not to be construed as recommendations to buy or sell the market and/or specific securites. The consumer of the information is responsible for their own investment decisions.