Stock Market: Scary Ride to Come or Up, Up and Away?
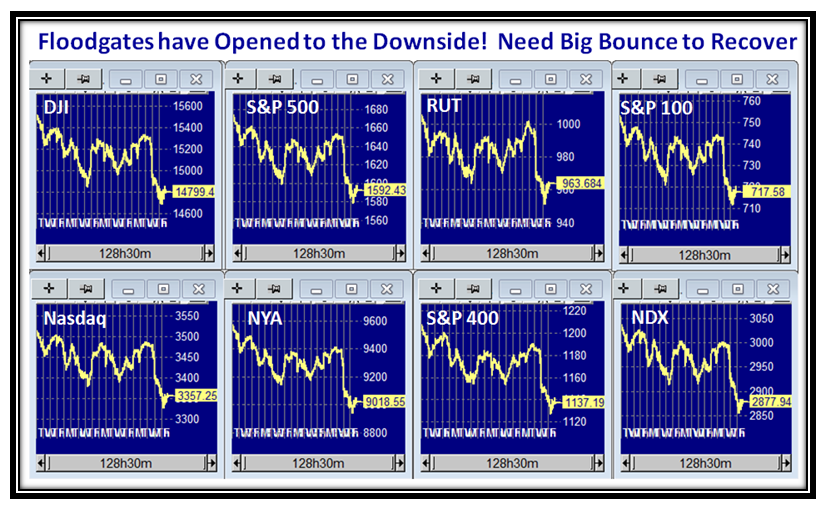
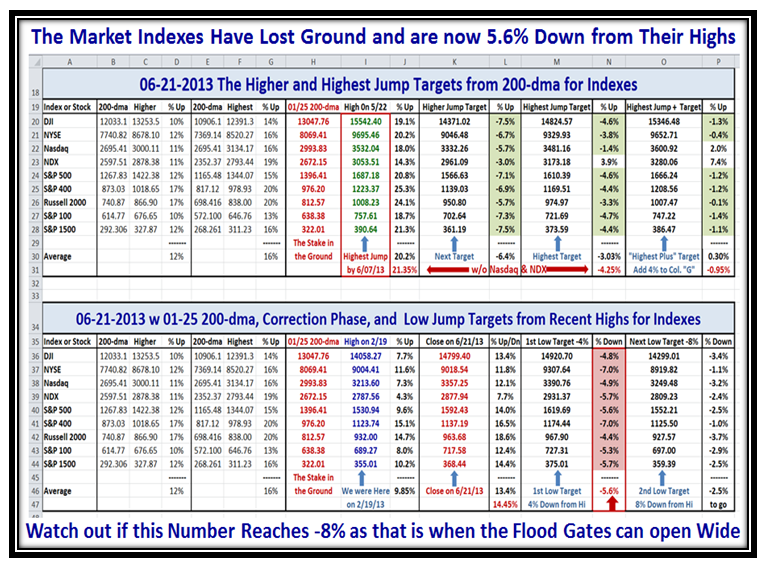
The Market Indexes have dropped on average 5.6% from their Highs posted on 5/22/2013, and the $64 question is “Are we in for a Scary Ride downwards or is this just a Minor Correction before we move up again?”
As we would expect, the Floodgates have opened to the downside and recent support has been broken on all Indexes:
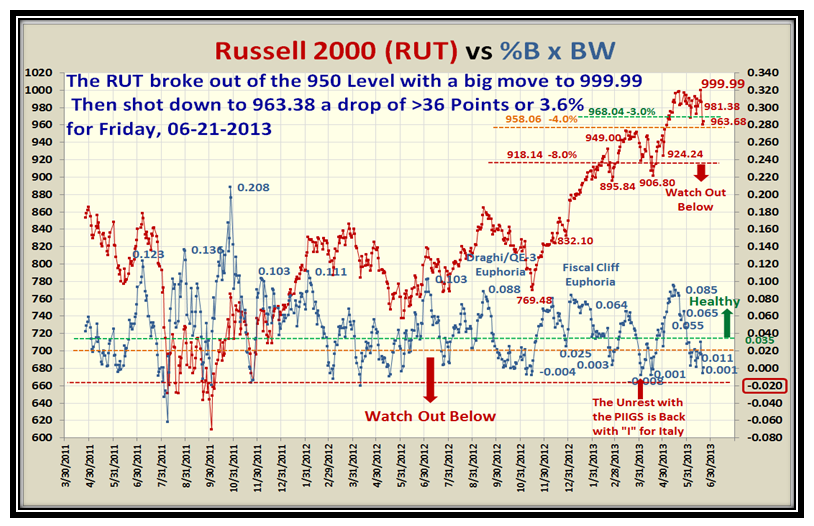
The Russell 2000 (RUT) took a hit but is still holding above 4% from its High:
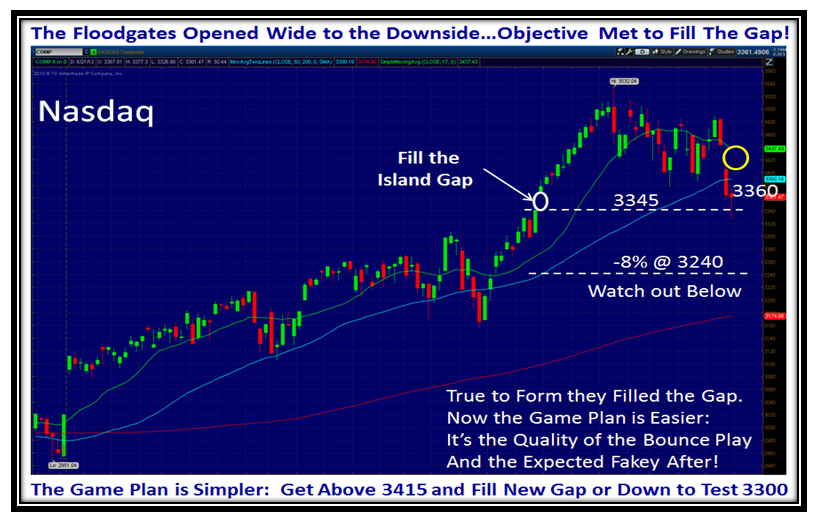
As previously mentioned, the Island Gap was filled and now we have a gap above to fill or we trot down to challenge -8% @ 3240:
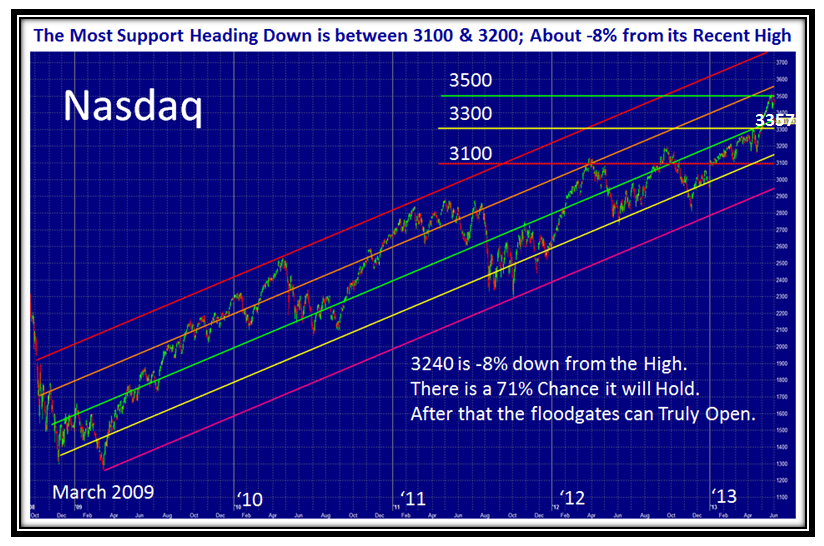
Here is a Longer term view for the Nasdaq showing the trend-lines, so there is still cushion before real damage is done:
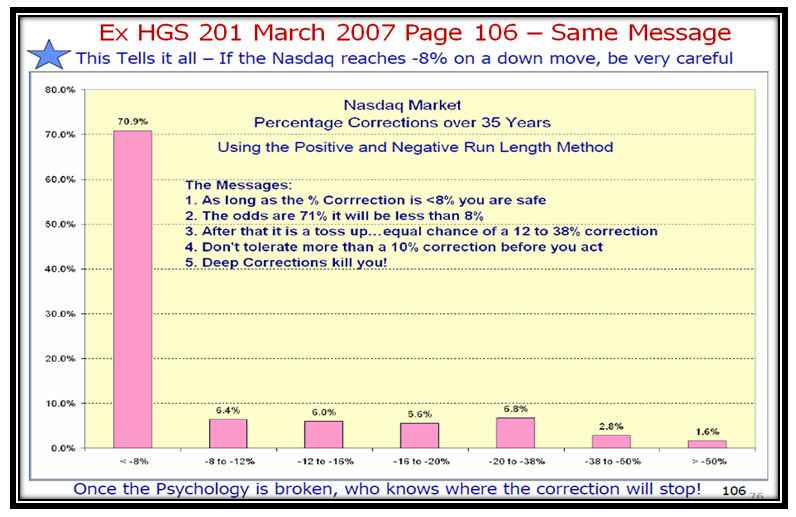
You remember this chart…Below -8% and the Market Indexes can land anywhere, but there is a 71% chance to find support above it:
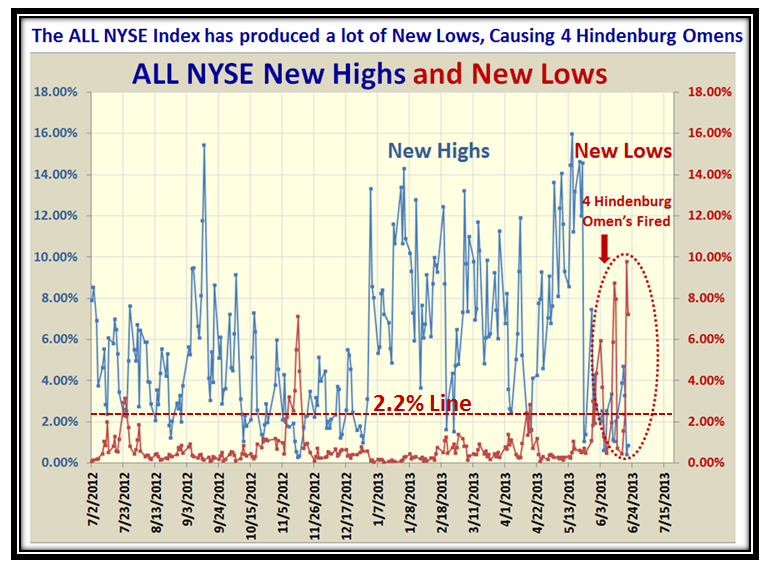
This next chart shows that the # of New Lows fired recently to fulfill the Hindenburg Omen requirements of 2.2% Highs and Lows:
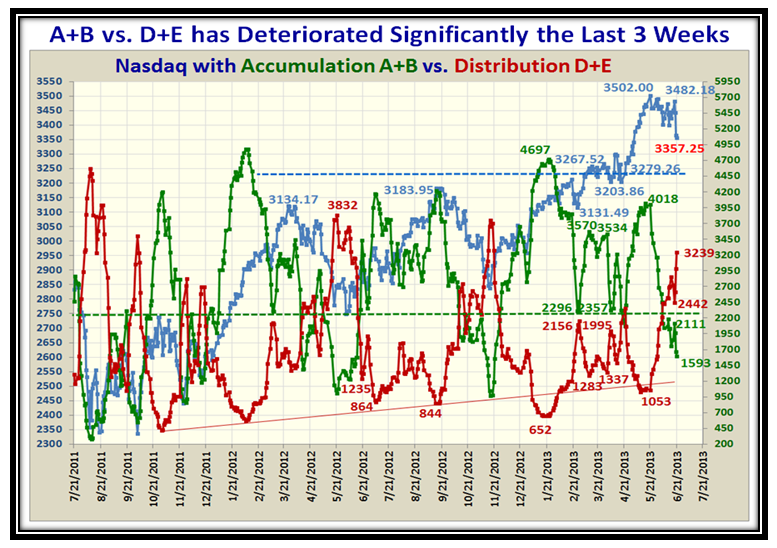
The Internals are awful with A+B now less than D+E by a factor of 2:1:
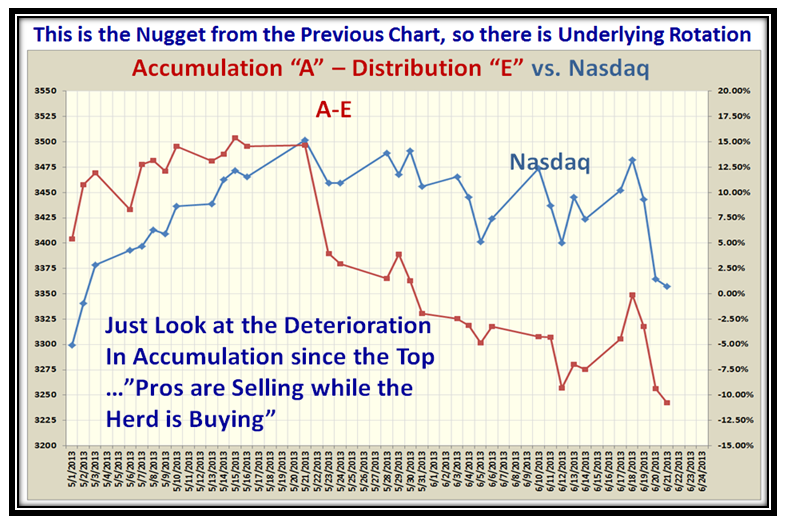
Worse yet, the “E’s” are swamping the “A’s”, and it will take a strong comeback by the Bulls to right this ship:
The Spreadsheet shows that the Market Indexes are now down -5.6% on Average from their Highs:
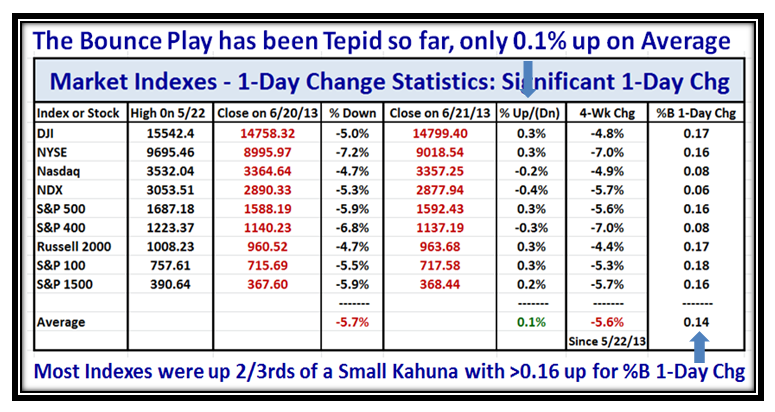
The Bounce Play has been miniscule so far, so we see what transpires this coming week:
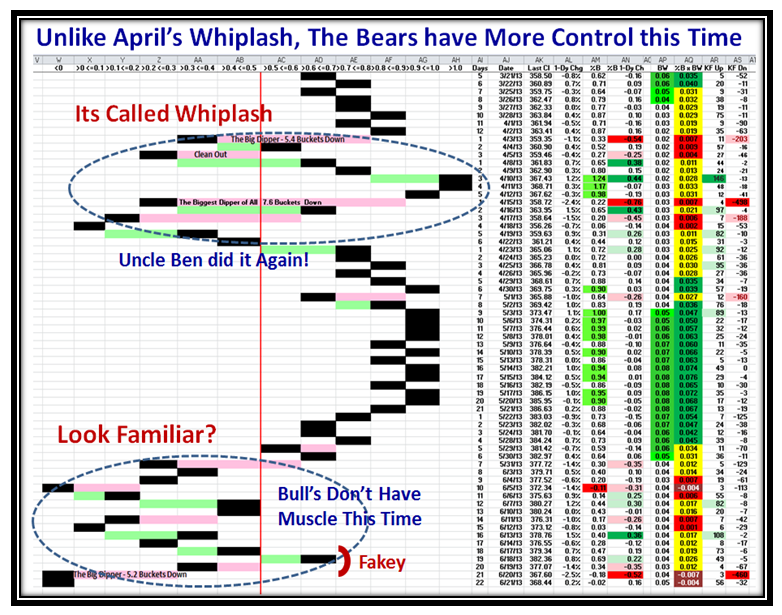
As expected, we got the “Fakey” I warned you about, and now we are back in the doldrums:
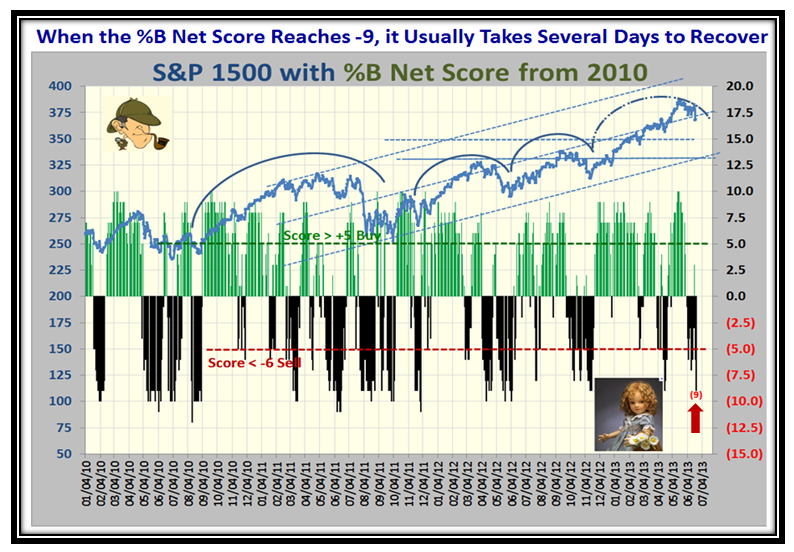
…And last but not least, a (9) shows weakness and it will be a while to gain support to the upside again:
Good luck and Keep your Powder Dry!
Ian.
 Ian Woodward's Investing Blog