Ian Woodward's Investing Blog

Archive for August, 2013

Stock Market: When the Bough Breaks

Sunday, August 18th, 2013

With Hindenburg Omens flying right, left and center with four of them within the last week or so, one way to tell when the Institutions are vacating is to do the “Canary in the Coalmine” test.  Watch 8 to 20 Large Cap Stocks which are recent flyers with >50% Institutional Holdings and see whether their chart patterns are staying up above the 17-dma or drooping:

Bough Picture

Here is a Test list of eight stocks which are in vogue at present and we see that we have 25% (GOOG and AMZN) drooping. If we find that two more start to give up the ghost, it’s a sure sign that you need to protect your nest egg and gradually move your money to cash or short the market:

Bough Eight

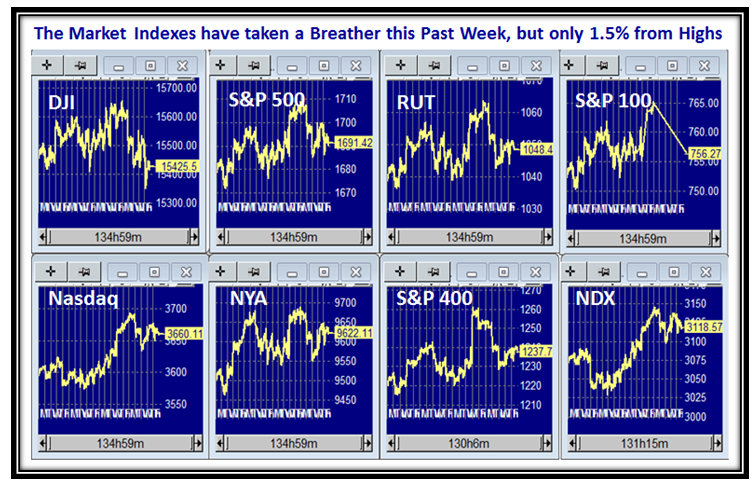
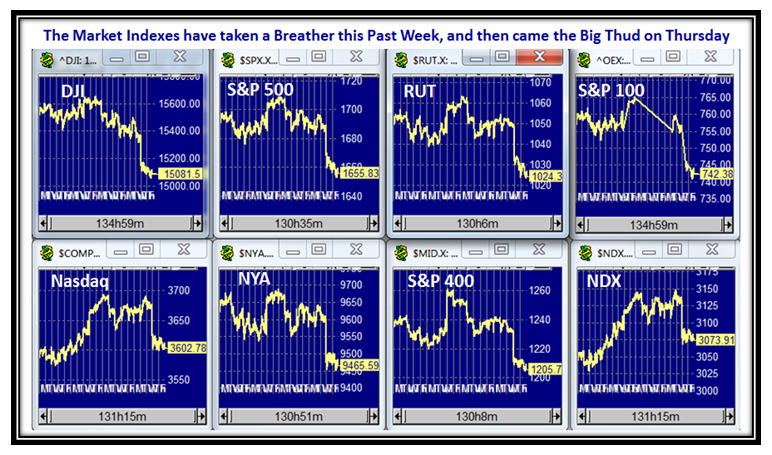
And as you would expect, after the clobbering the Market Indexes took on Thursday, the droop is on and the Bears are in Control:

Bough Indexes

As we well know the Volatility Index (VIX) has been unusually dormant, but perked its head up this week.  It is currently at 14.37 so there is plenty of cushion at this stage before it gets to 20ish, when it can then quickly go into oscillation as the Market takes a real dive and we rush for the exits.  Make sure you are not trampled on:

Bough VIX

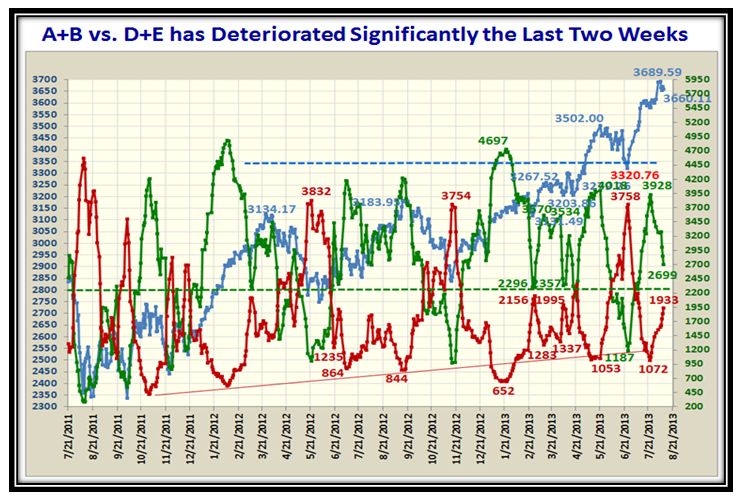
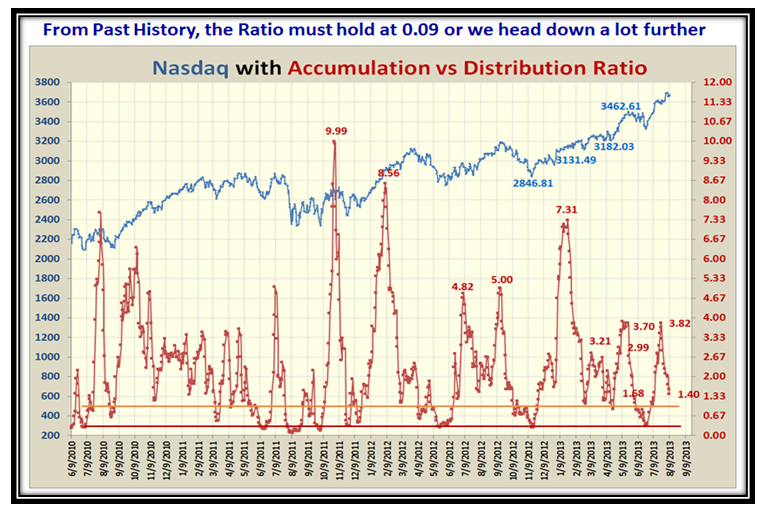
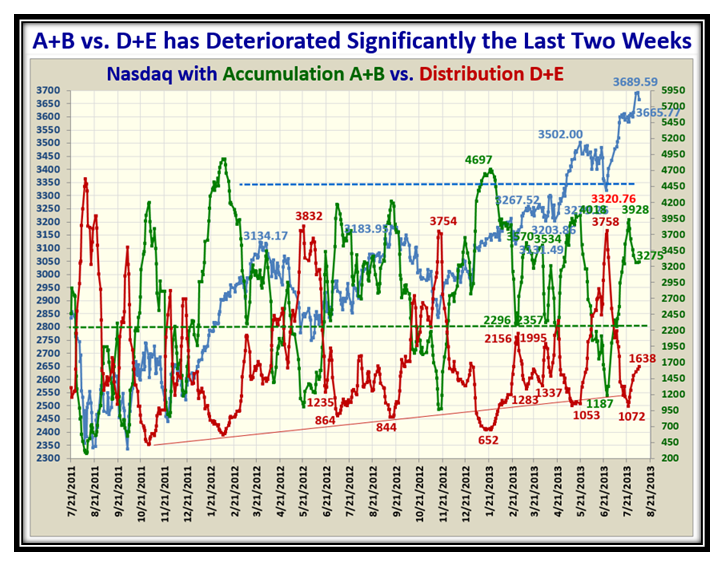
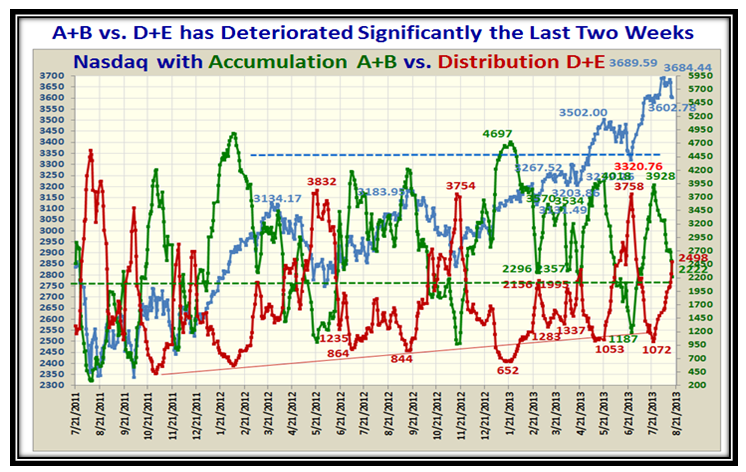
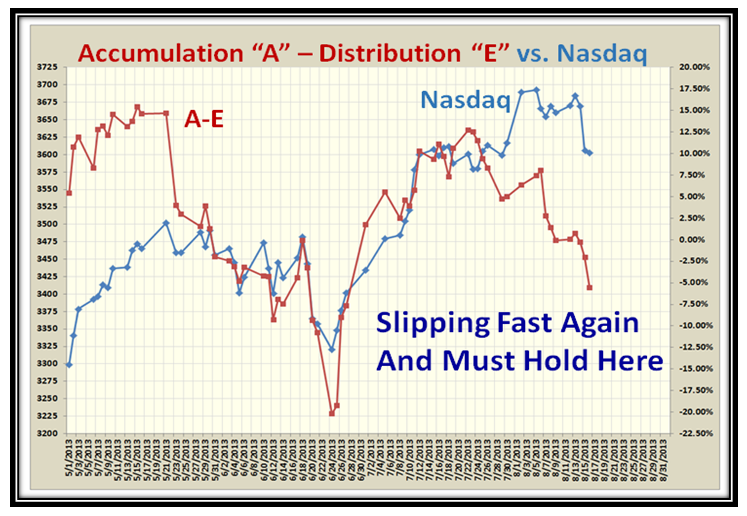
It is only natural to expect that the Accumulation vs. Distribution has deteriorated appreciably these last two weeks:

Bough abcde

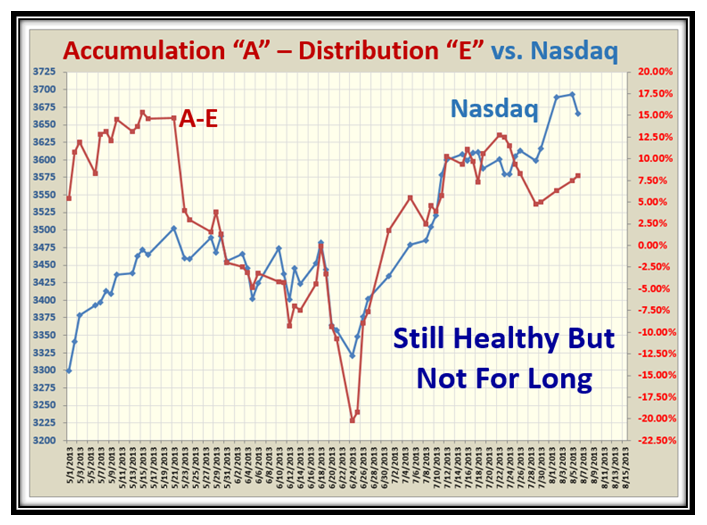
…And if we dig deeper we find that %A-%E stocks are slipping fast again and it is critical it holds here or down she goes:

Bough a-e

Here is a picture you have seen many moons ago when Wikipedia first plucked a similar picture showing 2005 to 2007, and is still popular today where many supporters have tagged it to get to my site.  Incidentally, Germany, Israel and Saudi Arabia have been having a recent feast on these past notes on the Hindenburg Omen…tell your friends:

Bough ho chart

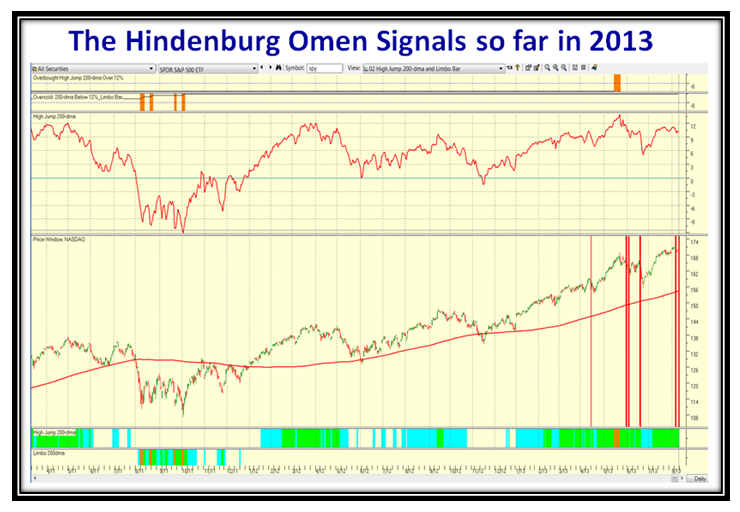
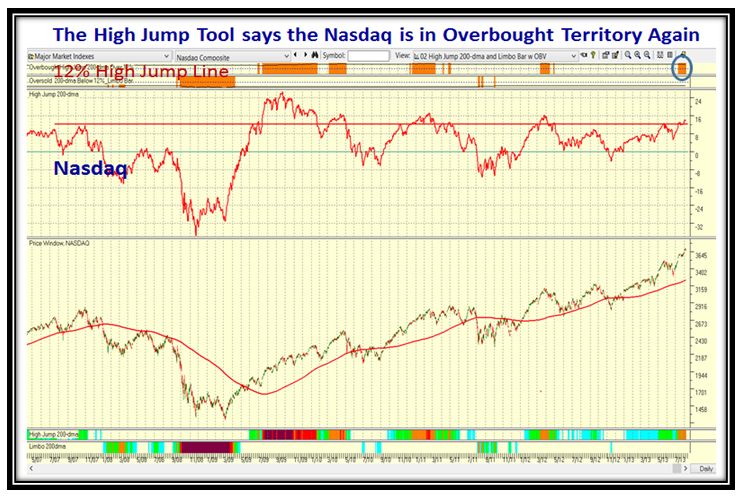
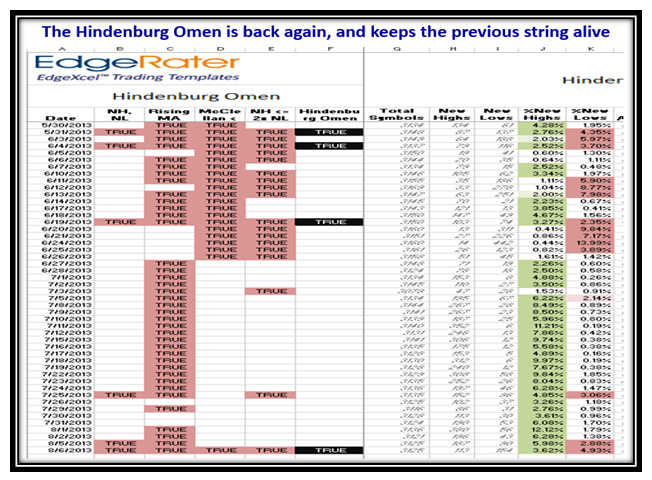
Note how the High Jump 12% Line in the Sand being breached a few weeks ago signaled a potential correction and here we are.  This next chart updates the picture of when the Hindenburg Omen Signals fired, and we now have a decent CLUSTER, which is key to observe as it invariably suggests the more the merrier for potentially a deeper fall.  Of course we don’t have to belabor the point that the original dataset has changed so we shall see what this new lot of using the ALL NYSE produces in the fullness of time.

Bough ho2

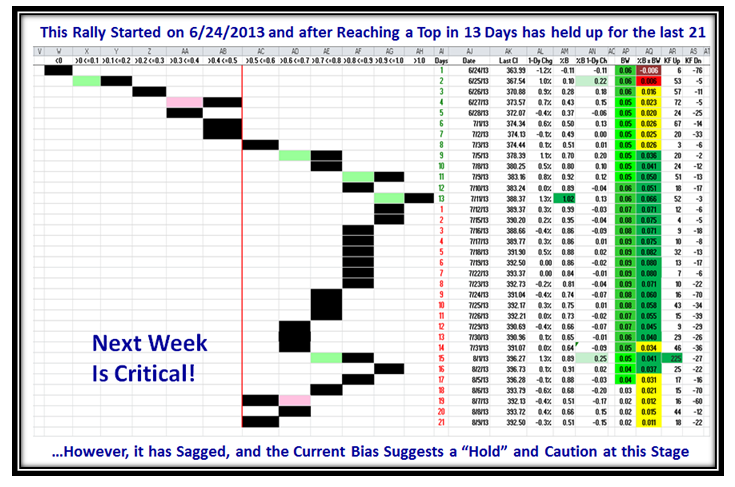
Here is a favorite chart of mine as all who follow my work using Bollinger Bands and “Buckets with %B for the S&P 1500” understand, I suggested in an earlier blog note that we had a critical week ahead of us and that is precisely what happened.

Bough Pat

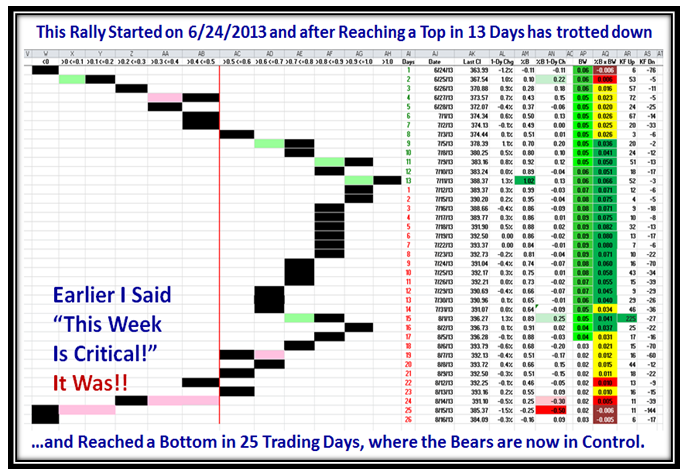
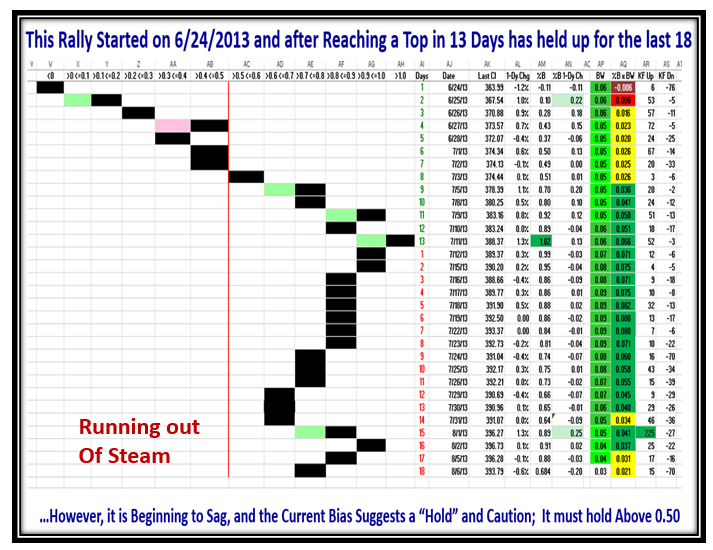
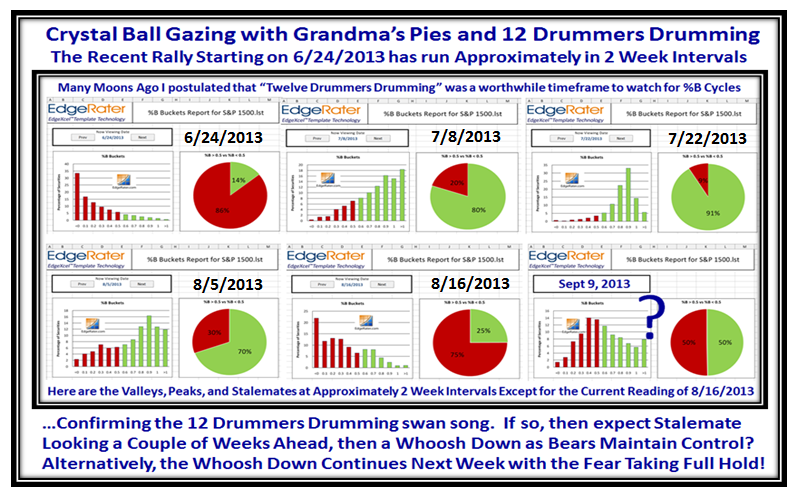
Those supporters who have been with me for sometime will recall that several years ago I hit on the concept of “Twelve Drummers Drumming” from the Carol “And a Partridge in a Pear Tree”, inferring that once a market starts a New Rally or has reached a Top %B will usually move in segments of 12 to 15 trading days up, down or sideways.  If you look down the center column in green and red of the above Columns you will see that is what has precisely happened this time around.   13 Trading Days up, followed by 16 Days down to sideways, and then 10 days down so far.   Keep this concept in mind as I take you through the next two slides where we couple this with Grandma’s Pies of the Ratio of %B above and below 0.5:

Bough Grandma

Grandma’s Pies are very soggy at 25%:75% above and below the middle Bollinger Band for %B.  Now for the Concept of coupling began, and then within 13 Trading Days on 7/8/2013 it had trotted up to a bullish ratio of 80%:20%.  Two weeks later %B was still holding, and then the next two pictures show the down cycle.

It’s anyone’s guess as to what will happen in the next two weeks, but there are two scenarios to watch for:

1.  The Market continues to trot on down or

2.  The Bulls come back from a beaten down market to push it up to where %B above and below 0.5 would be at Stalemate (say), i.e. 50:50 where usually one should expect a “Fakey” and the Bears take charge again.

Bough Grandma2

It will be interesting to see how all of this unfolds.  We will be holding our usual Monthly Roundtable on Tuesday, August 20th where we will as usual cover the details of the newsletter and include some of the new concepts in this Blog Note.

Best Regards,

Ian.

Stock Market: Wolves Howling with More Hindenburg Omens

Sunday, August 11th, 2013

The Wolves are howling in a Blue Moon giving warning of two more Hindenburg Omens this past week with the last one surprisingly on Friday!

Blue Picture

The Market Indexes took a well deserved breather this past week with many of them having chalked up new Highs, and at this early stage they are only down about 1.5% from their recent highs.  We have been here before, but the tom toms are beating with the revival of these recent Hindenburg Omen Sightings.

Blue Indexes

The Small Cap Russell 2000 (RUT) which has mostly led the way lost a lot of ground in its %B x BW reading, so this also suggests Caution and suggests more down movement to come unless the Bulls can renew their enthusiasm to step in:

Blue RUT

Grandma’s Pies are at Stalemate and next week will determine which way the market will move, up or down:

Blue Grandma

The Rally is long in the tooth and sitting at the 50:50 dividing line, which once again confirms that next week is critical:

Blue Pat

…More of the same:  Accumulation vs. Distribution shows major sagging:

Blue abcde

Here is a New Picture of the %A – %E stocks, which suggests we are close to a turn up or we suffer a lot more downwards:

Blue a-e

Now we come to the news of all this Hindenburg Omen mumbo jumbo (good stuff).  I can hardly believe that six years have passed since my Blog Note of this phenomenon was mentioned by Wikipedia.  Time passes when you are having fun.  80% of the time, these signals result in minor to medium corrections with minor far outweighing medium.  However, the Omen is that for other 20%, there has never been a Bear Market Correction without a series of Hindenburg Omen signals, which is its real claim to fame.  Here is where we stand as a follow-up to my last Blog Note on the subject and I am really indebted to Chris White for providing us this indicator in template form  to stay on top of such events.

Blue ho

For those of you who are new to this stuff, please understand that the powers that be changed the criteria for these sightings when the NYSE made drastic changes to the content of stocks for their NYSE composite to just using only common stocks which caused a switch to using ALL NYSE stocks instead which roughly doubled the number.  The HGSI software which pioneered providing this feature back in the early 2000’s at my behest  has not switched to this new set at this time, so keeping track of this valuable function is not possible at this time.

This raises another question as there are essentially three camps:

1.  Those who only want to know it has occurred without the details, or alternatively could care less discarding it as a bunch of hokey pokey.

2.  Those who want to understand the details by way of numbers (use EdgeRater Pro software)

3.  Those who would prefer to see the results depicted as a graph (HGSI software)

Since I have encouraged both these products to incorporate this valuable Indicator, I have taken the time to satisfy both types by “painting in the dates” (for now) from EdgeRater Pro onto the HGSI chart as shown below:

Blue ho chart

There is a Method in my madness to show the chart using one of the other features I consider of tremendous value to Top Down Investing and that is the High Jump Tool.  I used the SPY (S&P 500 surrogate) in the above chart, but show the  Nasdaq view below.  Please note that this view is also showing caution by the blue ring, where the Nasdaq is now >12% above its 200-dma.

Blue ho chart2

Forewarned is forearmed and you now have both sides of the coin to know what to do to preserve and/or grow your nest-egg which is my objective to help you.

Best Regards,

Ian

Stock Market: Hindenburg Omen Yesterday!

Wednesday, August 7th, 2013

Yes, the Hindenburg Omen Scored another hit yesterday.

HO Picture

Chris White, the CEO of EdgeRater has provided us with a Template of the Hindenburg Omen which makes it simple to watch for this, and here is the recent evidence of when it has struck, including yesterday:

HO EdgeRater

This Recent Rally is now long in the tooth and deserves a rest as it has been 31 Trading days since it started back on 6/24/2013.  It has held up very well but is now running out of steam:

HO Pat

Further evidence comes from Grandma’s Pies for the S&P 1500 which confirms sluggishness:

HO Pies

…And, more of the same with A+B vs D+E showing deterioration in the last two weeks:

HO abcde

Lastly, %A-E is still healthy but not for long, so take heed of all these warning signs:

HO a-e

Best Regards,

Ian.

Copyright © 2007-2010 Ian Woodward
Disclaimer: Commentaries on this Blog are not to be construed as recommendations to buy or sell the market and/or specific securites. The consumer of the information is responsible for their own investment decisions.