One week up, the next week down!
How does one play a tricky market like this? Camp “Light on your Feet” is the answer.
What does that mean? Type 1 & 2 Traders who are used to the volatility and are very
nimble have no problem as they are adept at taking what the market will give them.
It’s the Type 3’s who are swing trader’s who are prone to suffering and the Type 4’s
who are buy and hold…they are the one’s who get a trifle frustrated, but have now
learnt that they too must be nimble. You must have tight stops and then you put up
with the frustration or you don’t “play”.
Alright, enough of that standard stuff, but where are the signposts from this week?
We had a Phoenix after four down days so it was ripe for one to occur. That said the
Bears were now in control. Two days later we had an Eureka, and it was followed up
by another one the very next day…Friday, so the Bulls are back in control – until next
week! But take a little additional comfort as there was a Kahuna or two to go along
with either the second Eureka, or the first one as well. What does that mean? In
these modern times it is a simple way of showing you signals of:
1. Which Camp, Bull or Bear is currently in control?
2. The extent of Irrational Exuberance by the Bulls (Eureka) or the Bears (Phoenix)
3. The potential Staying Power of their exuberance by Kahunas up or down
Those of you who are interested in far more in depth methods of these simple concepts
would do well to read Value in Time by Pascal Willain, who has delved deeply into
segragating this Exuberance through Effective Volume for Large Players and Small Players. We all struggle for being ahead of the “News” and his methods provide the trader with the breakthrough valuable tools that develop the Money Flow. I am very impressed with the work he and his colleagues have done and I will uncover more of this at the seminar in seven week’s time.
The HGS Investor must focus on two sets of tools that the HGSI Software provides that become part of the daily routine:
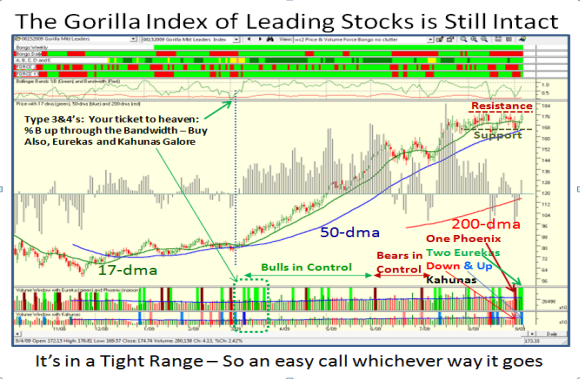
1. The Gorilla Stocks Index established nearly three months ago on 6/15/2009
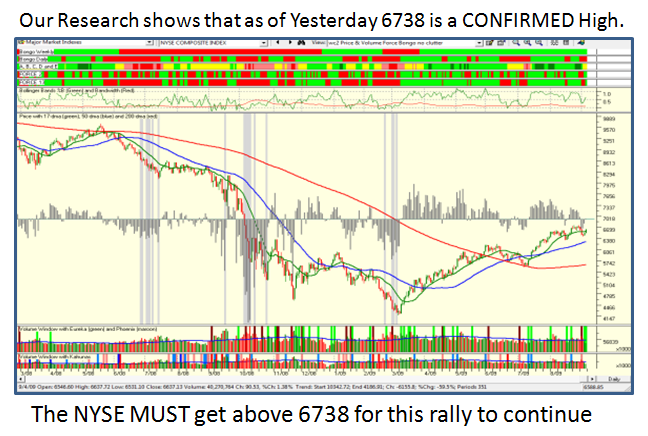
2. The landscape of the Proprietary Indicators as exemplified by the “wc” chart
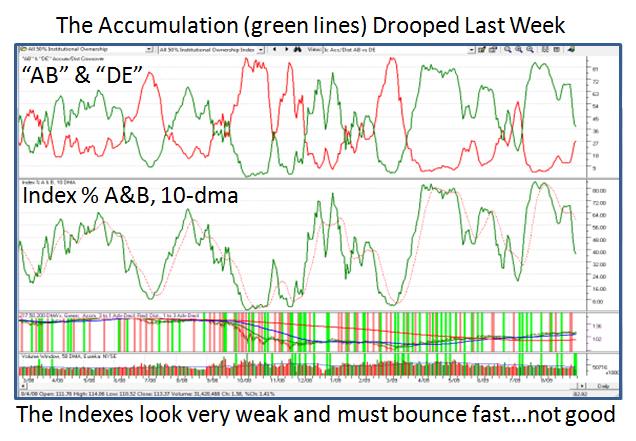
3. The feel for where the Accumulation/Distribution stands using Ron Brown’s “Ic” key
So let’s take a look at each of these pictures in turn:
We know from past experience these take a long time to roll over and die, and just when
we felt they were giving up the ghost, lo and behold, they have popped their heads up
again. I have featured this chart several times before, including providing you with the list of stocks; you have only yourself to blame if you don’t follow this Index regularly.
What’s more, if you have patience they usually provide you with substantial gains over a
short period of time…just see for yourselves; there are no tricks up my sleeve. I have said it before and I will say it again, STEC is one of the potentially BIG Stocks of the future. Of course, you have to buy it right and you should know how to do that by now.
There is a plethora of Bull and Bear footprints, which become second nature to those who want to take the time to read them. It’s not difficult. Here is this week’s lesson:
1. A Phoenix signal after four down days, where the Bears picked up courage to short
2. Indecision by them, which gave the Bulls encouragement to come roaring back
3. This was evident by two Eureka signals which trumped the Bears’ control
4. Sure volume for the Indexes were light last week, but it’s the last holiday weekend
5. In addition cast your beady eyes on the ribbons at the top…mostly green.
However, despite the two Eurekas that trumped the Phoenix, we had a CONFIRMED high for the NYSE on 8/27/2009 of 6737.60 with a Close of 6722.31. This conflicting situation will only be resolved this coming week if that high is taken out or the NYSE goes down once again to test the 50-dma which is at 6293. We are currently at 6637, so we need a 100 point move and a lot more to the upside before the Bulls can really breathe a sigh of relief. It all sounds a trifle “iffy”, but I would rather be iffy than mislead you. It’s all too close to call so the call is “Stay Light on Your Feet”.
I showed you a glimpse of the detailed Acc/Dist numbers for ABCDE last week, and I am sure you got the feel that we were steadily distributing all of last week. Also, note that the Di up to Di down for the Industry Groups are even-steven at 49%:51%. We must see a rapid improvement this week, or the Bulls will still be vulnerable showing no follow through on their part. Net-net, stalemate and sideways until we get more news; make no bones about it, this market is totally event driven and moving up on fumes.
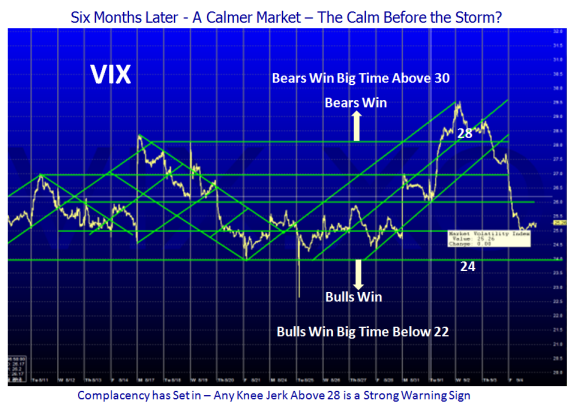
For the Type 3 and 4 Investors, the single most useful item to watch at this juncture is the VIX. I gave you an excellent chart last week and give you the updated one below:
As we can see, the VIX is acting like “The Grand Old Duke of York”…he marched them up to the Top of the Hill and marched them down again. Until it breaks one way or the other as shown we will probably meander in a trading range.
And now you know all I know for next week.
Best Regards, Ian.
 Ian Woodward's Investing Blog