The AAPL Food Chain Index
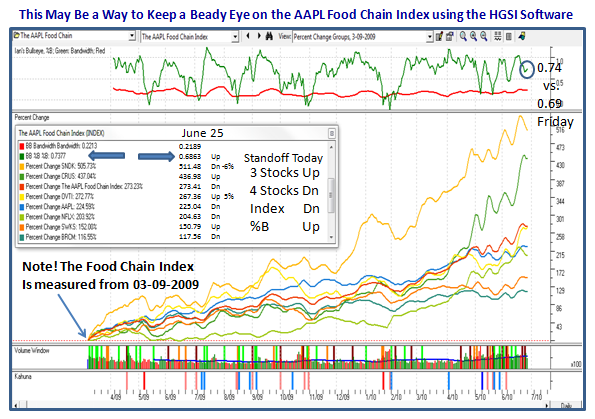
Many thanks to many of you who wrote expressing your positive feedback on the last Blog, where you liked the Limbo Bar and more especially the piece on the AAPL Food Chain Index. For those of you who have the HGSI Software, here is an idea of how to keep an eye on which way the wind is blowing. Just watch how the %B changes on a daily basis. You don’t have to go through all I have done below, but just five minutes of your time will give you the answer:
The Bottom Line Messages: It was essentially a Standoff today:
1. %B is up from 0.69 on Friday to 0.74 today which is good
2. Three stocks were up, four stocks were down, & the Index was down slightly
3. OVTI was the biggest up and SNDK the biggest down
4. Volume was generally down as was the Market, except for OVTI and CRUS
If you get different results, don’t blame me because you forgot to Index from 03-09-2009. Go to the Designer to set the date and then build it for this one Index.
Enjoy! Best Regards, Ian.
 Ian Woodward's Investing Blog
