Ian Woodward's Investing Blog

Archive for the ‘HGS Principles’ Category

HGS Investing Principles – Stakes in the Ground

Saturday, September 1st, 2007

 Stakes in the Ground

My colleague and good friend, Ron Brown, showed you all the useful tricks of the trade in his Movie today by focusing on Leaders.  There are always opportunities as long as you stick to the HGS Investing Principles. His movie says it all and demonstrates how he and you can squeeze the best out of the software to understand the current pulse of what’s working now.  So trot over to the HighGrowthStock web-site and enjoy and use his movies as a companion piece to what I have been showing you these past several weeks.    http://www.highgrowthstock.com/WeeklyReports/default.asp 

One of the basic principles I use is Benchmarking.  Benchmarking comes from past history and/or experience.  I know the usual hue and cry is “But, Ian, History never repeats itself”.  My favorite come back is “But it is worthwhile to know if the Market has ever been there before.  Although all ballparks are not the same size, there are minimum requirements for the home run markers but the diamond is ALWAYS the same”.   Be that as it may, I have found that Benchmarking and Target Setting are basic approaches I use to determine whether the Market is on the High Road, the Low Road or the Middle Road Scenario. 

Another strong principle is to have Stakes in the Ground.  How can one measure unless you know where you are measuring from?  One of the most important Stakes in the Ground is the Base Low.  It is the recent last low after the NASDAQ has had a decent rally and has corrected more than 12%, i.e., more than an Intermediate Correction.  All new Bull Market rallies are measured from that Base Low.  The NASDAQ Base Low is 2387…lightly tapped in for now until the next bull market rally is confirmed. 

At critical times in the market such as around market tops and bottoms, it is essential to have a few mini-stakes in the ground so that one can make assessments as to which way the wind is blowing.  We all have our own pet items to watch, including the VIX, the New Highs and New Lows, Accumulation/Distribution, P-E, EPS, and the list goes on. That’s good.  But again I ask “What do you measure against and the answer is always “Past History”.

Net-net those are the Standard Building Blocks based on known factors which help to keep us on the right side of the Market.  But then what about the new items that are currently in force under present circumstances which are not yet implanted in the history books or for that matter may never be. None-the-less they are useful in real time.  They are personal ways of giving you comfort in what you see and re-assurance in what steps you should take. These are the mini-stakes aimed at spying opportunities.  Sometimes they turn out to be worthless, and sometimes they are gems.  Over time they become your tricks of the trade. 

Here are three tricks of the trade which I have shared with you recently: 

  1. Use different Investor Styles from the StockPicker to assess which type may be working now
  2. Identify Wolf Packs that are stocks in the same Industry Group moving on the same day/week
  3. Use a basket of about 15 to 20 Stocks that are Leaders when the Market is being trashed 

Depending how each and all of them perform subsequently give me clues of the pulse of the market.  Net-net, plant a stake in the ground, wait a week or two and take a measurement. I will show you over this long weekend what I got out of each of these and summarize what they collectively tell me at the end…all while watching the golf and trying to cool off.  Best Regards, Ian.


Stocks are like Wolves, They Hunt in Packs

Sunday, August 26th, 2007

Doodling on a lazy Sunday afternoon while watching the golf, I struck on an old idea of using the Ranking Module to ferret for Wolf Packs, i.e, stocks that are hunting in packs.

Wolf Pack 

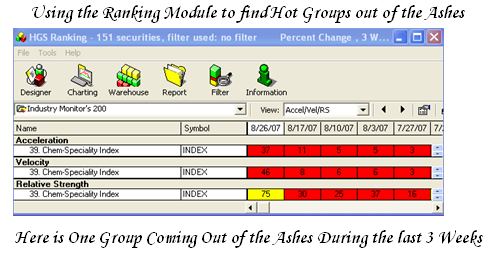
I applied the 0a Key to All Securities and was struck by the number of Chemical Specialty stocks that were high up on the list.  I counted ten in the top 20.  The Combo Rank attached to this filter brings stocks with strong 1 and 5 Day Industry Price gains to the top, so one knows we are working with stocks with strong current momentum.   In addition the Group Rank using Ian Slow is a healthy 92, so it has long term Group Rank Performance.  However, here is a group that has recently been trashed, but is coming out of the ashes.  So I applied the Ranking Module view using Accel/Vel/RS as the view.  The crafty thing is to scrunch the view down to just show the single Industry Group one is interested in the view as shown below: 

Ranking Module 

Note that the setting for the numbers shown is for the Percent Change for the past three weeks, and one can quickly see that although the group has been trashed, it is rising from the ashes very rapidly.  Here are the top 10 stocks for Chemical – Specialty which look very powerful for beaten down stocks:

Warehouse View

Understand that this is a Case Study to help you use the HGSI Software tools to ferret for strong Wolf Packs, which may provide opportunities if the market settles down.  Just look at the number of Box 7 stocks – there are seven of them.  Also note the %E/P, Rev/Share and ROE for all these stocks.  No wonder they have high ERG!  It’s always “Your Call”.

Best Regards, Ian.


Looking a Gift Horse in the Mouth

Wednesday, August 22nd, 2007

Gift Horse 

We, the High Growth Stock Investor (HGSI) Team have made life easy for our investor clientele. Not only do we provide you the software to ferret out the best stocks at any given point in time, but also through our StockPicker and SmartGroups we give you stock selections on a daily basis to suit different Investor Styles.  

During the past three weeks I have concentrated on giving you the blow by blow account of how to evaluate the Market, to understand the Process for Benchmarking and Target Setting, and to relate to the current pulse of the market in terms of the news driving it up and down.  Needless to say this is a strong up day, the kind of day one looks for when the market is trying to repair, as I covered in my note of yesterday.  Maybe the Discount Window trick of the FED has calmed nerves for a while.  The volume picked up today. 

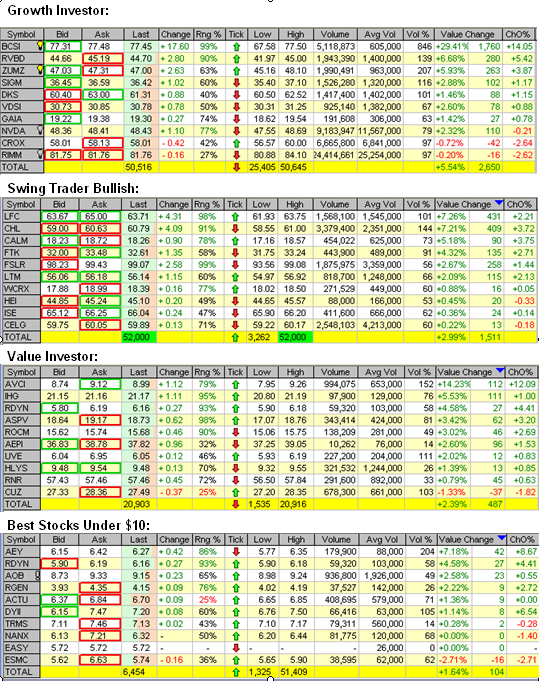
For those who are not familiar with our products, here is a sampling of the types of Portfolios of ten stocks each we select on a daily basis for you to narrow down the stocks you prefer based on your Investor Style.  Naturally, today is an up day in the market, so one would expect stock selections to be up.  However, you know as well as I do that one doesn’t blindly pick ten stocks and buy them as a bundle…you do your homework. As I have warned, only Moment Traders make good money in this market. It is always “Your Call” as to whether you nibble or let the grass grow under your feet. 

On the day, depending on how the wind is blowing you can in real time rifle shoot the Best of the Best using HGSI.  Here is a sample of different types of portfolio from last night’s selections.  The results are based on buying 100 stocks of each selection in the basket, but obviously one would tailor their needs to equal dollar weighted, and of course you can always do that using the Group Performance Analysis (GPA) tool in HGSI.

Gift Horse Stock Selections

As Always, Best Regards, Ian

The Early Bird Catches the Worm but Watch Out for the Hawk Above!

Tuesday, August 7th, 2007

Both the Last Dance and the Game Plan Groups I published a few days ago on this blog are holding up and are very strong, and I am sure quick traders have seized the opportunity. The stocks on those lists are the leaders.  I have said time and time again seek out stocks with recent strong earnings behind them.  For more details on the characteristics of the stocks to watch please see “The Game Plan for the Short Term” a few notes below.   

However (when one starts with a However you know the other side of the coin is coming), you may want to give some thought to a few other points: 

  1. Think about the potential IMPORTANT News that may be forthcoming on the very day you go for it.  Today is such a day, with the FOMC doing its song and dance.  The Nasdaq dropped over 30 points on the news, the DOW dropped over 120 points and sell programs came barreling in.  Then, just as quickly, they reversed themselves and were up as many points…a crazy volatile market, which we must get accustomed to.  We have had that for over 15 months now. 
  2. V bottoms are very rare patterns and one is far more likely to get caught in a retest of the lows. 
  3. Watch the internals of the New Highs and New Lows on strong up days.  Yesterday was putrid, and most would call it a Dead Cat Bounce.  It also happened to come off support at the 200-dma on the Nasdaq, which was a most likely call for most technicians. 
  4. However, to counter balance that, there is no question we are in a deeply oversold situation and there may be some low hanging fruit you can enjoy in the meantime.  We have not seen such a large number of “E – A” distribution for stocks since May of 2004, after the long run up in 2003.  Said another way, the A accumulation is at lows while the E’s are at highs, comparable to May of 2006 and other lows back in 2005, etc.   
  5. The correction so far has met the odds of a bounce back, i.e., you recall I taught you that 77% of the time the S&P 500 and for that matter the NASDAQ has held at an 8% minor correction.  That’s the good news and that is where we are at right now.  The bad news is if it breaks that level there is a further 11% chance it can hit 12% down on the S&P 500. 
  6. There is no question that good timing is everything, and the early bird who seizes the opportunity catches the fattest worm(s).  But watch out for the Hawk above, especially in such a Volatile Market.  As long as you trade with tight stops and raise your stops to preserve small profits and avoid automatic 8% losses, you will do fine. 
  7. Remember that “W” bottoms are more likely, so more cautious investors should wait a while to make sure a Double Bottom is behind us. 
  8. For those who want the market to prove it has bottomed and enter at a safer point, here are things to remember: 

a. Watch for a retest of the lows, i.e., a Double Bottom.  Then by all means look for the strong up day followed by the so-called Follow-Through-Day 4 to 10 days later. However, one must temper that with the tremendous Volatility we are now experiencing.  Down and up over 200 points within a day from day to day is becoming commonplace nowadays, so be careful, as we have now essentially experienced that three days in a row…between friends.  Don’t be too quick to jump in.   

b. Pounce quickly when the Market Index (NASDAQ) breaks through the short term declining tops line from its recent highs.

c. Wait at least until the 4-dma goes upwards through the 9-dma and preferably both go through the 17-dma, for confirmation that the ship has righted itself.  Use the 4a key on the Charting Module which is available with the HGSI Software.

d. For those who are even more cautious, we want the 17-dma up through the 50-dma, but you will be giving up a good deal of cloth on the upward rally.  That’s fine if it continues, but again you can get caught from being too slow on any retrace.

 That’s it for now.  Good luck and Best Regards, Ian.

Trailing Stops in Volatile Markets

Sunday, July 29th, 2007

Question:  I read that book “Trading for a Living” that someone recommended and it was good. He recommends a 2% stop, but someone on the board said to use a 6-7% stop… with 2% I keep getting stopped out same day, and with 6% it goes up a bit, but crashes back and I end up losing a bit. What kind of strategy can I use to overcome this problem? 

Answer:  You are not alone…the setting of stops in a Volatile Market as this is, leaves one frustrated more often than not.    It has been a while since I read Elder’s Book, but you need to look at page 260 again.  He was referring to risking no more than 2% of your ACCOUNT equity.  If you have a $100,000 account, then the most you should risk is $2000 on a trade.  If it is $20,000 then you can only risk $400 on the trade.   Let’s suppose you have 10 stocks of $10,000 each for a $100,000 account.  Now let’s suppose you have 500 shares of a $20 stock you can afford to set your stop at $16, lose $4/share and therefore $2000 total.  This is still only 2% of your total account of $100,000.  However, if you hit a bad patch and lose three or four of your trades in a row, and lose $8,000, then stop trading for the rest of the month.   

Now I am not suggesting for one minute you should lose 25% of your hard earned money on a trade.  You certainly should not sit around and let a 6%-8% loss turn into a 25% one before you act. I’m sure Elder never meant that as a standard rule for all trades.  The crafty Market Makers will invariably employ the spidery leg syndrome and swoop down and grab stocks with stop losses that are at around 6% down from the current price and then as quickly as you can say “Jack Rabbit”, they will trot back up again and cause those spidery legs you see (tails) on the end of daily stock prices.  That invariably happens at the start of the day.  The first tip is to try and stay away from such volatile stocks.   

The next point is that any stock that has lost 3% or more in a day is likely to go down further the next day, before it trots back up. Of course you need to watch the volume traded on that day.  if it is light then it may be that the stock is correcting in concert with a poor day in the market.  If on the other hand, it is a high volume day, then for sure you need to think about taking a stock off that is down >3% at the end of the day, and certainly if it is down 6%. 

There is generally two rules people use: 

1.  Support and Resistance Lines:  I’m sure you have watched Ron Brown’s movies on the HGSI Website, and how he always draws horizontal lines showing support and resistance.  Measure the distance from your expected entry point and either set your stop loss at just below that support or pass on the trade if it is too big a percentage to that support level.  In other words, you need to look for tight stocks and be very careful of loose stock patterns. 

2.  The second way is to use Average True Range (ATR):  You can do this on HGSI.  Most look to no more than 2ATR as the limit of their stop loss tolerance.  This then makes allowances for the volatility of the stock and therefore sets different levels for tight or loose stocks.  A tight stock by our definition is one that flies like the geese, straight along the 17-dma from lower left to upper right or an LLUR as we call it for short.  Try to find such beasts.  They are the best long term winners.   

Of course, if you have made 10% or more say in a matter of a few days to a week, and especially these days, then you should make sure to raise your stop loss to ensure that you don’t let a reasonable gain turn into a losing trade.  Again, you may play snakes and ladders with your money (see a note below for what I mean), but that is a caution that we are currently in a highly volatile market.   In the days of wine and roses, I used to say that each base was worth 25% and if you hit a home run you make 100% or a “hundy” as I call it.  Those days are gone for now…the market won’t let you make more than 10%/base for a home run of 40 to 50% maximum unless you are on a huge winner.  I switched thoughts to a Baseball analogy, but I’m sure you get the point.   

One last thought, if you made a little money on a good stock and it ends up taking some back to virtually a very minor gain, wait for the pullback to finish and then take it again.  Most of us fail to take another ride and on the second chance, it will invariably trot off into the sunset, leaving you behind waving feverishly to let you on.  Then like an unruly dog chasing fast cars you buy it far too extended and get whacked. 

Best Regards, Ian.

Copyright © 2007-2010 Ian Woodward
Disclaimer: Commentaries on this Blog are not to be construed as recommendations to buy or sell the market and/or specific securites. The consumer of the information is responsible for their own investment decisions.