 Ian Woodward's Investing Blog
Using the Kahuna, Eureka and Tsunami to Identify Market Tops
Identifying Tops and Bottoms in Market Indexes are always difficult. However the High Growth Stock Investing (HGSI) software has a unique set of indicators of unusual events in the ebb and flow of the market that give early warning to sit up and take notice. There are three such indicators which all use the proprietary Visual Filter Back Test (VFB) function which enables showing when a specific set of conditions is met. The appropriate color coding can be used to highlight positive and negative conditions with green and magenta/red, respectively.
The three indicators featured below are the Eureka, Kahuna and Tsunami as discussed briefly below. I have used the latest pictures for the Nasdaq to show how these proprietary Indicators were flashing red these past few weeks and should be followed as the days and weeks progress:
The Kahuna: The first unique indicator provides “one-day” snapshots of major up or down days in the market, i.e. Volatility, as depicted by the long green and red candles in the Price window. Those conditions are captured by the Kahuna Indicator which has four conditions depending on the extent of the 1-Day change in both Price and Volume. We use light green and dark green to indicate Little or Big Kahunas on up day and magenta and dark red to indicate the reverse, respectively. The value to the user is several fold in visually depicting the Volatility in addition to Price and Volume in the market. Clusters of these green and red bars give clues to market topping or the beginning of a new move, as shown in the chart below:
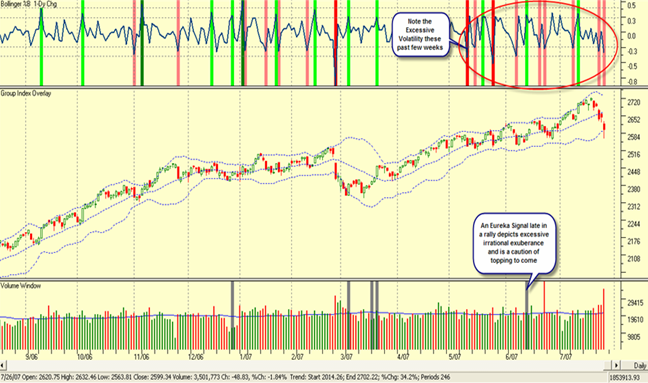
Note the light green, dark green, magenta and dark red in the window above the Price Window showing the various types of “Kahuna days” over the past year. When the bars are closer together that depicts heavy volatility and a sense that the Nasdaq Composite Index is running out of steam and may be due for a correction. This is apparent from Jan. to late Feb. and again in mid-May to July in 2007.
The Eureka: The second type of unique Indicator works hand-in-glove with the Kahuna and is called the Eureka. It is shown in dark grey in the Volume Window on the same chart above. The Eureka uses a totally different set of conditions based on the ARMS Index than the Kahuna, and is aimed to depict unusually strong accumulation, primarily at the start or continuation of a bull run. When green Kahunas and grey Eurekas appear closely in the same week it usually signifies the start of a new rally. However, when a Eureka signal appears towards the end of a Rally as it did in mid-June, it invariably signals caution of a potential correction to come. Please note that these Indicators can be placed in any window at the whim and fancy of the user.
The Tsunami: The chart below shows the VFB indicator being overlaid on the Price sub-window to show a particular market index condition identified and named as “Tsunami” by Ian Woodward. Tsunami conditions were met where you see the chart color coded green and magenta, representing a bull run or a correction, respectively. Once an Index like the Nasdaq has shown signs of choppiness, the Tsunami will first show alternate green and pink zones and then a long downdraft of pink denoting a broken Index.
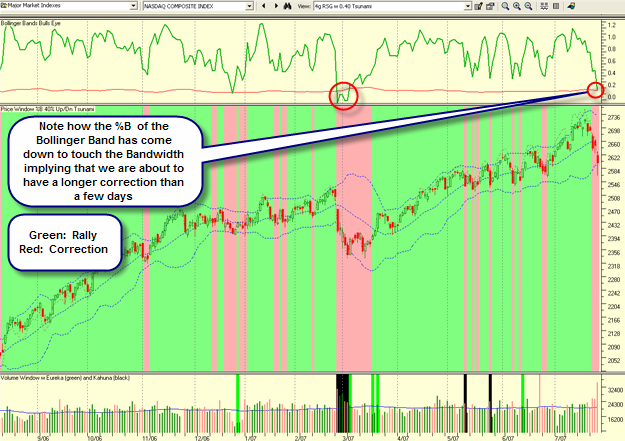
The Tsunami conditions that give the above visual effect are essentially triggered by the Index or stock falling below or rising above the middle Bollinger Band (BB) as shown in the above chart. Note that when the Nasdaq Composite Index is rising, it sits between the middle and upper BB and is shown in green. When the Index falls between the middle and lower BB it is shown in red. The panoramic “pictograph” immediately conveys the feeling of a rally or a correction in the Nasdaq Index and information to the user to either buy, or hold or sell depending on their investing style.
