 Ian Woodward's Investing Blog
Wolf Pack Correction or Rotation
A HGS Investor User is a trifle concerned that his recent stock picks are getting hit and was looking for a reason as to whether “it is shorting, profit taking, a full moon or what?” So I felt I would continue the theme of the past two blog notes and give a more detailed response of the factors to consider at Earnings Report time on great Leading Stocks.

-
Classic Examples: POT and MOS are classic examples of leading stocks moving into climax runs.
-
Climax Run: A Climax Run is defined as a sharp move up over the prior two weeks of at least 25% Gain after it has already had a decent long run. Invariably the shape of the chart is parabolic and the Index will always break the ascending tops line drawn from the previous two highs to the upside.
-
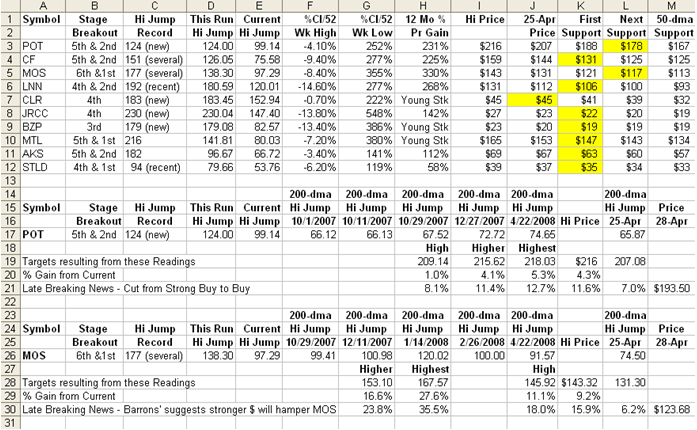
% Price Gain from 52 Wk Low: POT is 250% up from its 52 Week Low and MOS as much as 355%, hence they are badly extended and fat with profits. They are story book stocks with all the fertilizer mumbo jumbo, hence they have had halo as far as Wall Street is concerned, i.e. are darling hot stocks in hot Wolf Packs.
-
Vulnerability at Earnings Report Time: Such stocks will invariably go into climax runs just before Earnings Due Time, and it is usually better to take the gravy of a 25% added Price Gain than to sit through the Earnings Report, no matter how good it is on such stocks. Of course one can always buy Puts, but the risk of loss far exceeds that of a certain gain under these conditions. No matter how good the earnings reports, the stocks are invariably downgraded or targets for concern at such times. After all we went through this same scenario for the five horsemen of the previous top leaders…AAPL, BIDU, GOOG, GRMN and RIMM. GRMN is dead for now, GOOG is recovering and AAPL, BIDU and RIMM have recovered and on their way again. All had deep corrections, though exacerbated by the Bear Market Correction.
-
Analyst Downgrades after Earnings Report: On that last point, POT was cut from a Strong Buy to a Buy, and Barron’s had an article on MOS being impacted by a rising Dollar!
-
The High Jump Tool: Leading stocks like these two give a strong feel for their personality as they leave their footprints in the snow. Those are round words, but what I mean is that the High Jump and more specifically the High Jump from the 200-dma gives one a great clue as to when the stock is likely to correct. Time and again the stock will correct at a certain % up from the 200-dma ONCE it has established its high, higher and highest jumps. For POT that ranges from 66% to 75%, and true to form, it corrected this time at 65.87%. For MOS the range is 97% to 120% and it corrected at a High of 92%. In other words, the higher the Price Gain, the more difficult it is for such stocks to beat those footprints after they are ESTABLISHED stocks with a known pedigree and behavior.
-
Stage Breakouts: A further clue for caution comes from the # of Stage Breakouts from their low usually measured within the past year. A stage breakout is defined as one where the stock rises to give a minimum of a 25% Price Gain and then bases sideways in a tight pattern before it takes off again. The time of greatest danger is invariably at a 3rd and particularly 4th stage breakouts where somewhere along the line the stock will correct a minimum of 15% to 20% and then go again. If the stock has had a 25% correction or more, then the stage count can start again, but I like to keep the original count as well until the stock gives up the ghost.
-
Rotation or a
-
For Posterity Sake, I felt I would give full treatment to the numbers so that those who are new to the Principles of High Growth Stock Investing and specifically the value of the High Jump Tool will have a feel for what to look for in the future as to whether to Buy, Sell or Hold. If you examine the spreadsheet, I show you both the upside opportunity and the downside risk…without spoon-feeding you.
-
