-
Mailbag Comment: Ian – you stated that “Time and again the stock will correct at a certain % up from the 200-dma ONCE it has established its high, higher and highest jumps.” Would you mind elaborating further on this statement? I interpret this as meaning I should look for three successive high jumps, each succeeding one higher that its predecessor. When I use the 200 DMA high jump I look back several years and attempt to establish an average highest value among the series values for the period. Is this an incorrect application of the 200 DMA high jump? Mike
-
Response: Hi Mike: I’m glad you asked that question as I sense many have not fully understood the full value of the High Jump Tool or how to interpret what it tells you. POT and MOS are excellent examples when people can either make a super bundle or get caught for a big loss in profits in the fight over Fear, Hope and Greed, especially if they are asleep at the switch.
-
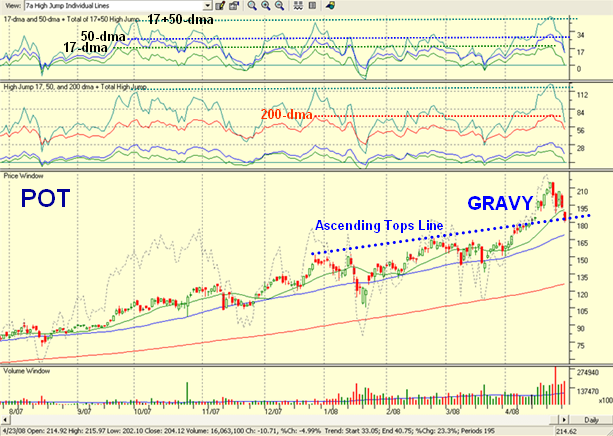
Let me give you the step-by-step answer of what I meant and in this case the devil is in the details on the chart, which I have since updated, to include yesterday’s Close and Low Price for both POT and MOS. In addition, I have included a chart of POT to show that the horizontal lines for the 17-dma, 50-dma, 200-dma and Total High Jump were all screaming TAKE THE GRAVY:
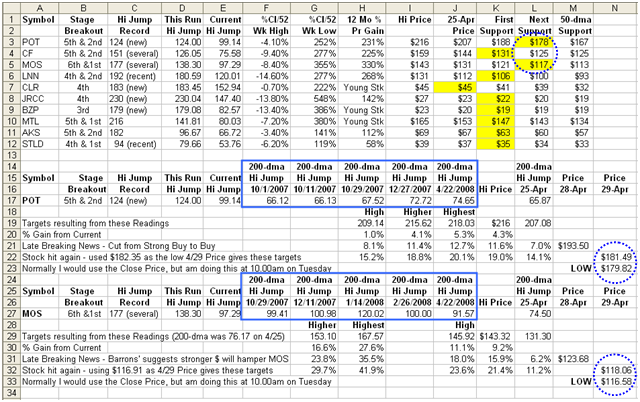
- I have blocked the 200-dma High Jump for several time frames for both POT and MOS as shown on the spreadsheet in blue above. In the case of POT, since it was VERY obvious that it was going into a parabolic extension especially with a gap up, it could exceed 72.72% for the 200-dma High Jump and produce a brand new High Jump record overall. It did get above 72.72% but only just at 74.65%. However, anything above 72.72% is extra gravy.
- NEVER use Averages of the High, Higher and Highest, as you will invariably sell too low and miss the gravy. That is why I call it the High Jump…it happens very seldom (remember the analogy I discuss of the Olympics?) It gives the best feel for when you are just being too greedy. Sure you can buy puts to safeguard yourself, but at Earnings due time coupled with an Exhaustion Gap Up and a Climax Run in the Stock, there is little point when the gravy is for sure going to get swallowed once the news is out. Better to come back in when the coast is clear. Buying Puts at other times is certainly a valid strategy to safeguard a move that one expects to continue. By the same token, don’t forget to use the limbo bar which is the lows as shown on the chart when it is safe to buy back in.
- As mentioned above, I repeat that in addition to using the total High Jump, it pays to see the patterns for the individual components of the 200-dma High Jump in particular and the 17+50-dma Combo as additional guides.
- Also, I always draw an ascending tops line as I said in my note from the previous two highs to visually see that the stock is headed into a climax run. That invariably tells me that I am in “super danger extension territory” and that I should expect that the PREVIOUS Highest Jump recorded is most likely going to be taken out. If the new record is SUBSTANTIALLY higher it suggests that this highest jump will probably not be exceeded for a long time from now on. That does not seem to be the case for POT right now, especially as the fertilizer story is not yet finished given the global requirements which keep growing. However, it needs to hold at support of less than 25% to 30% from its 52 Week High Close, which it has not yet exceeded, and is another reason for my showing that information on the spreadsheet. If it exceeds that, the stock has to regroup as did AAPL, BIDU, GOOG and RIMM have done from their recent correction, exacerbated by the Bear Market, i.e. a complete clean out.
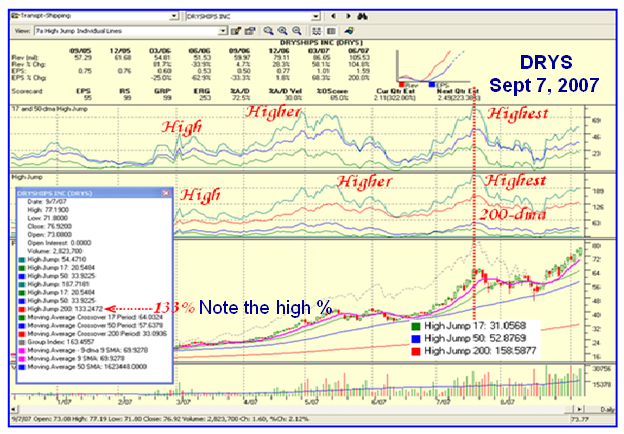
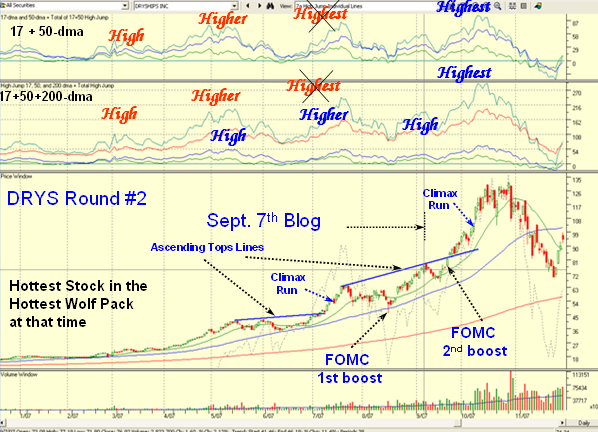
On the other hand, with regard to that last point of the new record being substantially higher, please see the reprise on Dry Ships (DRYS) below. I also strongly advise newbies and oldies to re-read my blog of September 7, 2007 where I gave complete treatment to DRYS at the time. For your convenience I show you the chart from that Blog note on Sept. 7 and then show what happened after that note.
Note that the stock corrected two days after that date, but with the boost of the FOMC actions it then went into a major climax run and peaked at the same time as all the Market Indexes, before a deep correction as shown below:
 Best Regards, Ian.
This entry was posted
on Wednesday, April 30th, 2008 at 4:42 pm and is filed under HGS Principles.
You can follow any responses to this entry through the RSS 2.0 feed.
Both comments and pings are currently closed.
 Ian Woodward's Investing Blog