 Ian Woodward's Investing Blog
The Santa Claus Rally May Encounter Moose Droppings!
I hope you have enjoyed the Santa Claus vs Grinch Battleground notes. Here is a further one in the series which has both a bright side and a strong caution should you be inclined to dabble.
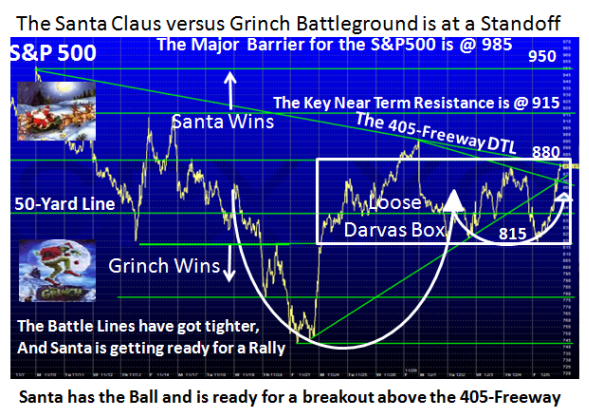
As you can see from the chart below, although there has been a see-saw these past five days since I introduced this theme, the technical picture is improving in favor of Santa, even though the Indexes have all worked in a Loose Darvas Box as shown. Note by the way the Nasdaq and DOW both have the same picture.
The good news is that the final reading on Friday finished right at the 405-Freeway Down-trend-line (DTL) and ready for a breakout on Monday. Although anyone in their right minds will tell you that this is no place for Type 4 Buy and Hold Investors to do a highland fling, at least early bird Type 3’s who have ants in their pants and are just itching to get over their withdrawal symptoms may risk a few bucks rather than go to Las Vegas and lose them at the tables.
Why on earth in all this Gloom and Doom would anyone want to dabble…albiet with high risk?
1. The Jobs report is the worst ever in mumble years and
2. The Big 3 Auto Bail Out decision is still not completed though rumor has it that the Lawmakers could vote as soon as Tuesday on a proposal being worked out this weekend to help save the failing U.S. carmakers.
3. Investors can expect little relief from economic data or corporate reports in the week ahead.
4. From a Technical Analysis viewpoint, the 17-dma, 50-dma and 200-dma are all pointing down STEEPLY. The S&P 500 Index is above the 17-dma which is at 850 and the 50-dma is at 936, which is 26.3% up from the Base Low of 741.
However, despite all that gloom which normally would take the market down to new lows and nearly started to do so, there seems to be a Line in the Sand at 815 which is the Bulls strong line of defense.
I made all the caveats above against being tempted, so play at your own risk, but you have to be glued to the screen:
1. Now those rooting for some form of Bear Rally are encouraged that at long last the Indexes have ploughed their way back to stand a chance of a Breakout above the key resistance at 880.
2. Realise that within all this turmoil there have been three Eureka signals recently albiet without Kahunas. The back-breaker to the potential rally that had started with these irrational exuberances was the 7 to 8% drop on 12/1/2008 shown in a dotted ellipse on the chart below.
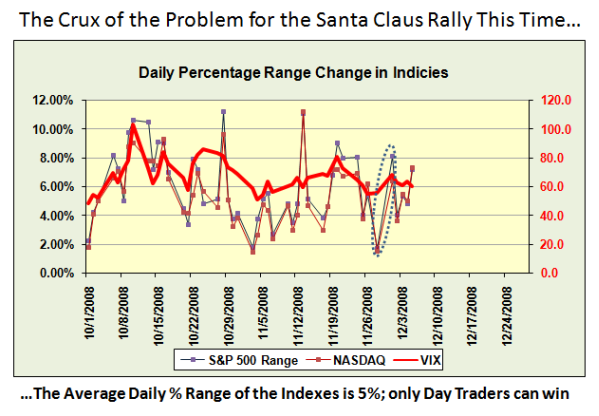
3. It would seem that ETF’s are the best way to go for now, and that has become the craze as evidenced by the unusual volatility in what would be considered reliable Indicators. These include the NYSE New Highs and Lows, Advances/Declines and Advancing Volume/Declining Volume parameters all confirmed with a VIX that has consistently stayed above 50 ever since the Indexes cratered.
4. All of this can be seen in one chart which shows the DAILY % range change in the Indicies together with the VIX since October 1. Note that the Crux of the Problem for this Santa Claus rally is the fear exhibited by this chart which shows the average at 5% (between friends) together with a VIX >50! No wonder we have such a loose Darvas Box!
5. I repeat again this ETF double and triple craze is probably distorting the usual Indicators mentioned above and until we see a substantial lessening of the fear by a drop in the VIX to below 40, we will not see these wild daily swings subside.
So the Short-Term Game Plan for the Bulls is simple:
1. Below 815, you’re outta here!
2. Above 880 look for a Rally to 915 and then 950, and then see how things develop. If you allow me a little poetic license, I estimate that at the current rate of descent by the 50-dma, it will be at 915 by next weekend, and the 17-dma will be flat to rounded up if the rally to 915 is achieved. Provided there are no 7% down days, the technical picture will look a lot better if the S&P 500 can achieve even a modest rally to 950.
3. Mark my words that the pundits will be proclaiming an Inverse Head and Shoulders Bottom and declaring the Santa Claus Rally is in full swing at 950! That Target is 28% above the Base Low, though only a modest 8% above where we are right now.
4. I note that several of you are brushing up on the HGS Investing Principles – The 405 Freeway blog note of Dec. 2, 2007, and I would say it is worth your while to learn those principles to see what could evolve. My good friend Charlie Hughes thought so back then, and you can print that chart back then as the gold standard.
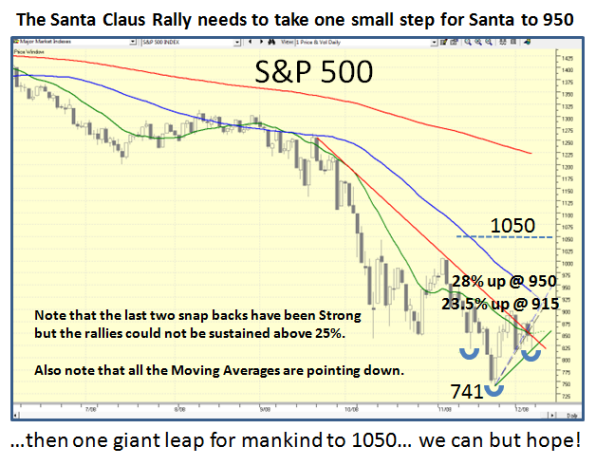
Please understand that 1050 on the S&P 500 is 40% up from the Base Low and that number is the best return from the Low to the End of past Recessions. Enjoy!
Best regards, Ian.
