Ian Woodward's Investing Blog

Archive for August, 2009

Is there a Chink in the Bear Market Rally?

Monday, August 31st, 2009

We are back in the mode of a sideways market with both the Bulls and the Bears looking
for any chink in the armor.  Today’s action of 0.81% down on the S&P 500 may be a mild
first shot across the bow for the Bears to pluck up courage and short the market again.

    cranes

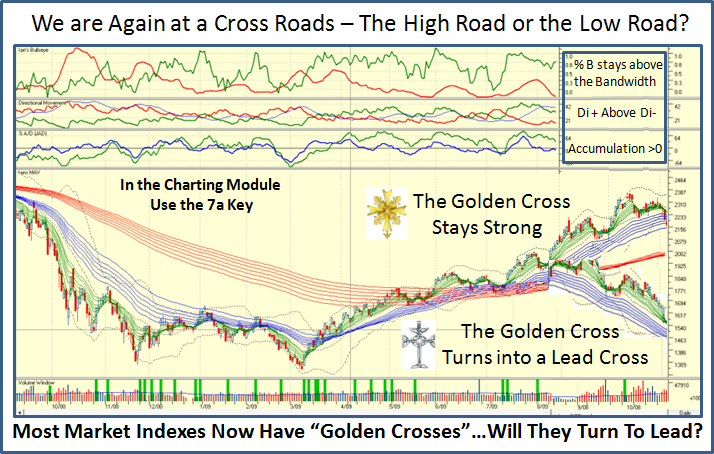
We are yet again at the crossroads of either making one more leg up for a >60% Cyclical
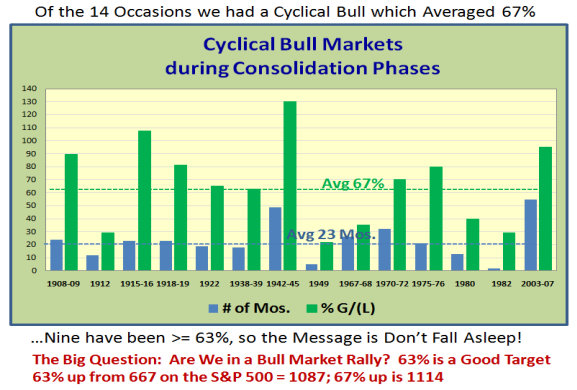
Bull Market Rally during a Consolidation Phase or making a Correction.  We are just 54% up from the Base Low of 667, and since there have been nine previous occasions where the rally has been >=63%, we must stay alert for a next leg up…against all odds as it would seem.

    cyclical

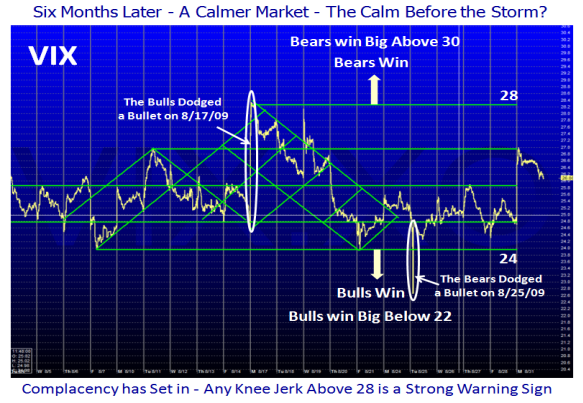
We have come a long way since the hectic volatility we suffered back six months ago.  The VIX, which is the best symbol for the Fear Index, has been dormant but has made alternate spikes during the past two weeks where both the Bulls and the Bears have dodged a bullet:

   vix

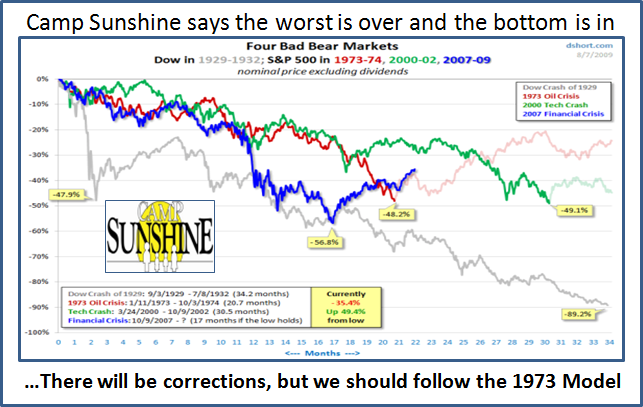
What then are the realistic expectations for the upside scenario?  The bigger question that finds the pundits in two camps, Sunshine or Gloom & Doom, is “Are we in a Bear Market Rally, or is this the start of a New Bull Market, in which we have already bounced 54%?”

I used the following chart 2&1/2 Years ago to suggest we were long in the tooth at that time, since it was then over four years since we had a Big Correction, and subsequently with the help of the Hindenburg Omen Indicator we were able to pinpoint the top:

  nasdaq

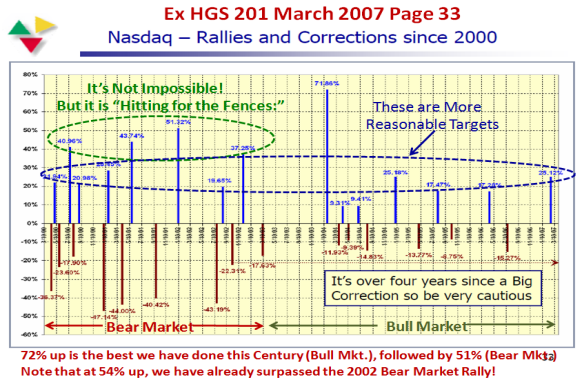
72% is the best we have done this Century when we came out of the 3 year Bear Market from the Technology Bubble.  So take your pick between 63%, 67%, or 71%, but before we even comtemplate that we need to get past 1035, and I would be very leary this time if we trot up to 1050 – 1070 (57% to 60%) in a hurry.  That would strengthen the Bear argument that:

1.  September is traditionally a bad month in the stock market
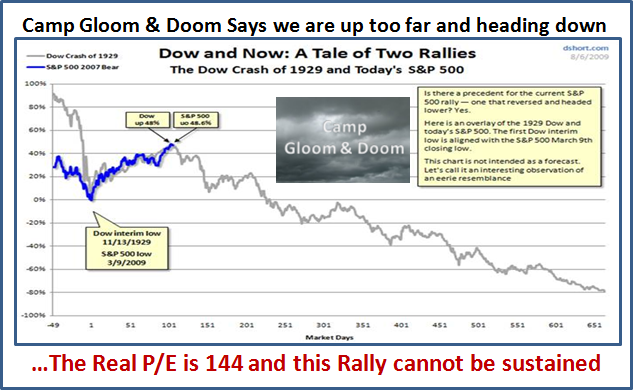
2.  This Market is moving on fumes which cannot be supported by the Fundamentals
3.  China is already showing signs of weakness, which in turn is reflecting on the US 4.  The market is very event driven; it only takes a negative surprise to bring it down

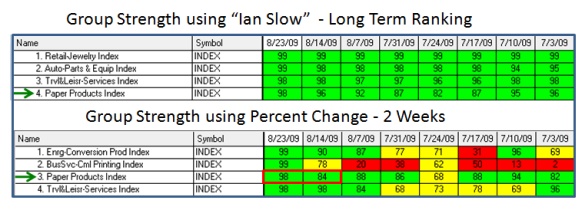
This time, I would prefer to leave you focused on three recent topics which relate to the
internals of the market to guide us as to the current health of the market.  Then let the
market show us which path it is on by either confirming or denying the results we use for the Signposts, Stakes in the Ground and Measuring Rods.

   gorilla

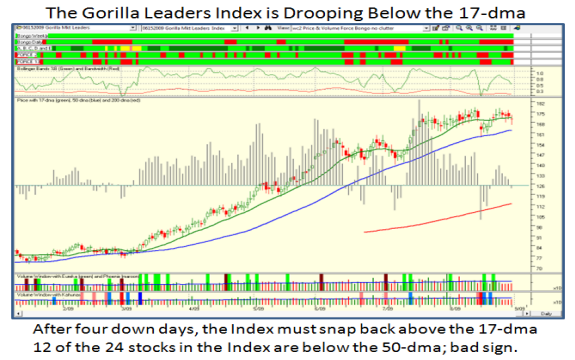
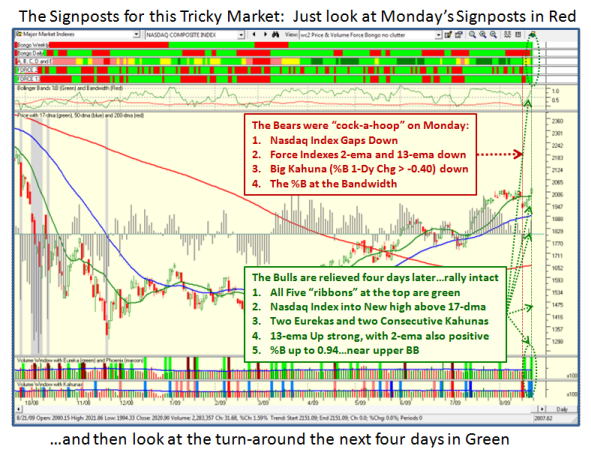
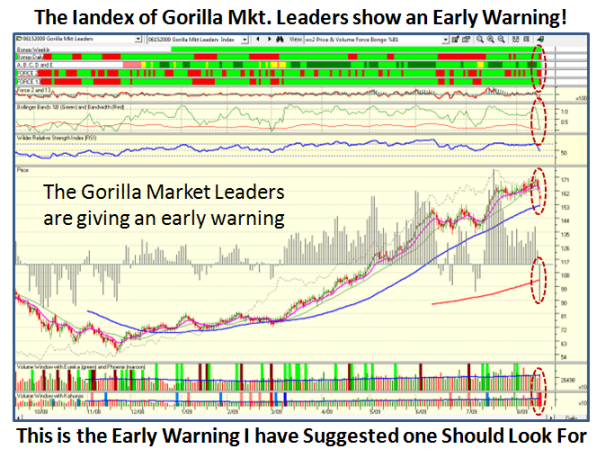
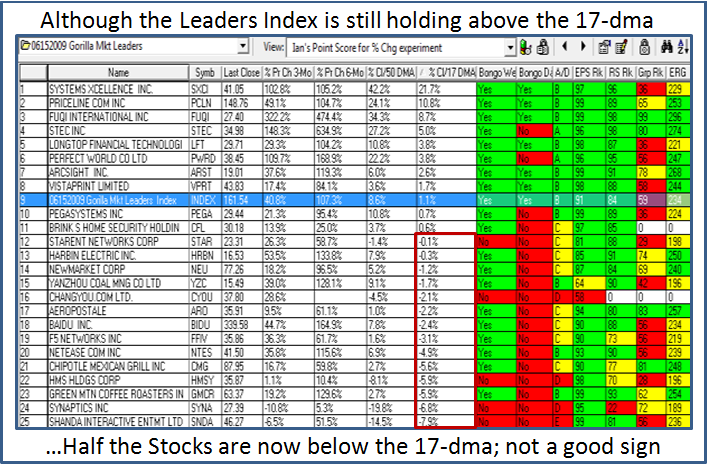
Net-net: Weakness:  The comments on the chart give you the key items to watch.

  abcde

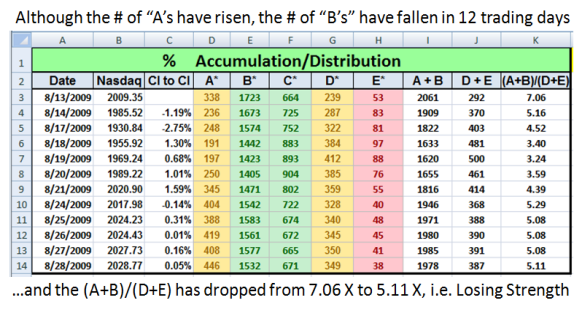
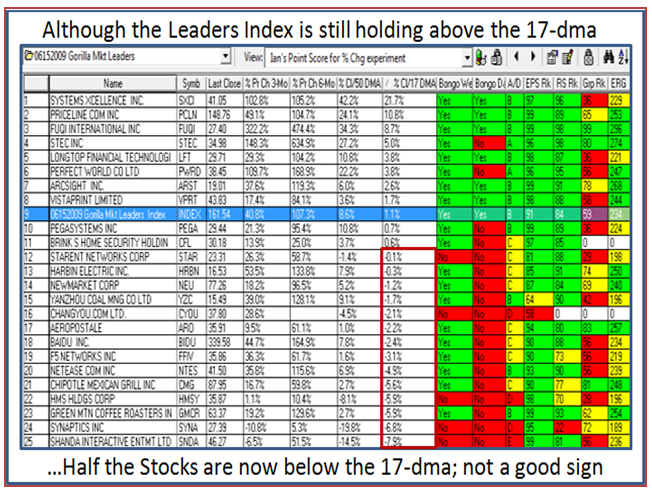
Net-net:  Holding but Weakening.  Watch Ron’s “Ic” key which shows that the “All 50%
Institutional Ownership” Index is holding.

Now I turn to two charts to feature the Phoenix Indicator which is the signal for Irrational Exuberance by the Bears as they left their footprints in the sand in 2002-2003, and how it looks now.

  2002

  2008

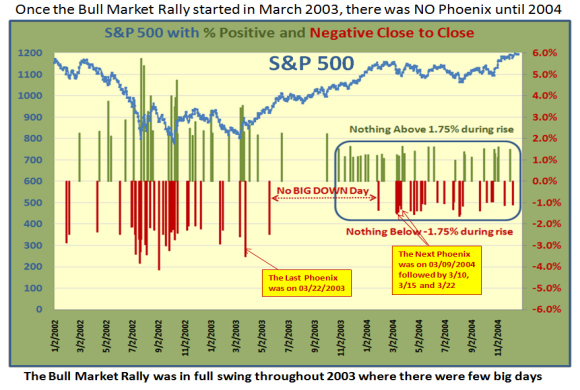
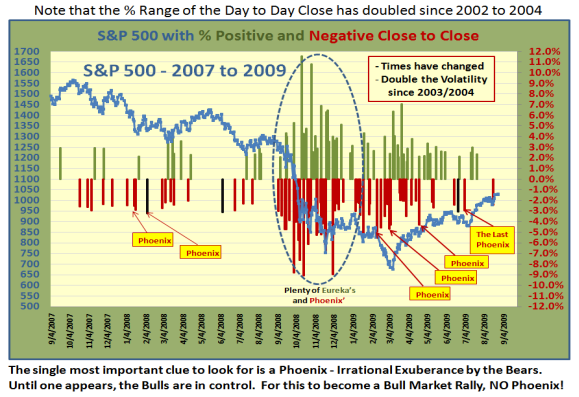
Net-net:  The short answer is we do not want to see a Phoenix, or if we do, it must
immediately be trumped by an Eureka signal soon thereafter.  I am glad to see that customers are beginning to understand the value of these two indicators, and how to use them.

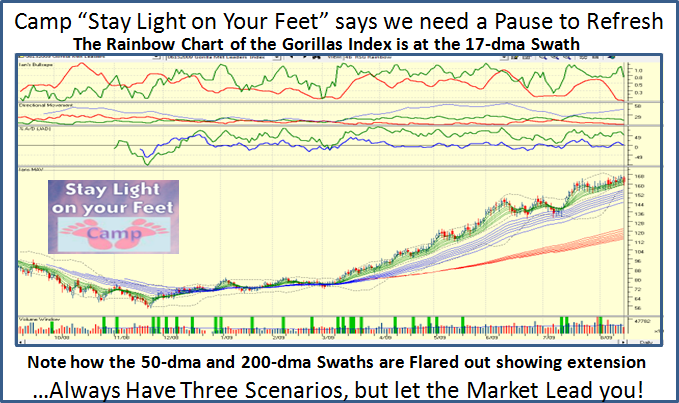
The Bottom line is to be in the Light on Your Feet Camp and act accordingly.  Thanks to those who have recently signed up for the seminar – we have seven weeks to go and if you are coming we would appreciate you signing up as quickly as possible.  It does help us with the planning at this end.

Best Regards, Ian.

Ignore the Fog and Follow the Signposts

Sunday, August 23rd, 2009

This Stock Market is Long in the Tooth.  Be thankful for small mercies…It could have been
a lot worse if the Gloom and Doom Camp had their way last week.  After Monday’s big
down day they were cock-a-hoop and then the Market turned around and here we are in
New High Territory again, with the Rally intact for now.

horse

As I reminded you in a couple of blogs ago, Don’t forget there are always Three Camps:

        a.  Camp Sunshine
        b.  Camp Gloom and Doom
        c.  Camp Stay Light On Your Feet

There is a time to be in each one…right now “Light Feet”.  Nimble is our trump card.  Always remember that although most are wondering that there is only a narrow set of stocks of High ERG quality that are showing Leadership in a Market such as this, there is another approach to High Growth Stock Investing and that is to spy recent EARNINGS Momentum.  That coupled with the wind at your back, i.e., Wolf Packs that are moving, can provide ample opportunity for short to intermediate term gains.

I must say that I am very surprised that there is NOT ONE mention on the bb that we have had two Eurekas and umpteen Kahunas last week to understand there is still strength in this Rally.  Now of course there can be a Bull Trap as the pundits will point to a double top if the break out does not materialize and fizzles this coming week (say).  Likewise, there isn’t one of us who doesn’t realize that from a FUNDAMENTAL standpoint this market is running on fumes.  Also, the Junk off the bottom theme has taken hold in the minds of the thoroughbred Growth officiandos that has left them gun-shy and mainly sitting out. 

Like my good friend Aloha Mike Scott, I endorse that he said  the “HGSI software is great for  cutting to the chase quickly”.  So let me cut to the chase and show you that of all things, Paper Products is the Hot Industry Group of the moment, and it seems there has been ample evidence as to why.  I will admit Paper Products is not the most glamorous of Industry Groups, but we all do understand that if you want to make money in the short to intermediate term while using our core principles, the following process helps to stiffen our backbones.  Some of the Stocks are extended, but watch the Wolf Pack for Opportunities :

1.  Is the Wind at our back…Market, Market, Market (MMM)?
2.  Which Industry Group stands out with the Rel Strength Momentum: Wolf Pack?
3.  Which stocks in the Group Have EARNINGS Strength and/or Earnings MOMENTUM?

chart

group

wolf

Well that is the process.  Whether this particular Group stays strong from here is to be seen and is in the lap of the gods.  At least you now know the value of “Box 7 Stocks” for finding Wolf Packs when the Growth Stocks are pausing to refresh.  It is a proprietary feature of the HGSI software.

For those who are curious as to where to find that last chart, I cut and pasted the Earnings rows for each of the stocks listed with data from the Charting Module.  This made it easy to make my point of the huge Earnings Growth in the last two quarters.  That is key.

Best Regards, Ian.

A Follow up to Late Breaking News!

Tuesday, August 18th, 2009

Ian,

Thank you for the blog. Would it be possible to post a list of the symbols … am having a difficult time getting some of the symbols right due to shadows? Also, would be handy to have a link to the blog included in your update notice.

Thank you.  Earl

Hi Earl:  You have been a faithful follower of the HGSI bb and teachings for ages.  I know you won’t mind a leg-pull if I say you are behind on this one, as you should know better than that I would leave you guessing.  It is one of the “Articles of Faith”  all HGS Investors know of what to do at peaks.  All you had to do was scroll down to the blog preceding this one and you would have found a more legible list of the identical stocks.  Here is that snapshot:

#1

But you should know that I would have been posting this list earlier and right before your
beady eyes if you dared to go back a couple of months, I posted the good stuff again and
this time with the list of symbols listed at the bottom, because someone sitting out in
Israel couldn’t read the original list:

       #2

Now to answer the other questions:
 
1.  You will note that in this last list ONLY one stock, ADY, has been dropped.  Realize this
list was displayed two months ago on the June 16th blog, and for some rhyme or reason
ADY got hit hard and never recovered, so it was an “oddball”.

2.  I did not remove it until we were assured that the MARKET was on a new leg up.  It
would defeat the purpose of the Leaders List.  Do NOT change the list as you would have
removed the “Stake in the Ground” and your “Measuring Rod” would be useless.

3. We usually change the list and produce the RonIandex as it is now called at the Seminars. 
A couple of years back it was the JIRM list of >$35 and <$35, which served us for a while.  It
is one on the exercises the attendees look forward to participating in, as then they have
skin in it.

4.  The list can be used in two ways:
     a. Its primary purpose is to give an early warning sign of a Rally top and correction.
     b. Its secondary purpose is to buy the very stocks on the list as they are the leaders.

5.  It all depends on your stomach as to whether you do item 4b.  I have two such instances
where it paid off handsomely.  The most recent one is when one of the attendees said he
bought a few stocks on the Monday morning of the seminar and had made enough to return
to five more seminars.  The other occasion was at the last Telescan Seminar I gave in Houston in October 1998, where a Doctor out in Hawaii had friends who attended that seminar and the list was already in his hands before I got back to L.A.  They again made out like bandits.

6.  The more important point is that these hand-picked stocks are in several Industry Groups
and are the best of the best from March 13, 2009.  You can tell this by using the new percent
change feature in HGSI, which will be another feature we will cover at the Seminar.

Best Regards, Ian.

Late Breaking News…Read All About It!

Monday, August 17th, 2009

When I was a young man still in College in Jolly Old London, I used to pass a
Newspaper Man selling his three Newspapers standing at the corner of Holborn
Tube Station and shouting out “News, Star or Standard…read all about it!”

           roller

Since this is an Educational Blog to help you Protect the Money you make and
hopefully learn to Make More Money (MMM), I felt it important to give you a
heads up before the News got stale and to show you the value of this trick.
Always Watch the Leaders to give you the earliest clue of the possible direction
of the Market.  They are fat with profits and are the first to get hit hard.  Today
was such a day.   If you do not have this list of stocks in your Users Group in the
HGSI Software, you are flying blind.  Take the time to enter the symbols into a
Users Group and watch the Index every day.

I show you two quick examples, one from two years ago at the Top of the Market,
which I used in the October 2007 Seminar, and the other fresh off the press which
is today’s “Read All About It!” The markets were down around 2.0% to 2.84%,
while the leaders dropped a hefty 4.39%.  Of course that is just one day, and can
only be considered a shot across the bow at this point in time, but watch their
behavior and see if the first chink in the armor turns into a massive tear:

hgs 701

leaders

A Picture is worth a thousand words, so here is what all the fuss is about:

wc

To be fore-warned is to be fore-armed.  The Leaders Index is at a critical juncture. It must bounce back fast or the rally is over for now.

Best Regards, Ian.

Three Camps, Three Road Scenarios

Saturday, August 15th, 2009

I have always taught that it is imperative to have three scenarios identified and to then let the Market lead you to which one to be on.  Wishing for your pet scenario seldom works in the stock market and those who constantly can anticipate being on the right side are gifted as there are few of them.

I was struck by an excellent article written by Jay Kaeppel of Optionetics.com who thinks in a similar vein and I felt I would take a leaf out of his book as I liked the  way he described the “Three Camps” that people can be pigeonholed in as to their investment sentiments.  He sugested “Camp Sunshine”, “Camp Just You Wait” and “Camp Go with the Flow”.  I took his first one, but changed the other two to suit what I have taught you before now, and here it is:

camps

In scouring the web, I found an excellent site called dshort.com where I found the following two charts to describe the first two camps of Camp Sunshine and Camp Gloom and Doom.  They are self explanatory, so I need say no more than show them:

sunshine

gloom

The third camp of Stay Light on Your Feet, is the one I suggest you stay on and I cover
the rationale in the next two charts below.  Always watch the Gorilla Leaders:

light

warehouse

It is important to review what has transpired this past month in the continued rally of 17% since the last minor correction which ended in early July:

1.  We are now over 50% up from Low to High on Most Market Indexes
2.  The Golden Cross is now behind us whether you are in the dma or ema camp
3.  But now we are once again at the crossroads, since the Golden Cross can either stay solid or melt down into a Lead Cross.

golden

For it to continue upwards, three items must remain solid, otherwise it’s curtains:

a. %B of the Bollinger Bands stays above the Bandwidth, and preferably above 0.7
b. The Di+ must stay above the Di- of the Directional Movement Indicator
c. The Accumulation %A/D must stay above “0” and preferable above 20%

There is little point in my covering chapter and verse on the upside since the targets are obvious…breakout again above 1018 on the S&P 500 and head for the 50% retracement level of 1119, as shown in a previous blog.  Remember, this is feasible given the Volume Vacuum the Black Swan afforded us on the way down in October, which now presents us with an opportunity.

I have updated the  Downside Targets I gave you in an earlier blog.  Please don’t  misunderstand my intent as the glum and happy faces are there to make a point. They show how far away we are from meeting the target, but also with a rotten scorecard as this, the contrarian opinion would suggest that good times are coming soon.  It reflects the degree of extension by the current rally.  It also suggests that until most of these are met, it is HIGHLY UNLIKELY we will suffer more than another Minor Correction.  The Targets therefore represent a complete swing from Bullish to Bearish, which after all is a Gloom and Doom Scenario:

targets

Best Regards and Stay Light on Your Feet.  Ian.

Copyright © 2007-2010 Ian Woodward
Disclaimer: Commentaries on this Blog are not to be construed as recommendations to buy or sell the market and/or specific securites. The consumer of the information is responsible for their own investment decisions.