What Goes Up, Must Come Down…But Not This Time!
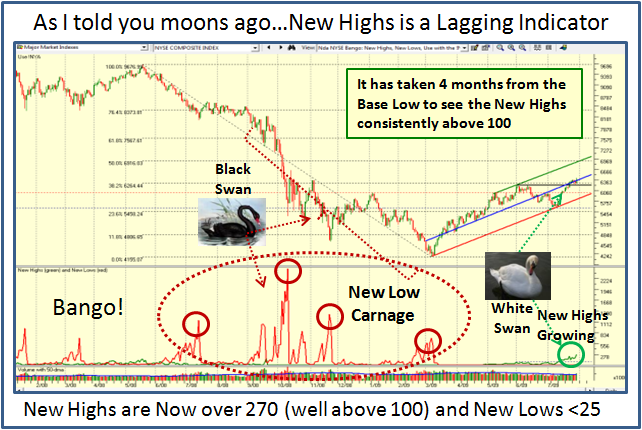
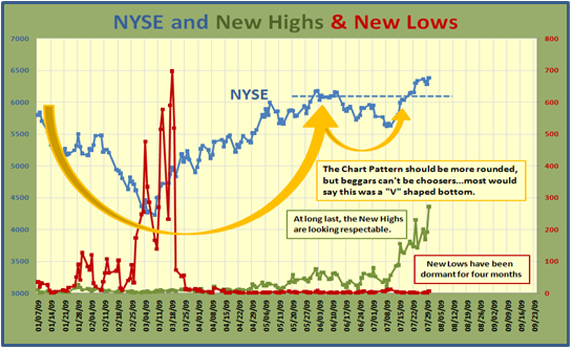
Saturday, August 8th, 2009My good friend Ron Brown puts it so well in his Weekly Free Movie…”Some of the major market indexes are out to new yearly highs, but the NASDAQ, the former leader is beginning to lag. Can the markets keep up this torrid pace? It’s doubtful without a pullback to digest the recent gains.”
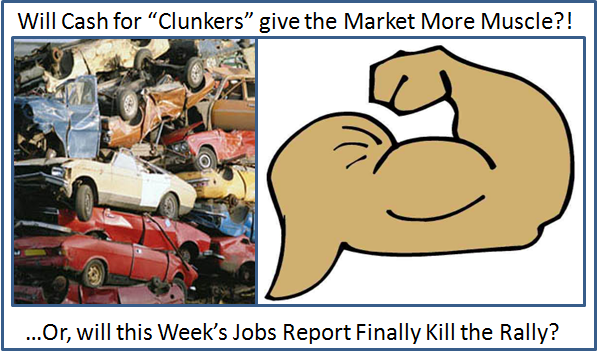
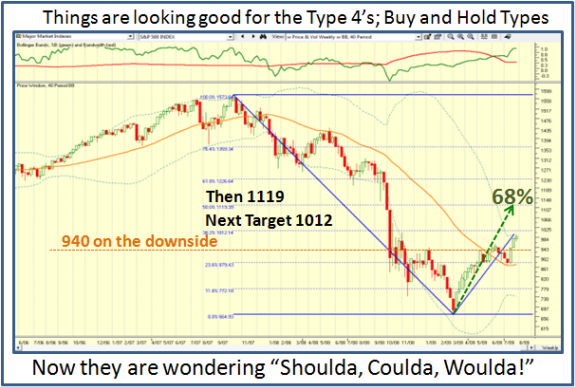
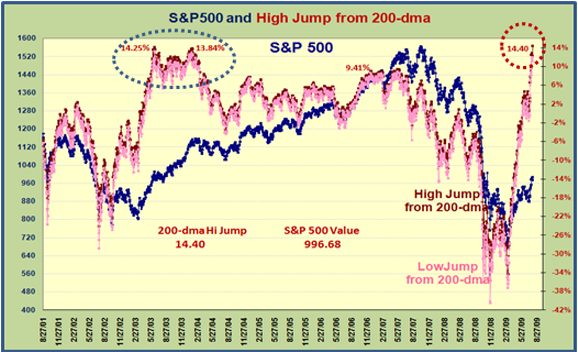
I had a Picture ready to go, but my friend, “Paxen”Mike Scott sent me a better one that describes the mood very well, so you will forgive me for showing both together as they both tell a story. If you are a Type 1 and 2 trader, you can switch from Bear to Bull in a wink, a trifle disappointed but seldom hurt too much.
Type 3 Swing Traders scratch their heads and realize they were fooled and should have stayed on the long side, or keep rubbing their hands which is always fatal. If only the herd can find the right balance between Fear and Greed. However, the rally was saved by the Jobs Report, the Bears had to cover their shorts as they found they were in a short squeeze ONCE AGAIN.
Type 4’s, Long Term Buy and Hold now see that they have all the required longer term criteria in place, and wondering why they shoulda, coulda, and woulda earlier. However, at this stage they are playing with fire and would be prudent to wait for a pullback before they go for it.
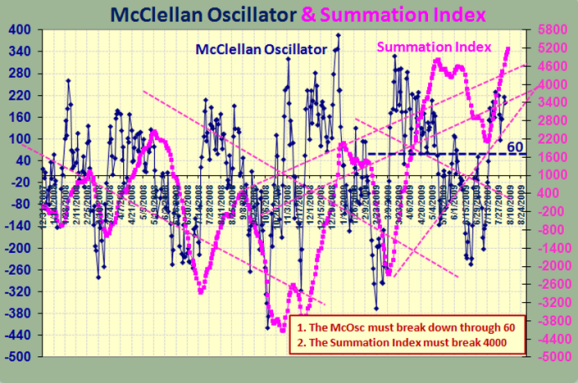
I am again indebted to my friend Ron Brown for keeping my head on straight in this seldom encountered type of rally. I have long been a believer in the McClellan Osc and Summation Index which my other friend, Aloha Mike Scott has made me focus on for the past twenty years, so I had already seen the phenomenon. I digress, but here is the late breaking news which Ron sent me from Sherman McClellan himself in two recent notes, which give the Technical and Fundamental Reasons as to why:
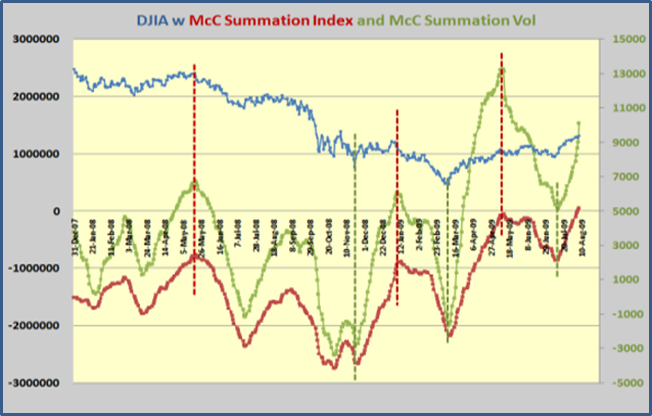
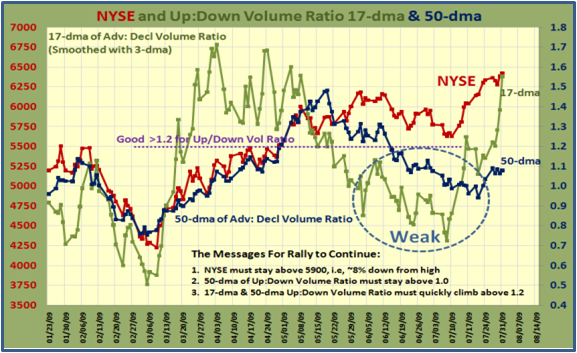
“…Bear Market rallies do not display the sustained power that is showing now with the higher Summation posting. When the Summation tops out in this move that may lead people to think that the bear market rally has been completed, but it would be very unusual for the price move down to be anything other than a consolidation of this initiation thrust.” Type 3 and 4 Investors should take good heed of this point.
“…It only takes a look at the data from the St. Louis Fed to see that the past year has given us unprecedented money flows, economic outfall and FED creativity. The US Government has dispensed exorbitant amounts in Clunkers rebates, TARPs and TAFTs and twisted CEOs arms and other body parts to ameliorate societal discomfort. Fortunately the Summations do behave differently in Bull and Bear markets. It is that difference that I was trying to point out. While the economy and its operatives may be in an outlier situation, the Summations are telling their story using the same pictures they have always used to identify bear to bull trend reversal. Sufficient liquidity does produce results.” Here are the Results he refers to:
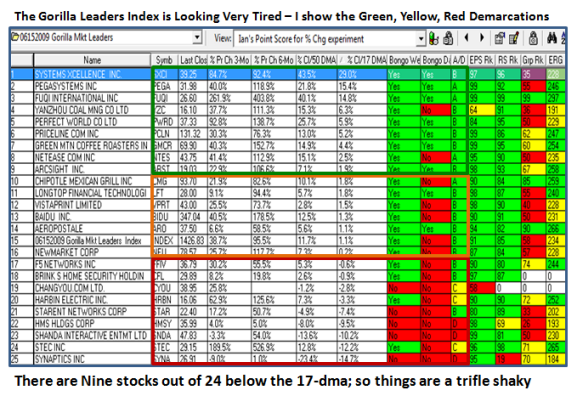
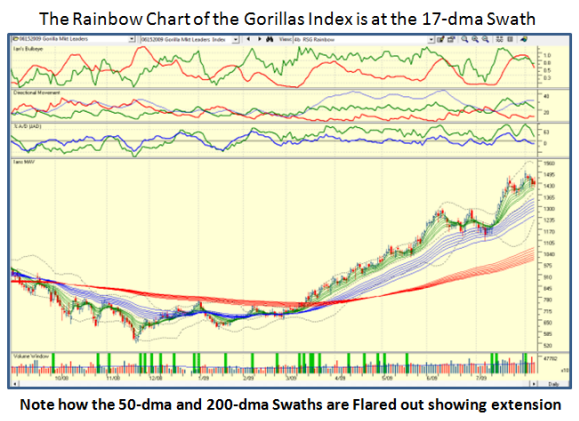
Given the above, I strongly suggest that those who look for comparables that you do your research with 1996, 2003 and 2009 to look for similarities in the force of this Index. Now to take care of my High Growth Readers – there is no better old faithful than the Gorilla Index I have posted several times before on this blog. I show two pictures, one of the numbers and the other of the chart. Don’t quarrel with me as to where I placed the lines of demarcation. The only message that matters which we can all agree on is the Index is looking very tired. Since these stocks are FAT with profits they will get hammered as many have already. However, look at the % Pr Ch 6-Month column to see the great gains for these stocks, despite those they have already given up.
I will save the rest for the HGS Investor Newsletter that is due next weekend, but I have another piece for you called “A Case Study in Learning Your ABCDE’s” and Ron and I will unfold additional factors to look for as to when you should feel the Rally is confirmed to be broken. Then we will look for new upside clues to start the process all over again.
Meanwhile, pay attention to the above and don’t let the pundits sway you with what the Market should do. It’s far better to let the market tell you what it is doing, and make your decisions accordingly. Powerful corrections and rallies such as those we have endured the past year will invariably overswing the pendulum beyond that reasonably expected, so don’t count your chickens before they have fully hatched.
Best Regards, Ian.
 Ian Woodward's Investing Blog
