How High the Moon? – Use High Jump Tool!
When there is a chorus saying “It can’t possibly go higher”, the Market confounds us and it does. At times like these we see the gurus bringing out their trusted tools of Gann Wheels and Chart Patterns from the past such as the latest one to hit the airwaves of “Three Peaks and a Domed House”, and eventually it comes to pass. In the meantime, the Market continues to go up, and those shorting the market find themselves having to cover time and time again.
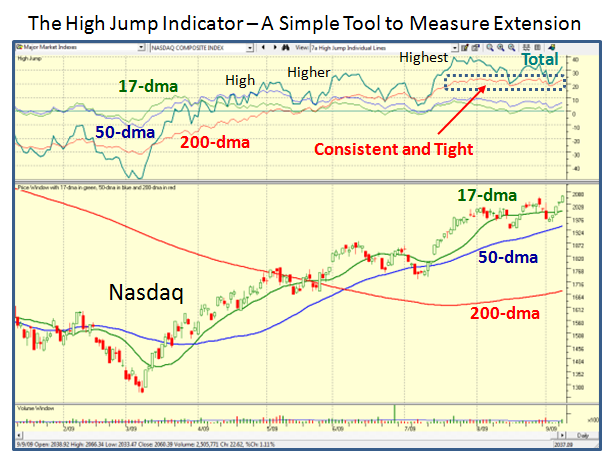
I prefer to use a simple tool which I called “The Ian High Jump Indicator” – © Ian Woodward. The concept is to look at a panoramic picture of how the stock has behaved over time relative to the extension from the 17 Day MA, the 50 Day MA and the 200 Day MA – the very yardsticks we use to decide when to buy and sell stocks using moving average crossovers. The HGS Investor Software program (HGSI) provided by Industry Monitors incorporates this feature in its Charting Module, so it plots it for you. They also provide the individual extensions and the High Jump numbers in the Fundamental Ranking Module, so that these are all done automatically for you.
You might wonder why I call it the Ian High Jump Indicator. If you look at a panoramic picture of any stock or any Market Index, it is an interesting fact that at certain times in a stock’s drive up from its base low, the stock or Index will invariably come to rest at the same peaks and valleys. These peaks are rarely beaten and more importantly, are at around the same level though they may be reached three or four years apart. We all know that the world record for the High Jump is 8 ft. & 1/2 in. and the chances of that being exceeded are small, except when the Olympics or World Track and Field meets occur. In other words, they are difficult benchmarks to exceed. The same occurs with stocks and Market Indexes when it comes to the degree of extension over the years. They usually peter out at around the same levels; usually one can see three, which I call High, Higher and Highest. Understand that these highs do NOT mean that the stock is about to “die”; but it does mean that the stock is about to correct.
With that introduction, here is an exercise that gives us reasonable boundaries of extension for the Nasdaq Index.
1. What is the highest jump from the 200-dma since 2000? The answer is 24.5%.
2. When did that occur? Back in 2003 around September 18.
3. How many times did it exceed 24%? Three times back then.
4. How long did it consistently stay above 20%? From 8/29/2003 to 9/23/2003 and again from 10/3/2003 to 11/7/2003 (with just a few days below 20%) when it went from a high of 1813.82 to 1992.27 for a further gain of nearly 10%. The bottom line is that if this market trundles along and surprises everyone, it can meander its way for another 10% up.
5. Where is it now? 23% up on the 200-dma.
6. How often has it exceeded 24% during this rally? Once, on 8/28/09 when it reached 24.04%
7. How consistent has this drive been from the 200-dma? Since 7/23/09 it has stayed in a range of 18.47% to 24.04% (on 8/28/09), which is very consistent.
8. If there is to be another top what should we look for? A Total High Jump of 40%, the 200-dma over 24%; the 50-dma at 10% and the 17-dma at 6% (BETWEEN FRIENDS). Can it go higher? Of course, but let’s first take one small step for HGS Investors.
9. Where does that put the Nasdaq at that time? The 200-dma is currently at 1679.13, so 24% to 25% up from there gives us 2082 to 2099 (say 2100, between good friends). It hit 2084 today.
10. Does that mean the Market dies there? No, but it should correct, especially if it reaches 2100.
11. How big will the Correction be? NOBODY Knows…don’t let fear take you out. What does the High Jump tell you:
a. If it corrects to a 200-dma reading of 18.47%, it will go down to 1989, or just below its 17-dma. I am sure you will recall that all Great Leaders rise above the 17-dma. No panic at that stage since if it even reaches 2100 that would be about a 5% correction.
b. 8% down would take us to 1932, which is just below the 50-dma and is currently at 1941, so just below. Again, no biggie, but the Bears may now be in control, and out will come the hue and cry that “I told you so” and we are headed for the deep correction that the Gloom and Doom Camp have been touting for ages.
c. Anything worse and they are correct as the sentiment will change from Bullish to Bearish.
The bottom line is that there are many ways to get your arms around this beast, but at critical points in time, there is no simpler and better tool to guide you than the High Jump, WHEN THE INDEX HAS WORKED IN A TIGHT RANGE.
12. Lastly, I specifically chose 2003 since that is the current best Measuring Rod. It can go on up for three more months if that is any guide.
Where am I…In Camp Light on Your Feet for now. It’s not difficult.
Best Regards, Ian.
 Ian Woodward's Investing Blog

