Ian Woodward's Investing Blog

Archive for December, 2009

Using Chaikin’s Money Flow for Snakes and Ladders

Tuesday, December 29th, 2009

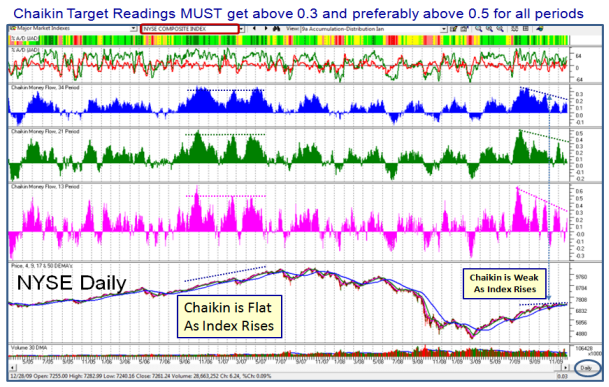
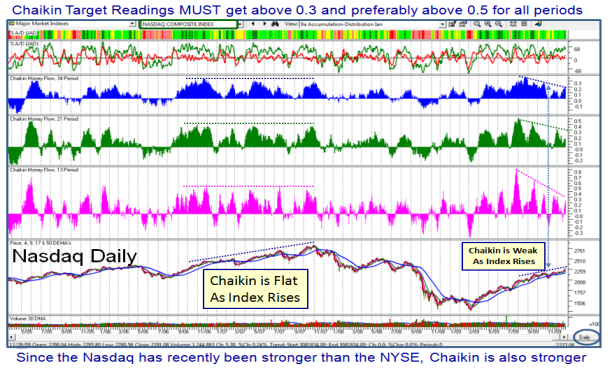
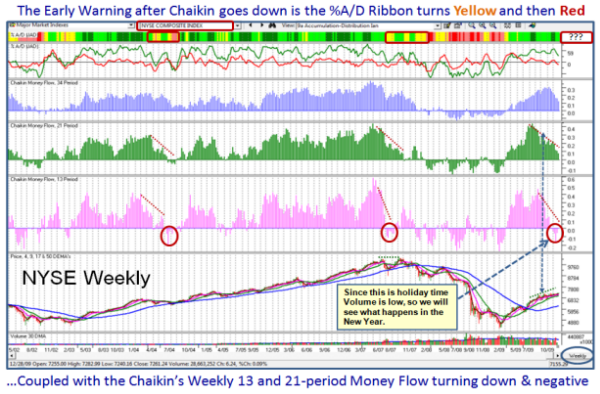
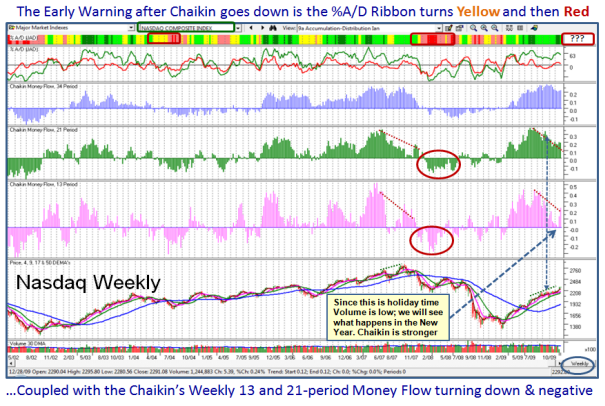
A Happy and Prosperous New Year from the HGSI Team to you with a gift for the New Year. In my last blog which gave you a smorgasbord of goodies to watch in the New Year, the one that stood out like a sore thumb was Chaikin’s Money Flow.  So with my Partner Ron Brown’s help, we came up with the following four snapshots which should keep you on your toes in the New Year.  I modified the 9a Key View on the HGSI Software Charting Module to include two other periods besides the standard 21-Period.  They are the 13 and 34 Period.  Ron and I felt that the 50 period was too slow and didn’t add any information.  Just make two new windows and change the 21-period to 13 and 34 respectively and color code them differently as shown below and you are done.  Make sure to select “histogram”. 

Shown below are both Daily and Weekly Views for the NYSE and Nasdaq, making four snapshots in all.

           nyse daily

           nasdaq daily

           nyse weekly

           nasdaq weekly

The bottom line messages are straightforward:

1.  Since the Nasdaq is the Strongest watch it first; then the NYSE for a breakdown below zero

2.  With a correction to the downside, Chaikin will go Negative on the 13-Period first, then the 21 & 34

3.  Early Warning after Chaikin turns negative is the %A/D Ribbon turns Yellow and then Red

4.  Chaikin Targets for the Upside Scenario are above 0.30 and preferably 0.50 for a continued Rally

Best Regards to you all, and may all your trades be strong is the sincere wish of your friend, Ian.

A Review of Stock Market Internal Factors

Sunday, December 27th, 2009

As we enter the New Year, I felt it important to show the current status of the various
Internal Stock Market Factors we review from time to time and to show the strengths
and weaknesses at this juncture.

picture

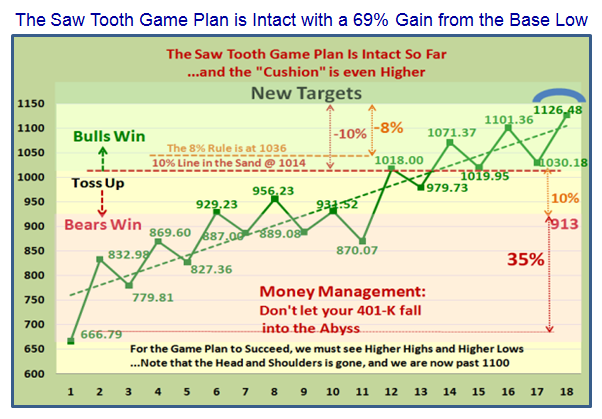
The Saw Tooth Game Plan I introduced nine months ago is still intact and up 69%:

saw

This Rally is now 69% up for the S&P 500 since the Base Low in early March 2009, so
with the Year End Bonuses at hand, the “Composite Man” may soon be ready to take
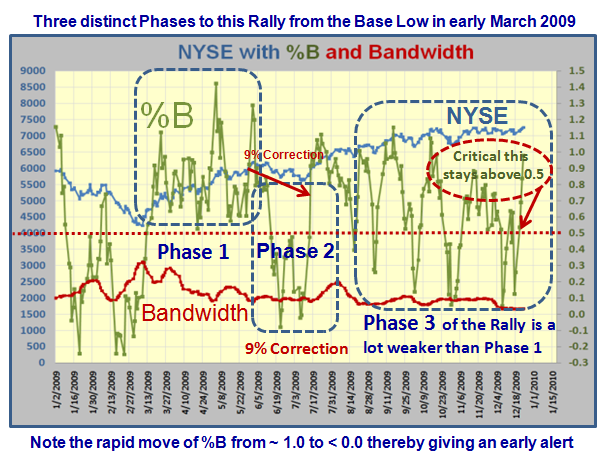
a breather and force a correction in the New Year.  The Rally has been in three Phases
as shown below, with the current phase more volatile than before.  As you will quickly
see we dodged a bullet around November 1, when the Internals all faltered, but they
have revived since.

nyse

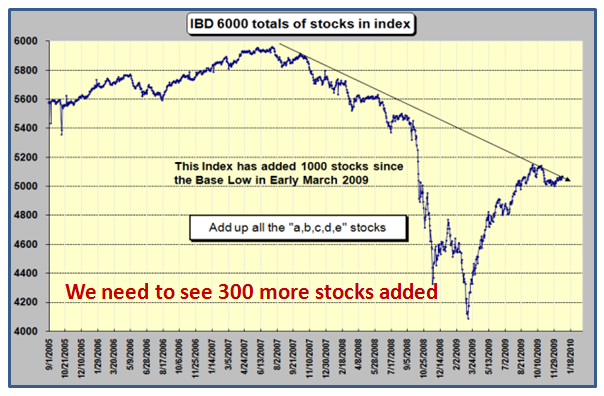
The IBD Total number of stocks peaked in 2007, and after a precipitous drop of ~2000
stocks, it has rebounded by 1000.  It needs to now add an additional 300 stocks for
this Rally to continue.

6000

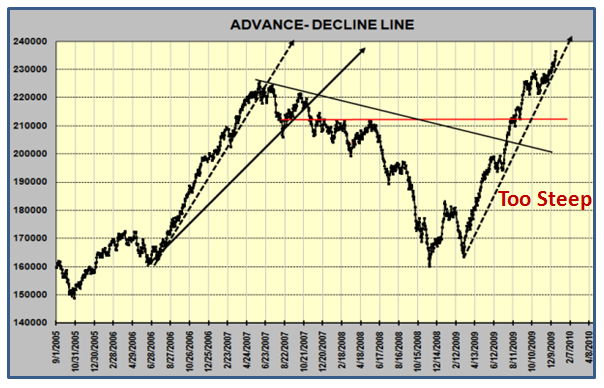
The Advance-Decline line is very healthy; infact it is too steep to maintain.  Watch!

ad

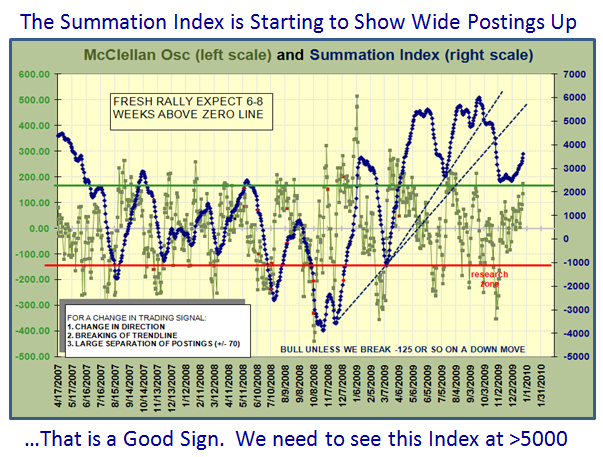
The McClellan Summation Index has bottomed and again showing signs of strength:

sum

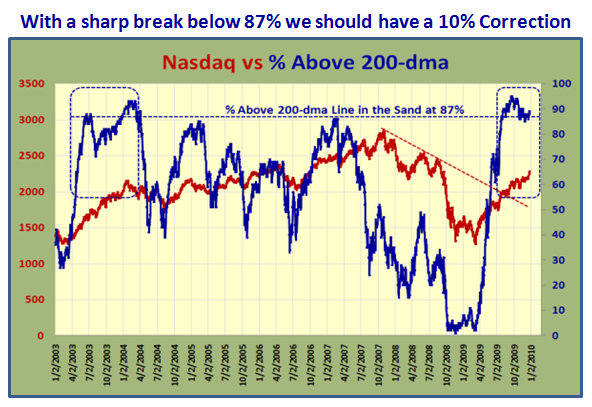
As one would expect, the stocks above the 200-dma is ~90% and it needs to stay up.
Any sharp drop in the New Year can cause concern for about a 10% correction if the
2004 timeframe is any guide.

200

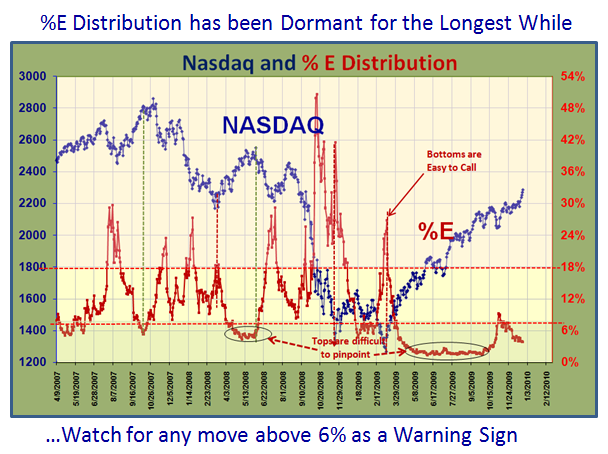
The Number of Distribution stocks %E has been dormant for a long while and any rise
above 6% should be watched for a quick distribution as shown below:

e

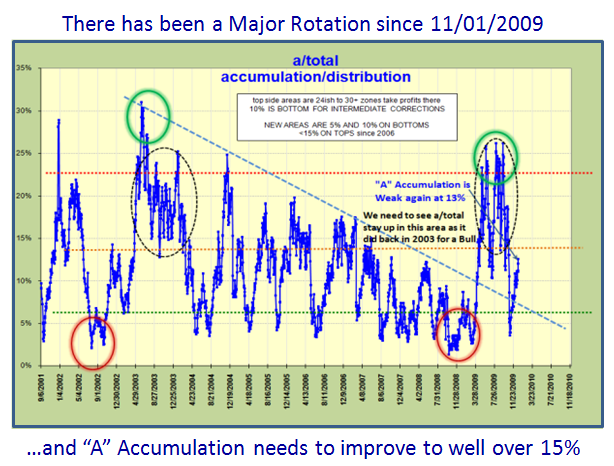
The Leadership Stocks had a Major Rotation at the end of October and is still at a low
value of 13%.  It needs to rise rapidly to show that there is indeed new leadership:

a

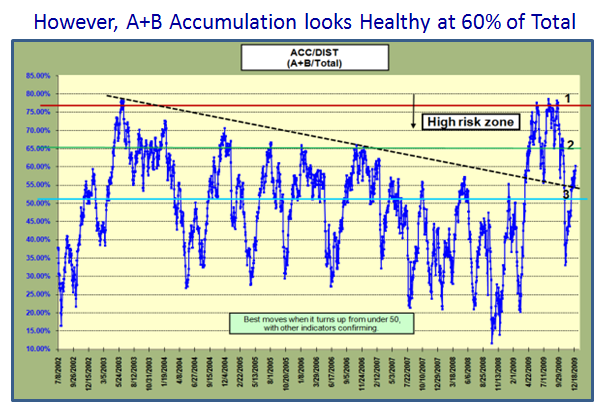
However, %A+B is strong at ~60% and needs to stay up above 65% for the rally to hold:

ab

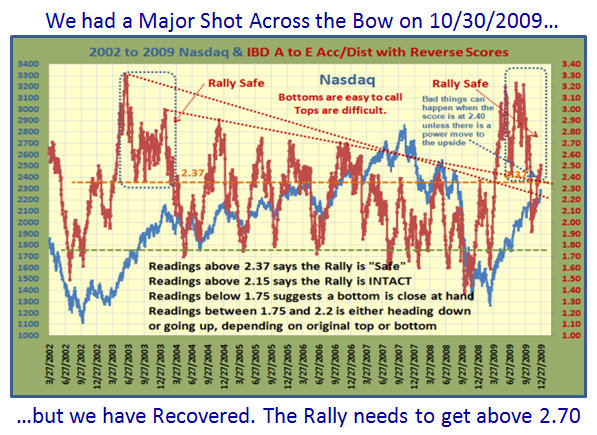
Thanks to an Idea I got from a friend Billy in Belgium, this chart uses a Reverse Score
to evaluate the ABCDE statistics.  It needs to stay above a reading of 2.37, and again
we had a serious shot across the bow in late October when it plunged to 1.90:

reverse

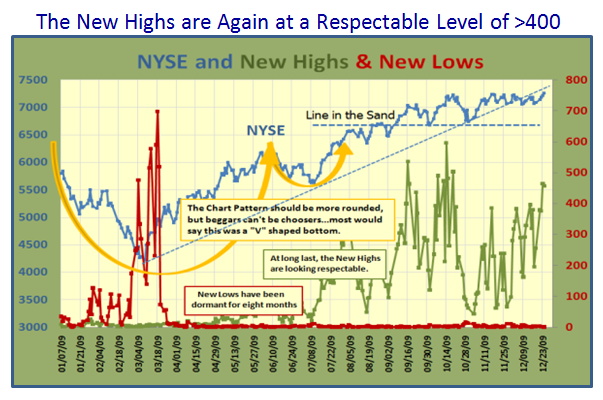
The New Highs are Strong at >400 and the New Lows are dormant as we would expect:

highs

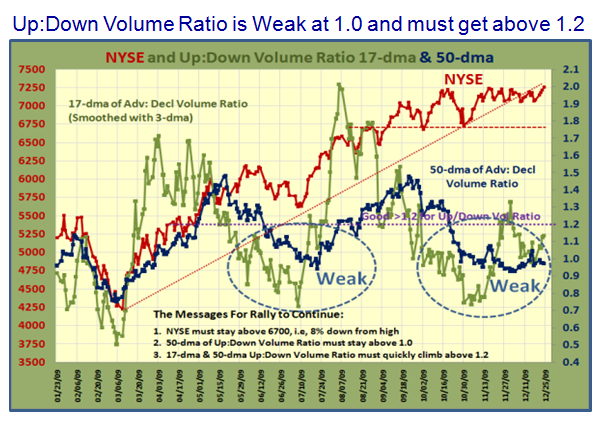
The Up:Down Volume Ratio is weak and needs to get back above 1.2 in a hurry:

updown

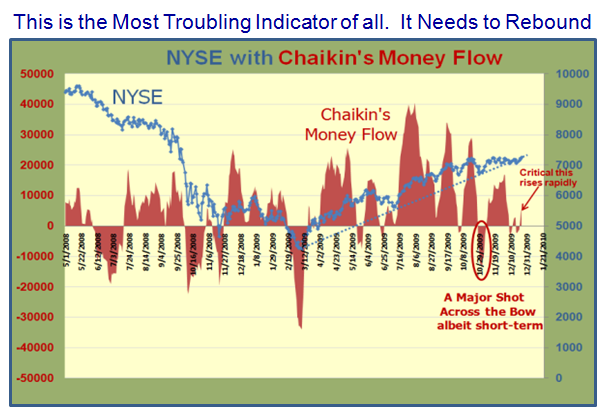
If Chaikin’s Money Flow is any indication, the Big Guns are not participating…Beware!

chaikin

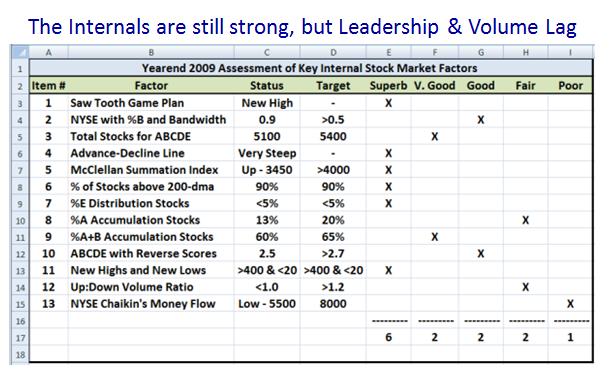
Here is the overall assessment for the Internal factors shown above.  It is a strong
report, but there are weaknesses, particularly in %A Accumulation, Up:Down Volume
Ratio and Chaikin’s Money Flow.

in

All Best Wishes for a Happy and Prosperous New Year.  Ian.

Phoenix and Kahunas Volleyed and Thundered

Friday, December 18th, 2009

It’s that time of the year again, so Season’s Greetings to you all, thanks for your continued support and all Best Wishes for 2010 from the HGSI Team…George, Matt, Ron and Ian.

santa

After another ho-hum week, the Bulls and Bears are still at the 50 Yard Line in this tug-o’-war.  You have the weekend to digest my gift to you at this festive season.  It kills several birds with one stone, particularly after registering the third Phoenix Signal yesterday in the last month, with no response from the Bulls to counteract it.  Please don’t interpret this at this stage as anything but caution, as the basic internals have not changed significantly.  The note is in three parts:

1.  How to read what has transpired over the last nine months to understand the signals working together.

2.  The Current Status

3.  What to look for and anticipate MUST happen for a move in either direction, though in this case I have only covered the downside criteria.  I am not saying they will happen, that is in the lap of the gods, but at least you’ll recognize it when you see it. 

The upside scenario is simple:  Get above 1111 on the S&P 500 with gusto; until then concern yourself with what I cover below on the downside.  
kahunas

The Last Nine Months:   

Here is my latest interpretation of Phoenix’s at this level when the Market is at or close to a High as opposed to being at a Low, when indeed a Phoenix coupled with a Bingo on the same day would signal capitulation.  We know when that occurs, and is followed by a Eureka either the next day or a few days later that there has been exhaustion to the downside.  It is time to look to the upside, be it a bounce play or a full blown rally. 

I hope by now that you have understood that I am using a combination of Richard Arms and John Bollinger through my impulse indicators measured at the EXTREMES of their formulas to show which way the wind is blowing.  In other words when they “fire”, they are rare beasts and one should sit up and take notice.  Hence, I use the NYSE with the “wc” chart to see the relationship between Eureka, Phoenix and Kahunas, but will toggle to the S&P 500 and Nasdaq for confirmation:

Let me first set the stage by saying we all recognize that to all intents and purposes, the market for the last 30 days has been in a very tight range between 1089 and 1111 on the S&P500.  The line in the sand is at 1100 as the point of demarcation between Snakes and Ladders as described in my recent blogs. 

1.  Three Phoenix signals in a row without a response from an Eureka spell the Bears are gaining control with no serious response from the Bulls.

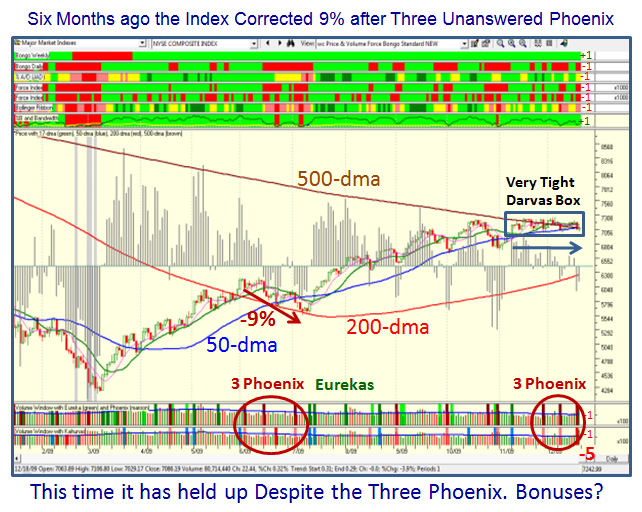
2.  The most recent example was the period from 6/3/09, 6/15/09 to 7/02/09, where we had just achieved a 42% Rally off the bottom on the S&P 500…so it was no surprise we had a correction of 9% during this period for both the S&P 500 and NYSE, and about 9.3% for the Nasdaq. 

3.  During these past nine months it is the only period where there were no Eurekas in between, suggesting the Bulls were not defending with vigor, and the Bears ruled the roost.

4.  Since then, we have noticed that every Phoenix has been trumped by a Eureka, or even two in a row within two or three days which have signaled the Rally is on again and the Bulls were flexing their muscles.

5.  …Until we get to the Dubai Caper on 11/27 which started the first shot across the bow with a Phoenix, and the market had already been in the tight Darvas Box I mentioned above.  The second was 12/8/09 (Dave doesn’t show one on 12/8 because he should have set the ARMS portion of the Phoenix to 2.43), and the latest today on 12/17/09.  What has held the Rally together is the unusual yo-yo that the market has played for the past seven weeks ever since the last Eureka on 11/9/09.  However, yesterday’s Phoenix is accompanied with a big Kahuna to the downside and on heavy volume, being expiration week.  It is also understood that much of this volume was due to CITI.

The Current Status:

Just stare at the extreme right hand side of the chart using the “wc” view and the NYSE:

A.  We can quibble about the exact count, but most will give me a score of at least -5, which is a strong shot across the bow. However, that is hardly any different than the last two occasions we had a Phoenix.

B.  The two remaining greens are the Weekly Bongo and %B which is still just above the Bandwidth.

C.  Sooner rather than later we will know if this Market will break to the downside or continue up, but all are waiting for “When will that happen?”  

So here is what to look for on the Downside:

1.  The %B will go down through the Bandwidth and turn from green to red. The reading is 0.15, so it should be the first to go.  If the drop at this stage is >-0.35, with another Kahuna to the downside, we will have the key one day signal that this Rally is over.

2.  The NYSE Index is just below the 50-dma and for that matter the 500-dma, and any move down further, coupled with the S&P 500 crossing below the 50-dma, i.e., below 1089 with gusto will do the trick.

3.  Bongo Weekly at last turns negative and that will really open up Dave’s beady eyes!  Stay calm until then, but it is a late signal.

4.  However, the real zinger will be when the %B reaches a reading of -0.2 or worse, as that has only happened nine times before in the last 12 years, three of which led to the 1987 crash, and two during the 2008 Black Swan dive. 

5.  Now please understand that when the Bollinger Bands are as tight as they are now, i.e., Bandwidths of less than 0.03, it is an unusual state and last happened for any length of time around the late 2006 to early 2007 timeframe, before there was a sharp drop of about 5% in a week.

6.  Don’t expect any Bingos to appear before the RSI on the NYSE gets below 30…the reading is up at 47 at the moment, so we would have to see a total deterioration of the Index for that to happen.

The Three Scenarios to the Downside:

A.  No worse than an 8% correction

B.  A 12% to 16% Intermediate Correction, and you will feel the pain

C.  A complete Nose Dive for another Bear Market Correction, and you already know what that feels like.

I say to you “Follow the Signposts with the wc chart”and you will stay on the right side of the Market.

Best Regards, Ian.

Stock Market Snakes & Ladders are Back

Wednesday, December 9th, 2009

We have had a few ho-hum days after the shot across the bow with the Dubai Caper a week ago, and as I pointed out in my last blog note, the market has hit its head against an Immovable Object of 1111 on the S&P 500.  Net-net, we are back to playing Snakes and Ladders and even the most seasoned of Day Traders are cautiously looking for any clue as to whether they should go short or stay long.  Given the dismal volume it seems that many have even decided to move to the sidelines to wait for a definitive signal of which way the wind is blowing.  Yesterday we had a second shot across the bow with Phoenix yet again after the Dubai one, so caution is the word of the day. 

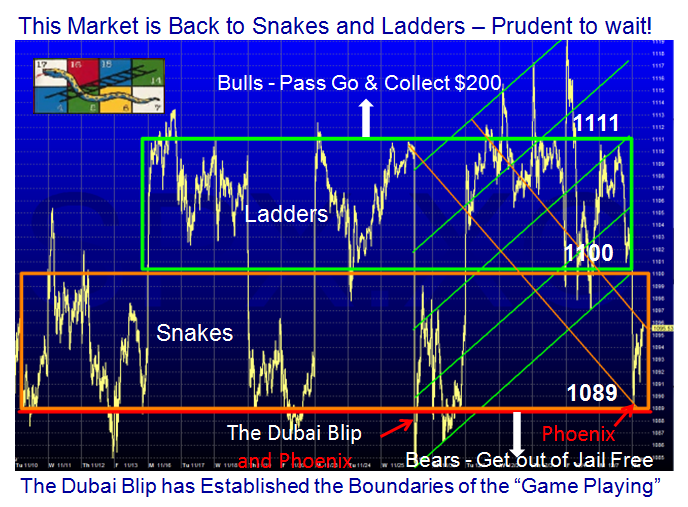
The Dubai Blip set the parameters of the current playing field and as you can see from the chart below of the S&P 500, it is stuck in a tight Darvas Box from 1089 to 1111, with 1100 conveniently being the half-way Line in the Sand.  Until there is a breakout to one or the other side of these two numbers, the Market will continue to yo-yo every two to three days in a trading range.  Only very short term players need apply, and Type 3 and 4 Players can snooze.

snakes

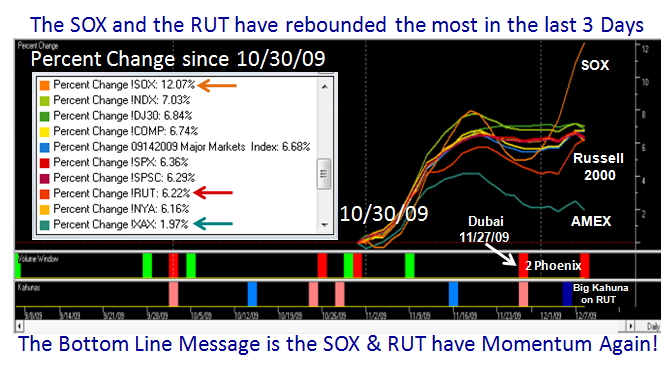
The Leaders in this market since the Base Low of 667 in early March of 2009 have been the Russell 2000 and the SOX, so the Small Caps have been  the primary action these past nine months.  It was only natural that these same two Indexes gave up the most ground during their recent correction which bottomed on 10/30/2009.  Since then the SOX has been on a tare, and at long last in the past couple of days the Russell 2000 has woken up again and produced a Big Kahuna on 12/4 to show it again is gaining momentum.  Whether it can catch up to regain the lead from the SOX remains to be seen:

black

The Bear Camp:

1.  Market is in an Ascending Wedge which usually resolves itself to the downside
2.  Psychological Indicators show the Bull: Bear ratio at a five year low, hence bearish
3.  NR7 tight signal suggested initial breakdown, but watch out for a fakey
4.  The market is slowly producing a rounded top…Tops take a long time to establish
5.  At 64% up from the Base Low, the S&P 500 is now at initial Viagra Rally levels.
6.  Bears are cautiously optimistic, but caught once too soon so are not pounding yet
7.  A second Phoenix in seven days shows Bears strengthening
8.  Market Internals are starting to slump and show signs of weakness

The Bull Camp

1.  Traditional Seasonal Rally still looks good…”let’s keep it up till fat bonuses at hand”
2.  Bernanke soothing the markets with no tightening yet and focus on two criteria:
     a.  There are no deflationary cycles
     b.  The financial system is stable
3.  Although both the SOX and Russell 2000 were hit hard, they are recouping fastest
4.  Technology and Transports strong with a preponderance of leading stocks
5.  QID/QLD total dollar ratios are at lowest levels; will take a while to emerge

The Bottom Line is the Bulls win if we move up with momentum above 1111, and the Bears will at long last Get Out of Jail Free if it goes below 1089.  The second Phoenix yesterday says the Bears have control so watch out until we see an Eureka…The RoadMap to Hog Heaven is still working!

Best Regards, Ian.

The Stock Market has Met an Immovable Object

Thursday, December 3rd, 2009

The Market is marking time waiting for the Unemployment Report due out tomorrow, and by the looks of things it seems we may have had a leak that the numbers are not going to be good, given the late sell off in the last half hour.  Neither the Bulls or the Bears have been willing to make a major commitment and the Line in the Sand these past 16 days has been at the convenient easy number to remember of 1111.

sinatra

The Bulls held a slight edge with the S&P500 sitting at 1110 until the last half hour drove it down to just under 1100. Fortunately we have a tight Darvis Box around the last 16 days trundling back and forth between 1110 and 1085, so it is not difficult to make a call to the downside if the report is wishy-washy and the S&P500 breaks 1085 to the downside.

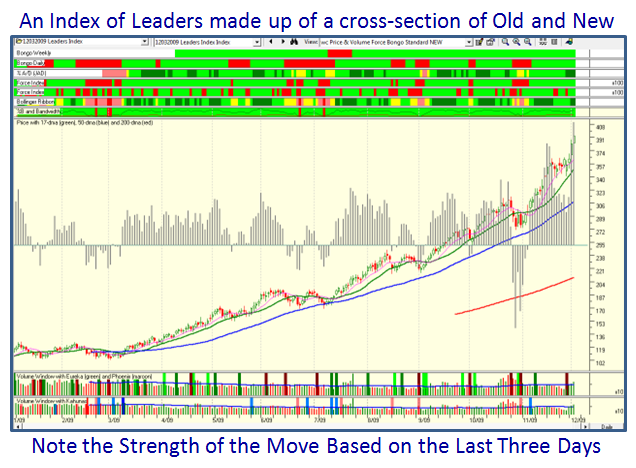
At times such as these where the market can go either way, it pays to think out of the box and find a set of old and new Leaders based on their recent performance.  I have picked four distinct groups of five stocks each, and those that follow my blog will soon understand why.

There are plenty of new name leaders that have been making a move, including CAAS, HEAT, RINO, TSTC, and MELI.  Likewise, the likes of AMZN, REV, MED, LFT, and CREE have also shown their stripes.   Yet again some old favorites which have been basing and yo-yoing for the past few weeks are poised to go again such as SXCI, CRM, FIRE, VPRT, and RHT.  Throw in the Old Silverbacks like AAPL, GOOG, BIDU, PCLN, and ISRG which have been relatively quiet of late and we have an Index that will quickly tell us which way the wind is blowing.

Naturally, this group is heavily biased towards Technology, which is always a favorite Sector to lead one out of the doldrums.  However, the Index provides a good cross-section of 16 different Industry Groups and no more than two stocks in any one Group.  If the Santa Claus Rally is on, be rest assured this Index will be really fat with profits and leading the way.  If not, it should give an early warning since it is already fat with profits anyway.  Here is what the Group Index looks like:

index

Now don’t all shout at once…yes the HGSI Team is working on goodies for the next seminar in March 27 to 29, 2010 and I am giving you a peep show of just a fraction of what we will have for you. 

In honor of a very fruitful luncheon I had with John Bollinger this past Tuesday thanks to my good friend Chris Wilson making a charitable donation for “Take a Technician to Lunch”, we have now incorporated a couple of ribbons which are new to the “wc” chart you are all familiar with.  This work is in beta test at the moment, so NO amount of yelling and screaming will give you what you see. 

However, take it as the HGSI Team’s early Santa Present for you to drool over as we raise the bar one more time in March.  Yes, it is hard coded in the software so it comes up in a flash, and there will be no more excuses not to use the RoadMap to Hog Heaven with the wc chart!  Lurkers…it’s time to buy the software.

Good luck and good hunting.

Best Regards, Ian.

Copyright © 2007-2010 Ian Woodward
Disclaimer: Commentaries on this Blog are not to be construed as recommendations to buy or sell the market and/or specific securites. The consumer of the information is responsible for their own investment decisions.