 Ian Woodward's Investing Blog
A Bear Market Looms Unless we get a Miracle
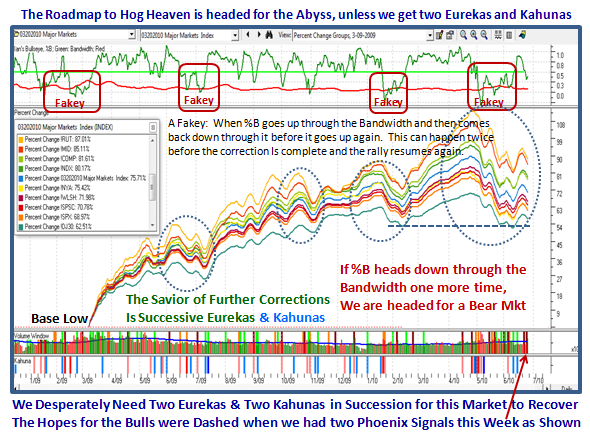
I sat and watched Ghana defeat the USA in the World Cup this afternoon and I guess it adds to my gloom as I try to make sense of what has transpired this past week on the Stock Market. After surviving a 14.4% correction on the S&P 500 with two Eurekas and Kahunas, it seemed that we were at least headed for a decent rally before we hit resistance at the Heads and Shoulders Top area I warned you about. It was not to be…we are now sitting with a couple of quick Phoenix Impulse Signals this past week to show that the Bears are once again firmly in control.
The net conclusion is that this market is in Oscillation with Intra-Day, Intra-Week and Inter-Week Volatility the likes of which we haven’t seen since the Black Swan Days of October and November 2008. It may be a trifle early to be trotting out an old favorite picture at this juncture, but let’s blame it on my mood with the loss in the World Cup.

I have made good friends through this medium with a man named Billy who lives in Belgium and whose work is second to none, which he shares willingly and helps me understand the very short term trading that is the vogue these days…of necessity. He has a good sense of where the Large Players are at and the way the wind blows, not withstanding the High Frequency Traders (HTFs) we have to tolerate who can push the market as they please when volume is low. Just look at the see-saw action with big up and down days this past seven weeks and you will see that this Market is not for the faint of heart.
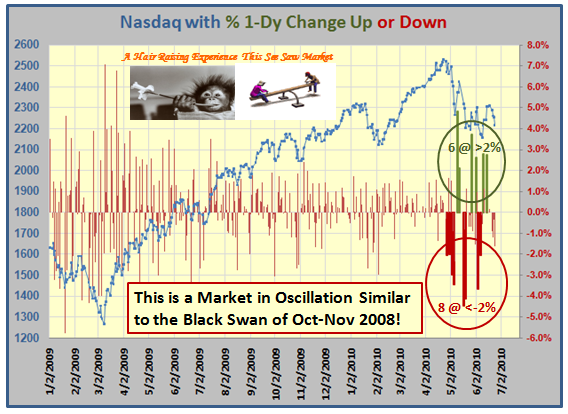
Those of you who follow my blog regularly have now become accustomed to seeing the value of this next chart as time goes by. The Red, Orange and Green Bars at the right hand side of the Chart says it all to describe the extreme volatility and echos what we have seen in the frequency of big 1-Day swings in the chart above. By the way, please understand that these positive and negative Impulse Signals of the ARMS Index (TRIN) coupled with the Kahuna Signals shown in the bottom window are “rare beasts” as they occur at the “Fat Tails” end of the Normal Distribution as John Bollinger calls them. That is the true value of the chart, i.e., Volatility not seen before in the eleven years of history.
Some people like to see numbers instead of words. I will warn you please do not write to me and say you can’t see the NUMBERS…that is not my purpose for even sharing this research with you. My purpose is to show you that we are able to take John Bollinger’s %B and my %B 1-Day Change (Kahuna) to a higher level, by displaying the so-called “Interior Decoration” of the 10 Market Indexes and its Composite Average for these two factors. My good friends Bill Roberts and Tom Ellis produced this chart for me and I thank them.
As you can see the colors speak for themselves where obviously Green means good and covers a %B range for above 0.8, i.e., close to the Upper Bollinger Band, 0.2 to 0.8 is in white where numbers below 0.6 to 0.2 is the area where the stock is potentially vulnerable and is the zone I call “Fakey”. It ties in with the description on the previous chart, and can turn a potentially good rally on its heels and is an area of caution. Anything between 0.2 and “0” (zero) is colored Yellow and therefore extreme caution, and below “0” is Red as that means the Index is below the Lower Bollinger Band.
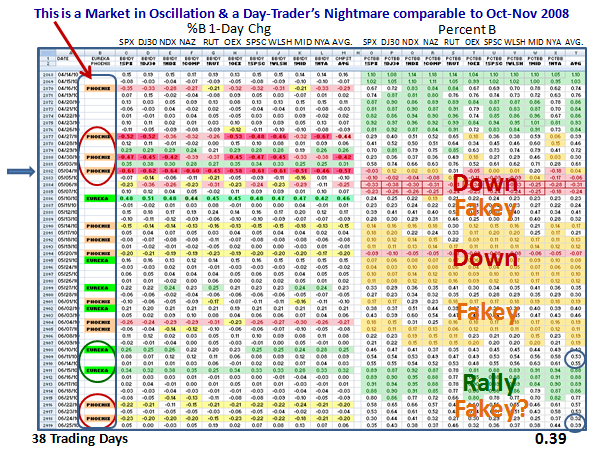
For those whose eyes are rolling in the back of their heads and are only interested in the bottom line, the message is that we have not seen action like this since the MAJOR DISASTER back in Oct-Nov 2008, and the only exception is that so far we have been spared with only a 14.4% correction on the S&P 500. My point is that with this amount of volatility we have an extremely unstable market and can potentially head down into a Bear Market if there is no Major Bounce and strong rally next week. Note that the Composite %B for the ten Indexes is at 0.39, and one more Phoenix to the downside will be enough to throw this Market back into the red on the chart.
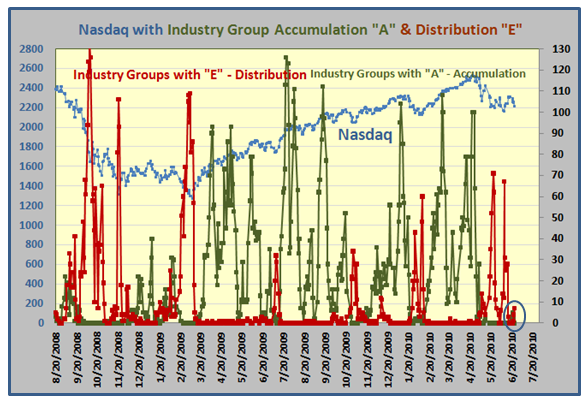
To add salt to the wounds, just look at the next chart which shows the Industry Group “A” Accumulation and the “E” Distribution and we can see they are both in limbo…a standoff. “E” Distribution was recently as High as >60 Groups or about 40% of the Groups, but it has retreated after the attempted Rally two weeks ago.
You know me better than to leave you hanging without giving you some feel as to what to look for next week. Time and time again simple tools have given us the clues. We have seen the value of the High Jump which accurately gave us the reasonable expectation for when this market would top, which I featured on this blog several moons ago.
Now my good friend Mike Smith sent me this picture to remind me that it is time to get out the “Low Jump” or Limbo Bar as I like to call it. It proved valuable during the Black Swan days, so here first is the picture of Chubby Checker doing the Limbo just to remind you of fun times past:
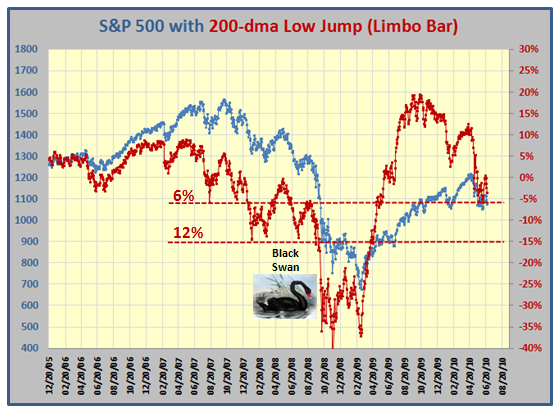
We are close to the -6% line DOWN from the 200-dma to the S&P 500 Index so watch out that it doesn’t go any lower:
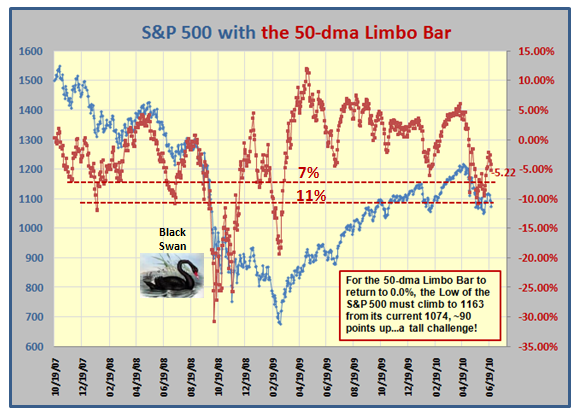
…And here is the picture for the 50-dma. The message is simple, we CANNOT see more than 6 to 7% down, before the floodgates start to open:
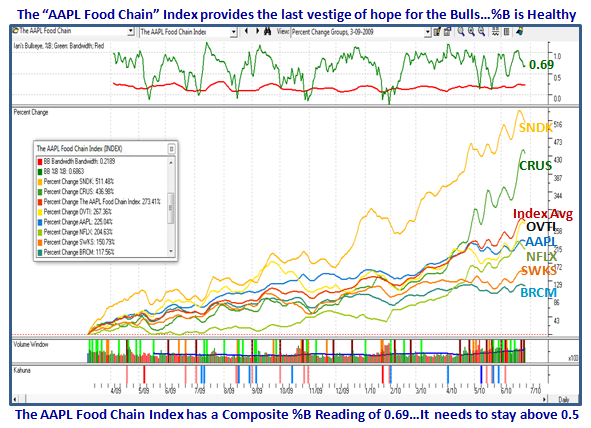
Over the past month or so I have focused you on just one stock…AAPL. Now, I give you the AAPL food chain to enjoy. As you can see these stocks in this next chart have prospered due to their close ties in providing components to Apple’s product line. The important thing from this chart is that the Composite Index %B is at 0.69…far higher than the 0.39 I showed you earlier for the Composite of the Market Indexes. These stocks should be watched carefully next week to see if they hold or give up the ghost. They are the last vestige of hope for the Bulls, but are vulnerable as they are fat with profits:
Best Regards, Ian.
