The Stock Market is Under the Weather
We have Reversal Days and Distribution Days, but the Stock Market Indexes keep climbing up a Wall of Fear:
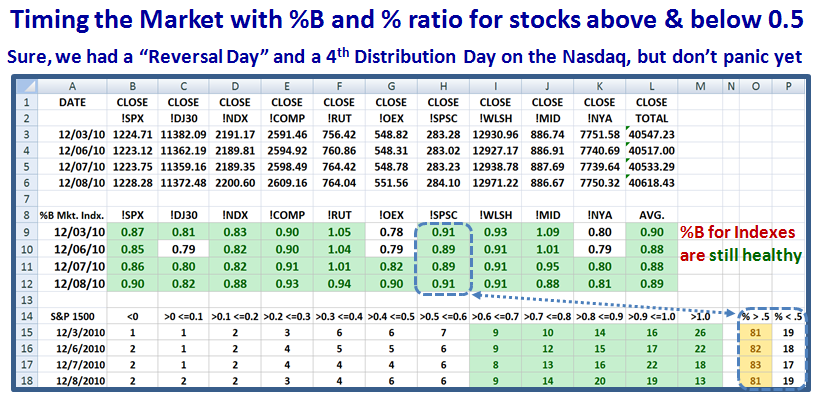
So let’s see if we can disect which way the wind is blowing by using John Bollinger’s %B and also the excellent insight we can get using HGSI and Edgerater for the Internals of the Market with the % Ratio of Stocks in the S&P 1500 above and below %B of 0.5, the Middle Bollinger Band:
The Simple Steps in the Process are:
1. When the Ratio falls below 70:30 “Get Ready” and
2. When it goes to 65:35 “Get Set” and if
3. It skips buckets with a Phoenix and a Kahuna to the Downside with a 45:55 ratio “you’re outta here, but too late!”
However, %B for the Indexes themselves have a big cushion now, ranging from .82 to .94. Watch out as they lose strength to 0.7, and then below 0.5.
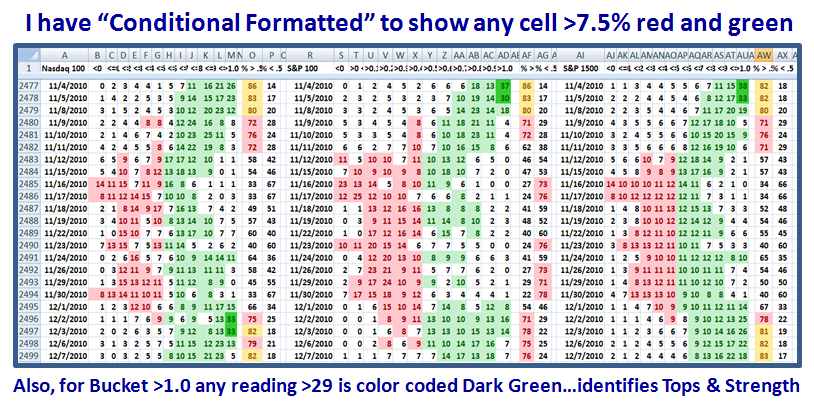
You have seen past examples of the following chart, which show a “scrunched view” for the %B Buckets for the Nasdaq 100, the S&P 100 and the S&P 1500:
Back on 11/04, the ones to watch were the S&P 100 & S&P 1500; Note that on 11/11/2007 the S&P 100 gave the early warning sign and had reversed the next day…eight days from Top. Note how 11/12 saw the tide turn and you had at least two days to be “outta here”!
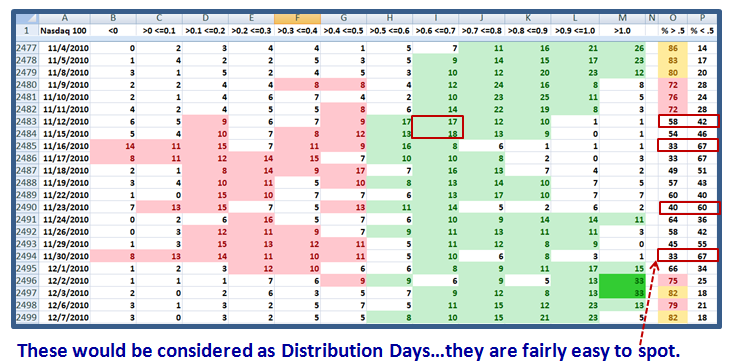
Now it is the Nasdaq 100’s turn. We are in Day 4. Note the readings of 82, 76 and 83 on 12/7 says the Market Indexes are in the Safe Zone. Begin to worry when they come down to 70:30, and for sure when you see it at 65:35.
The Nasdaq 100 Index is the current leader and naturally fat with profits:
Start Counting “Twelve Drummer’s Drumming” from the day after 12/2/2010. We are currently in day 4, and have eight more days of cloth.
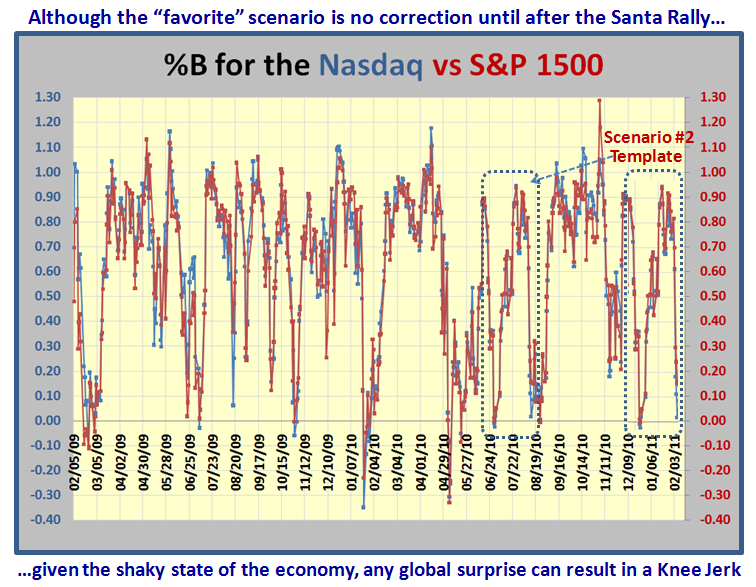
One of two Scenarios will tell us what’s happening:
1. Column M rises again to solid “green numbers” of 12 or higher…All’s well, or
2. Column “I” moves up to >17 and “O” and “P” move down to < 65:35 and we are about to cave in, or will have done so already. It’s not difficult to follow.
With the first Scenario, if we get above 30 again, the rally is confirmed as still very strong and we start a fresh count as explained above.
With the second Scenario, here is a template of what one might expect and still have time for a Santa Claus Rally, though the Moose Dropping will be very apparent:
There you have it. Best Regards, Ian.
 Ian Woodward's Investing Blog


