Stock Market: Relief from the Fed at Jackson Hole?
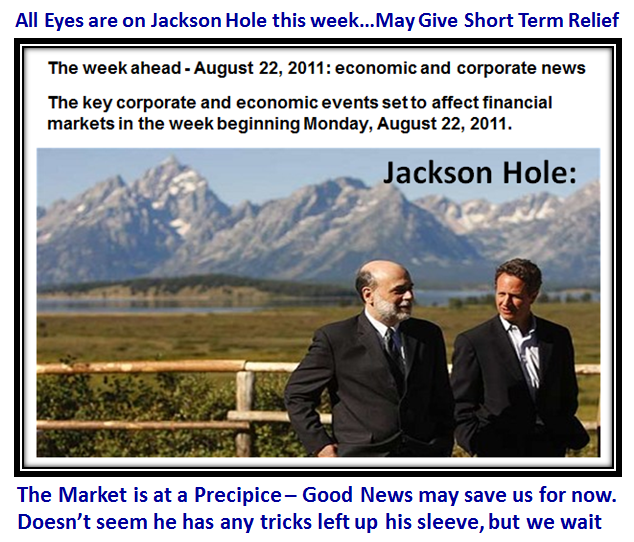
Don’t count on it, but it seems all eyes are turned to the Fed Meeting in Jackson Hole this week, so we shall see if Uncle Ben has any last tricks up his sleeve. The hot news as I write is the fall of Libya to the Rebels and we hope and pray that the unrest settles in that area.
I couldn’t resist a second picture to be careful if the Market suddenly turns euphoric and drives up in an unprecedented manner…we are not out of the “Hole”!
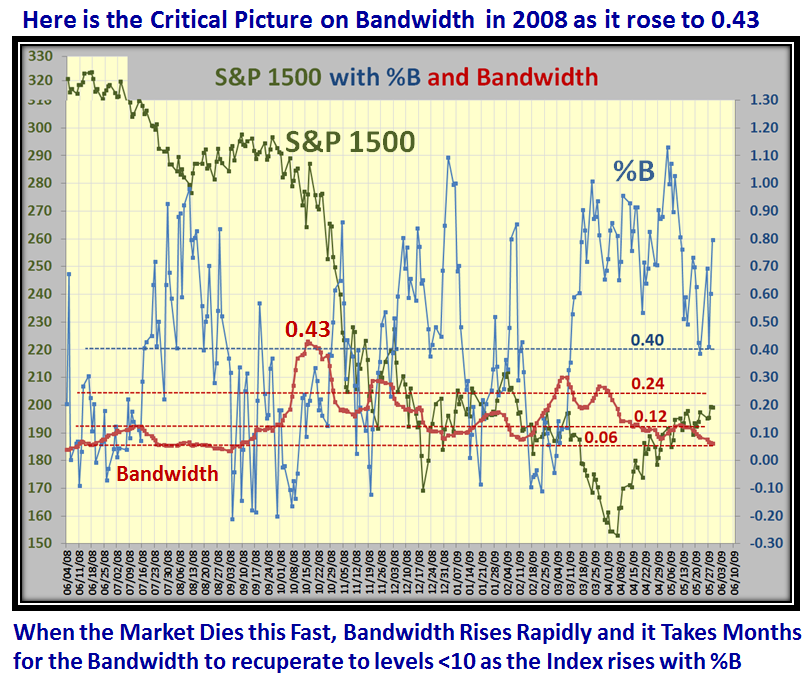
I bring back a key slide from yesterday’s blog note, so that you can maintain continuity with what I have researched with regard to new ground on the subject of John Bollinger’s Bandwidth.
I must admit that Bandwidth is not my primary focus, but in view of the recent precipitous drop in the Indexes, I felt it important to understand what recent changes I can glean in this Indicator as I compare the current recent alarming rise in Bandwidth with the Black Swan drop in 2008.
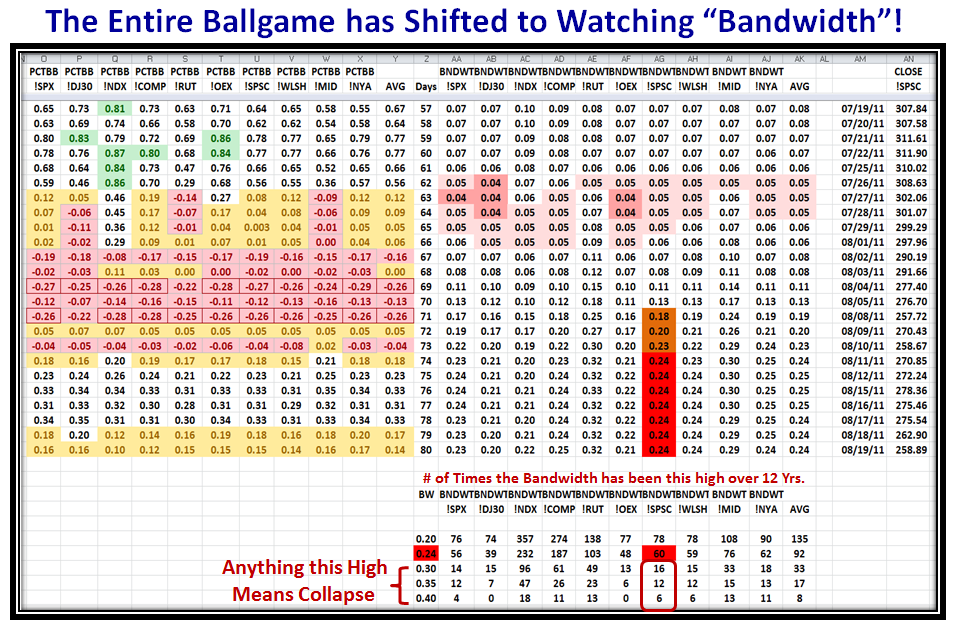
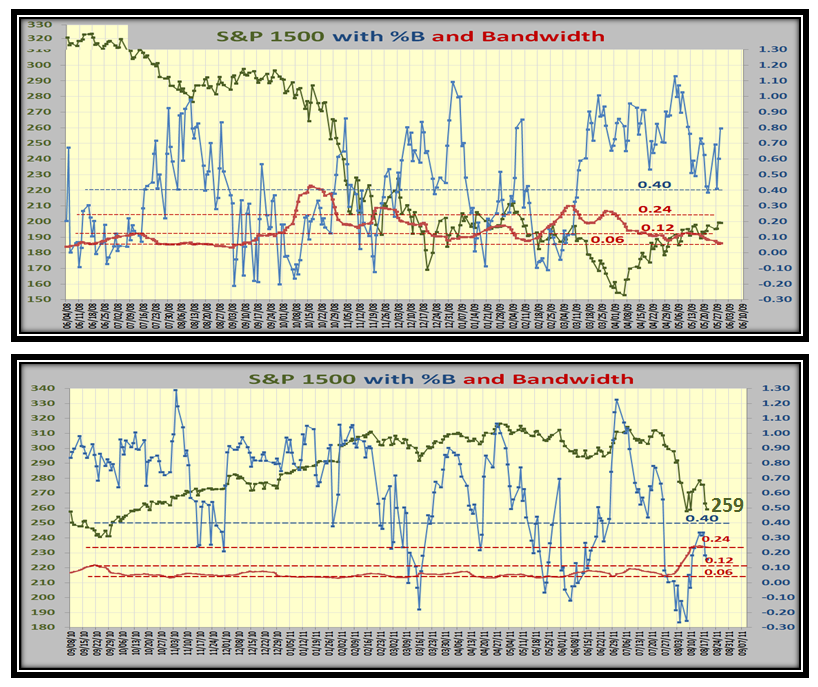
Here is a Chart I have not shown before, but is what got me excited to keep an eye on this to see if the Bandwidth shown on the Right Hand Side either rises sharply from here or trots back to its normal calm state below 0.10 as shown below. Anything higher than 0.24 suggests from past history that we are in for a precipitous fall, as I will evolve for you with charts to back it up based on the Black Swan Stake in the Ground and Measuring Rod we learned back then:
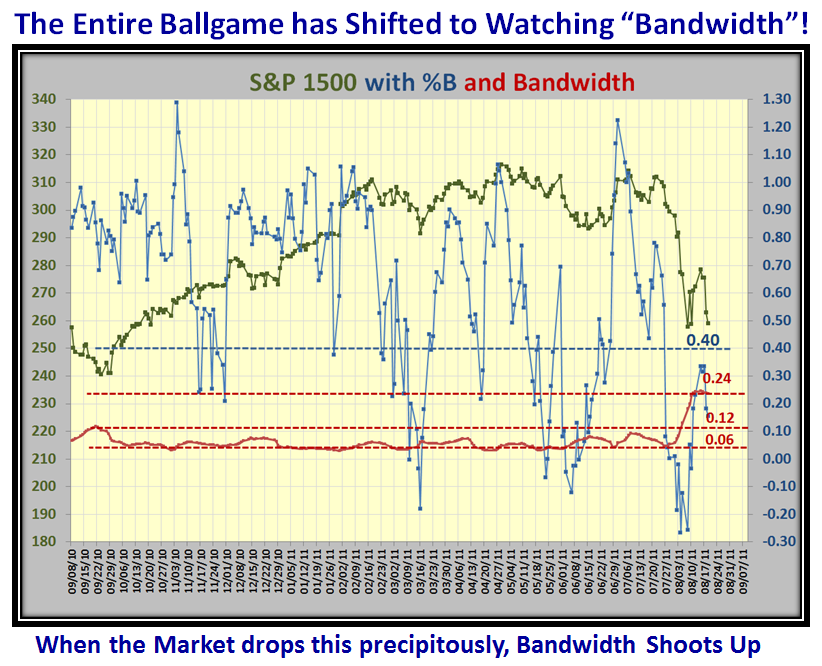
This next chart is what caught my eye to evaluate Bandwidth at this critical juncture. When the Market drops precipitously, Bandwidth shoots up:
Now for our Stake in the Ground, let’s look at the 2008 timeframe when the Bandwidth on the S&P 1500 shot up to 0.43 and then note how long it took to subside. Markets do not come back quickly when they are badly trashed and my objective is to carve up this chart to show us possible High, Middle and Low Road Scenarios:
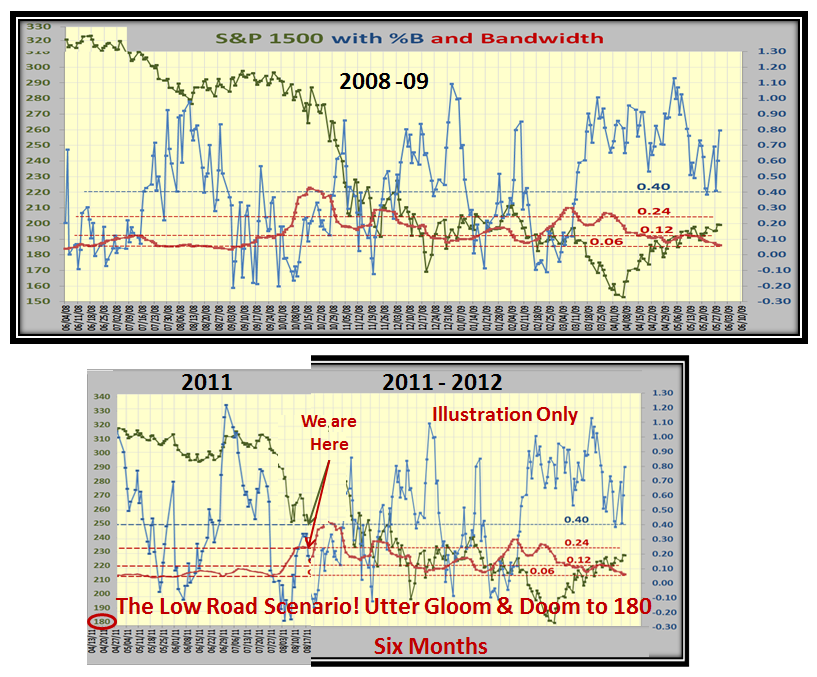
Before assessing the alternative scenarios, the following chart shows the comparison of 2008-09 with 2011-12 for a period of a year. You can immediately see that the rise from the Last Rally starting in September, 2010 until recently recorded Bandwidth numbers that were less than 0.10. However, over on the right you immediately see how this has popped up to the 0.24 level I showed you a few slides above, as we had that five Bucket drop in %B on 7/27/11:
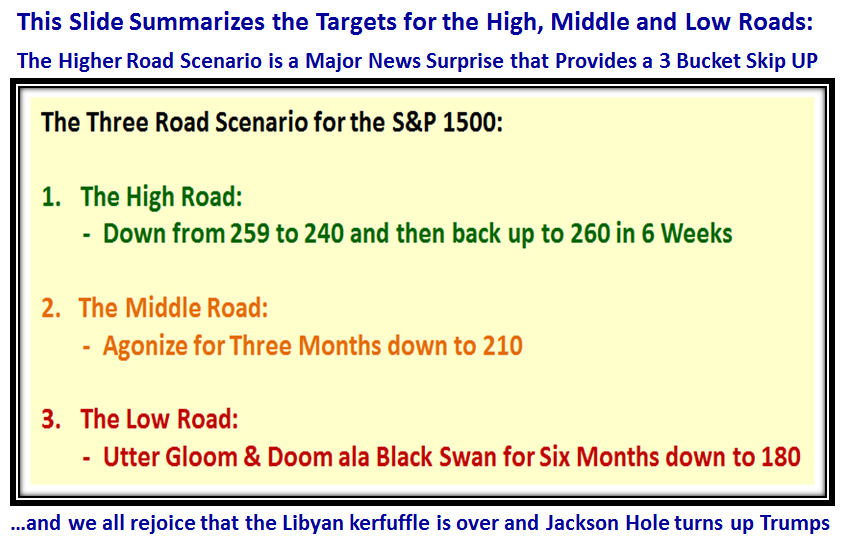
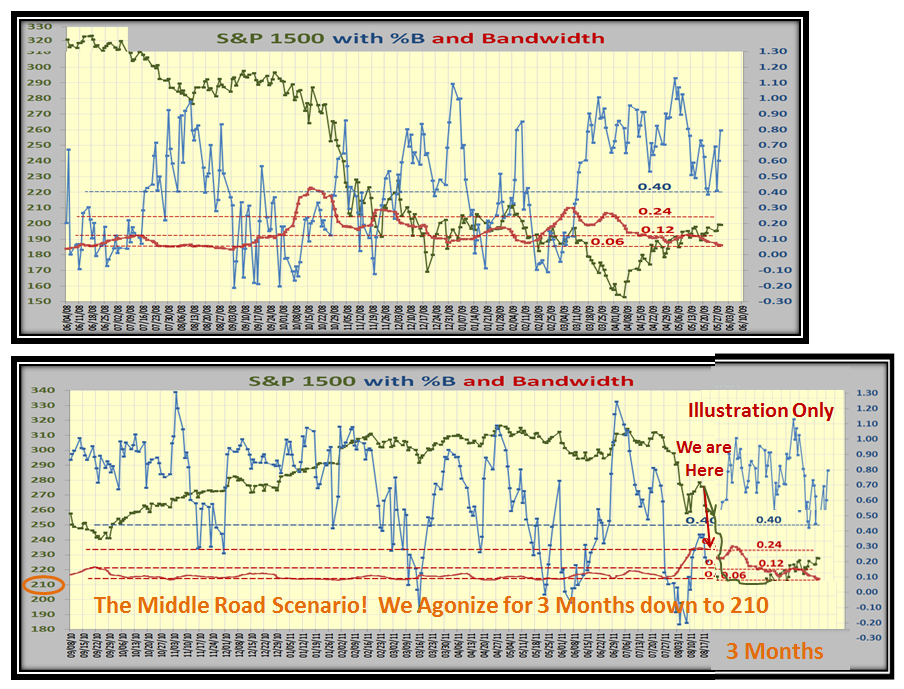
The following chart says in words what follows in pictures summarizing the three Road Scenarios. Note there is a Higher Road Scenario not shown, but it is not difficult to visualize what must happen if there is superlative news to the upside which causes the Market Indexes to Bounce at least three Buckets up. We will embrace that news and breathe a sigh of relief when we see it:
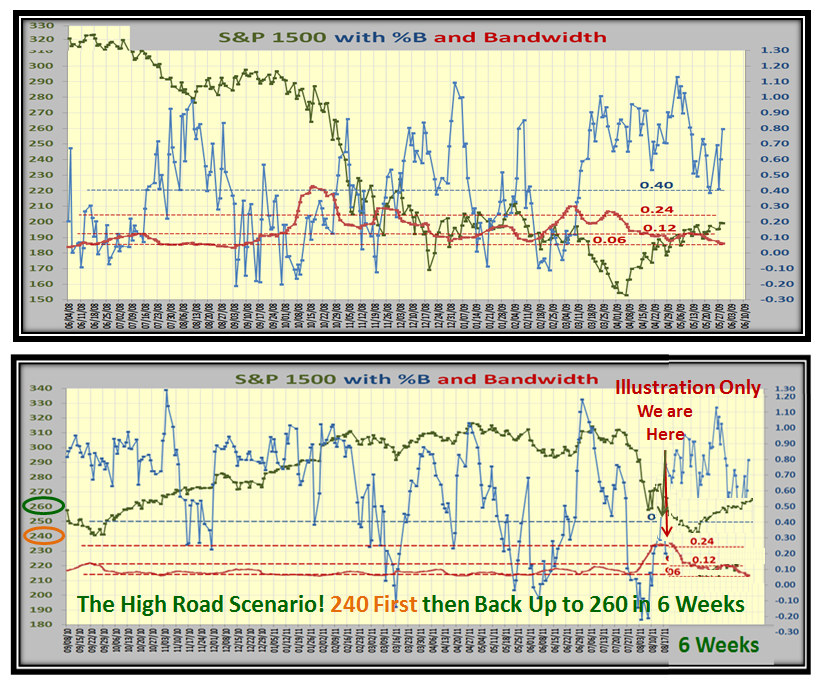
As promised, I have done my usual trick of slicing and attaching the picture from the past and sticking it on the end…Here is the High Road Scenario:
…And here is the Middle Road Scenario:
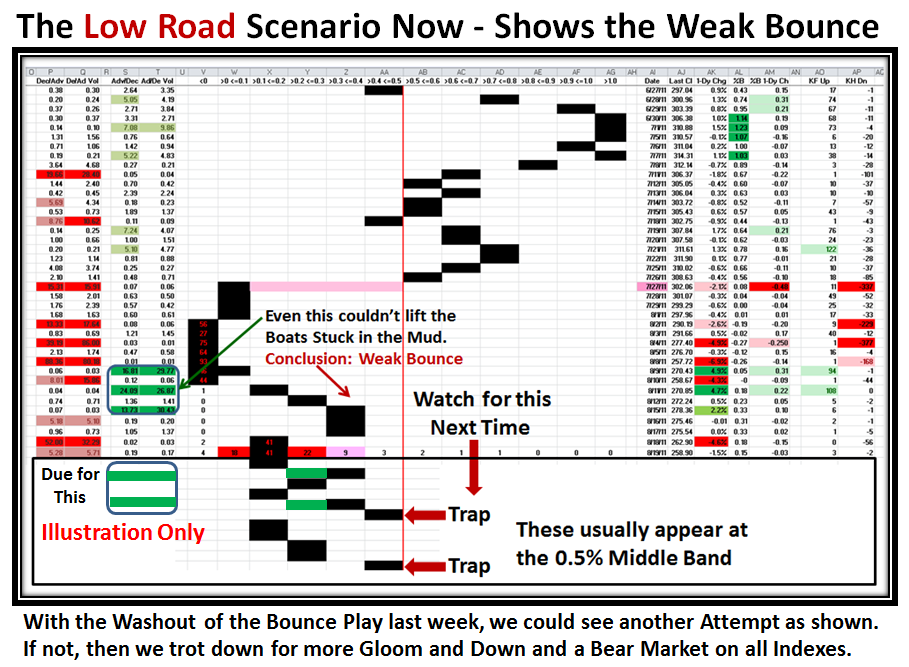
…And Finally, to round things off, here is the Low Road Scenario…Heaven help us if we trot down to these levels:
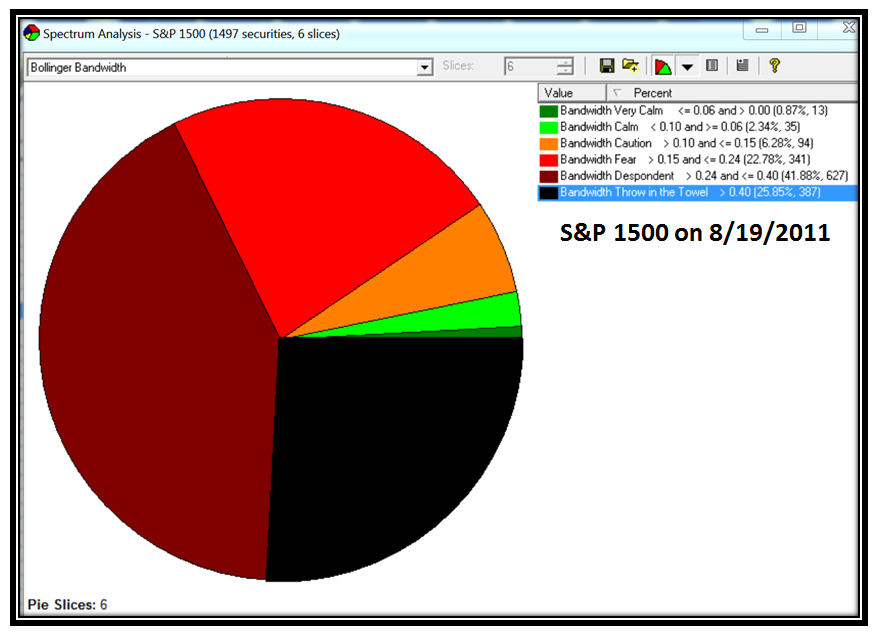
Here is an Update with a bonus for HGSI Users. I put this together after I posted this note. Unless you are a whiz at making your own Pie Charts you won’t find it in the current software. Ron and I will work on an update:
Give me some feedback as to whether this appeals to you, makes sense and moves the ball forward or not. All you have to watch next week is whether the Bandwidth rises or drops sharply from 0.24 as you view it in the HGSI Software for Major Market Indexes.
Best Regards, Ian.
 Ian Woodward's Investing Blog